Climate for Station: Dubai Intl, Dubai, United Arab Emirates
Loading live weather...
Climate Analysis & Overview
Dubai International Airport is experiencing a warming trend, with significant increases in temperature extremes and a dramatic rise in precipitation concentration. These changes align with the UAE's broader climate challenges, highlighting the need for adaptive strategies.
Desert Heat Intensification
Dubai International Airport sits within a hot desert climate (BWh) according to the Köppen classification. The region's geography, characterised by arid desert expanses and proximity to the Persian Gulf, significantly influences its climate data. Over the past decade, the high temperatures have increased by 0.93°C (1.67°F), while low temperatures have risen by 0.58°C (1.04°F). These trends are more pronounced when considering the all-time data, where highs have risen by 0.45°C (0.81°F) and lows by a more substantial 0.91°C (1.64°F). This warming trend is consistent with global climate patterns and underscores the intensification of heat in the region.
Precipitation Patterns: A Concentrated Shift
The Precipitation Concentration Index (PCI) at Dubai International Airport has seen a significant increase from a baseline of 35.3 to a current value of 84.6. This suggests that rainfall events have become more concentrated, occurring in fewer but more intense episodes. Such a shift can lead to challenges in water management and infrastructure, given the region's reliance on efficient water use and the potential for flash flooding during intense rainfalls.
Temperature Extremes: Record Highs and Lows
The all-time temperature records at Dubai International Airport highlight the extremes of its desert climate. The maximum recorded temperature is 49.0°C (120.2°F), while the minimum has dipped to 0.8°C (33.4°F). These extremes reflect the vast thermal range experienced in desert environments, where daytime heating and nighttime cooling can be stark.
Regional Climate Goals and Adaptation
The United Arab Emirates has been proactive in addressing climate change, with initiatives aimed at reducing carbon emissions and increasing renewable energy use. The warming trends and increased precipitation concentration at Dubai International Airport align with the broader regional challenges posed by climate change. These data points underscore the importance of continued investment in climate resilience and adaptation strategies.
Implications for Future Climate Resilience
The observed trends at Dubai International Airport suggest a need for enhanced climate resilience measures. The significant warming and concentrated precipitation patterns could impact everything from infrastructure planning to public health. As the UAE continues to develop its climate strategies, these data provide crucial insights into the specific challenges and opportunities for adaptation in the region.
Station Statistics
10-Year Trend
High: +0.65 °C/decade
Low: +0.51 °C/decade
Rain: +0.30 mm/decade
25-Year Trend
High: +0.42 °C/decade
Low: +1.24 °C/decade
Rain: +0.06 mm/decade
50-Year Trend
High: +0.38 °C/decade
Low: +1.25 °C/decade
Rain: -0.05 mm/decade
All-Time Trend
High: +0.44 °C/decade
Low: +0.91 °C/decade
Rain: -0.03 mm/decade
Percentage Above-Average Days
Last 12 Months: 53.2%
This Year: 52.9%
Precipitation Concentration Index (PCI) ℹ️
Last 12 Months: 51.0
Historical Average: 40.2
Percentile Rank of Last 12 Months ℹ️
High: 91st percentile
Low: 96th percentile
Rain: 72nd percentile
Change in Variance ℹ️
High: -2.3%
Low: -3.0%
Intraday: -44.5%
Data Coverage
67.5%
First Year of Data
1944
Station Location
Historical Weather Records
| Max High | Avg High | Min High | Max Avg | Avg Avg | Min Avg | Max Low | Avg Low | Min Low | Max Precipitation | Avg Precipitation | Max Snow | Avg Snow | |
|---|---|---|---|---|---|---|---|---|---|---|---|---|---|
| Record | 49.0 °C | — | 15.7 °C | 41.9 °C | — | 12.8 °C | 38.0 °C | — | 0.8 °C | 71.0 mm | — | — | — |
| January | 32.2 °C | 24.2 °C | 17.0 °C | 25.2 °C | 19.5 °C | 12.8 °C | 22.2 °C | 15.0 °C | 0.8 °C | 49.8 mm | 0.5 mm | — | — |
| February | 37.5 °C | 25.6 °C | 15.7 °C | 31.6 °C | 20.6 °C | 14.1 °C | 26.8 °C | 16.0 °C | 5.9 °C | 71.0 mm | 0.6 mm | — | — |
| March | 41.3 °C | 28.7 °C | 18.0 °C | 33.0 °C | 23.3 °C | 16.2 °C | 29.8 °C | 18.5 °C | 9.1 °C | 48.1 mm | 0.6 mm | — | — |
| April | 44.0 °C | 33.1 °C | 20.7 °C | 36.9 °C | 26.9 °C | 17.2 °C | 32.0 °C | 21.5 °C | 10.2 °C | 57.4 mm | 0.2 mm | — | — |
| May | 47.0 °C | 37.4 °C | 27.2 °C | 38.3 °C | 30.8 °C | 22.2 °C | 34.0 °C | 25.1 °C | 15.0 °C | 21.5 mm | 0.0 mm | — | — |
| June | 49.0 °C | 39.6 °C | 30.6 °C | 40.0 °C | 33.1 °C | 26.5 °C | 35.0 °C | 27.6 °C | 18.2 °C | 11.0 mm | 0.0 mm | — | — |
| July | 49.0 °C | 41.1 °C | 31.1 °C | 41.9 °C | 35.1 °C | 28.1 °C | 38.0 °C | 30.4 °C | 20.2 °C | 4.6 mm | 0.0 mm | — | — |
| August | 49.0 °C | 41.3 °C | 34.4 °C | 41.7 °C | 35.2 °C | 28.8 °C | 38.0 °C | 30.7 °C | 21.7 °C | 8.1 mm | 0.0 mm | — | — |
| September | 46.1 °C | 39.1 °C | 33.3 °C | 39.1 °C | 32.9 °C | 26.2 °C | 35.5 °C | 28.0 °C | 16.5 °C | 2.0 mm | 0.0 mm | — | — |
| October | 43.0 °C | 35.5 °C | 30.0 °C | 35.3 °C | 29.7 °C | 19.5 °C | 32.0 °C | 24.5 °C | 13.7 °C | 14.6 mm | 0.0 mm | — | — |
| November | 38.1 °C | 30.7 °C | 22.4 °C | 31.7 °C | 25.3 °C | 17.4 °C | 28.0 °C | 20.5 °C | 11.0 °C | 17.8 mm | 0.1 mm | — | — |
| December | 35.5 °C | 26.3 °C | 17.8 °C | 27.5 °C | 21.3 °C | 14.0 °C | 25.0 °C | 16.8 °C | 7.2 °C | 54.8 mm | 0.4 mm | — | — |
Data Visualisations
Remove WatermarksCurrent Year Climate Trends vs Historical


Max Temperature this Year | 1 of 6
Climate 12-Month Moving Averages


Max Temperature 12-Month MA | 1 of 6
Daily Data Points and Averages Throughout the Year


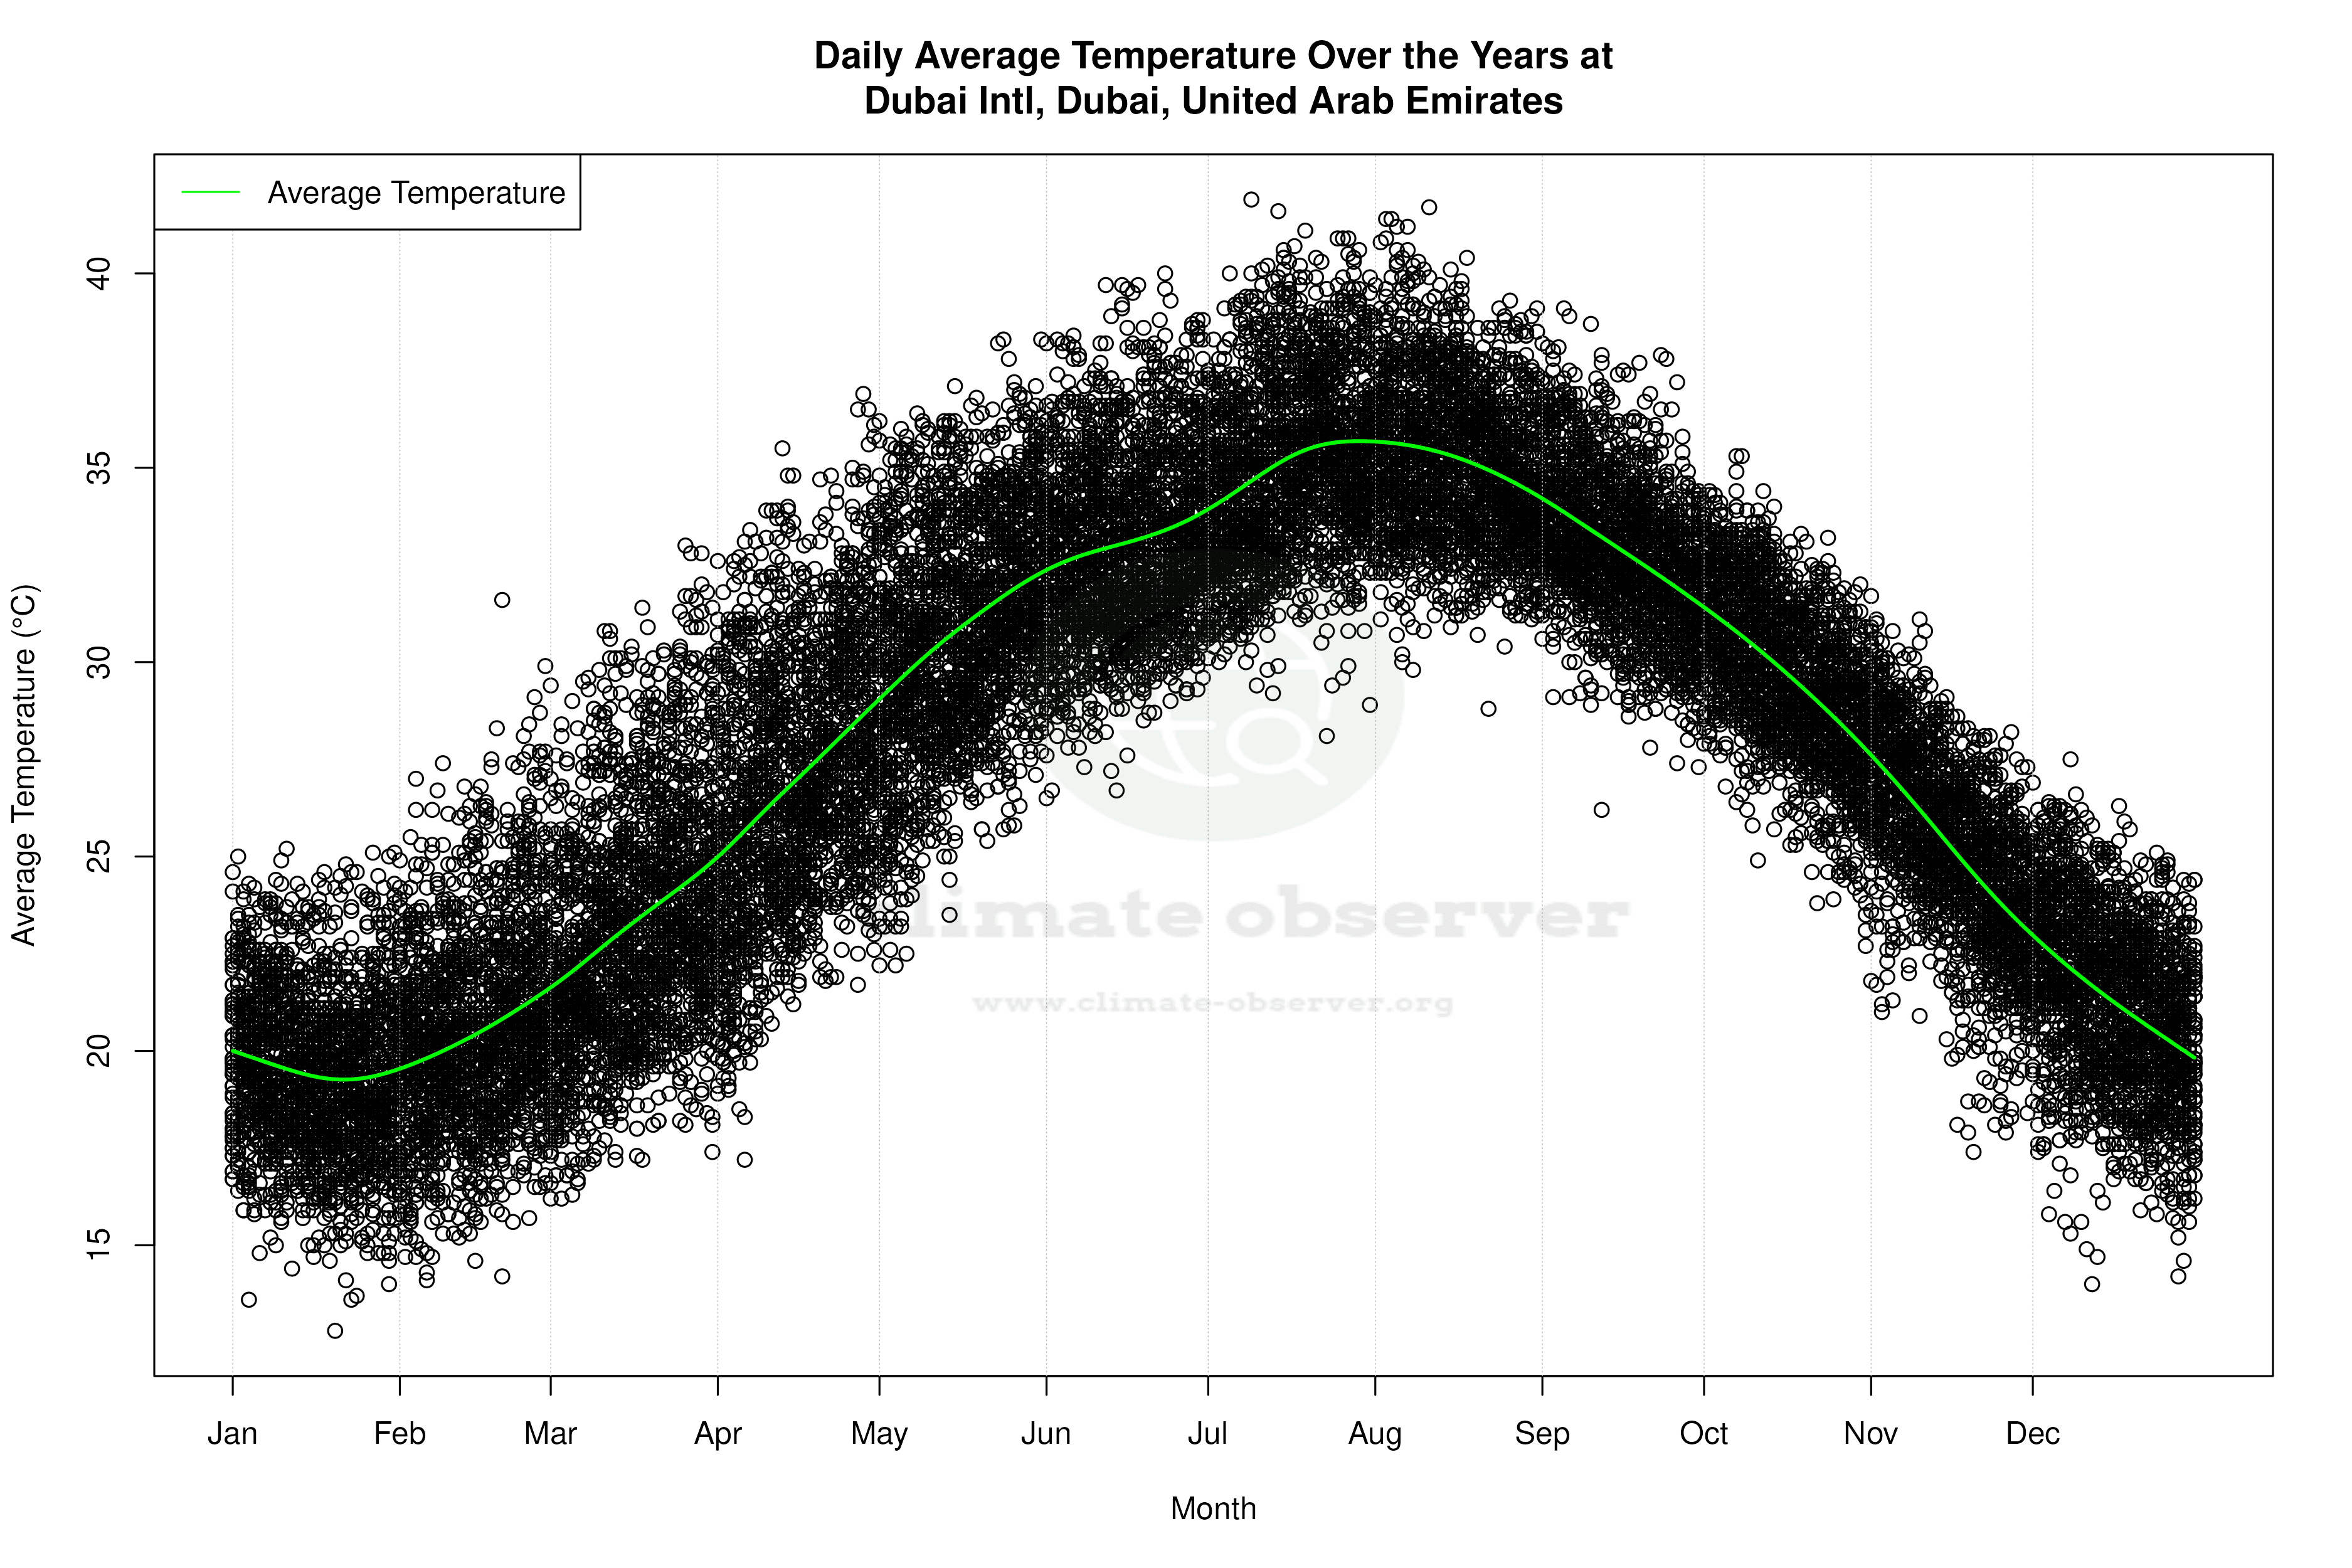


Average Max Temperature Throughout Year | 1 of 5
