Climate for Station: Alger-Dar El Beida, Algiers, Algeria
Loading live weather...
Climate Analysis & Overview
The climate profile of Alger-Dar El Beida reveals a complex interplay of warming trends and precipitation shifts. While all-time temperature trends indicate a modest warming, recent decades show a more pronounced increase, particularly in nighttime lows. Meanwhile, the precipitation pattern has become slightly more evenly distributed.
Mediterranean Climate Dynamics
Alger-Dar El Beida, located at 36.7167°N, 3.25°E, experiences a Mediterranean climate, characterised by hot, dry summers and mild, wet winters. This climate type is influenced by its proximity to the Mediterranean Sea, which moderates temperatures and contributes to seasonal precipitation. The Köppen classification for this region is Csa, indicating hot, dry summers. The geographical setting, including coastal influences, plays a crucial role in shaping the local climate patterns.
Temperature Trends: A Decadal Perspective
In the past decade, Alger-Dar El Beida has seen a notable rise in temperatures. Highs have increased by 1.12°C (2.02°F), while lows have risen by 2.05°C (3.70°F). This trend suggests a significant warming of nighttime temperatures, which can impact local ecosystems and energy consumption patterns. In contrast, the all-time trends show a more modest increase, with highs rising by 0.21°C (0.38°F) and lows by 0.11°C (0.20°F). This discrepancy highlights the acceleration of warming in recent years, which is consistent with broader regional climate trends observed across Algeria.
Precipitation Patterns: A Subtle Shift
The Precipitation Concentration Index (PCI) has seen a slight decrease from a baseline of 15.62 to a current value of 14.83. This indicates a marginal shift towards more evenly distributed precipitation events throughout the year. While the PCI remains above 10, suggesting some concentration of rainfall, the decrease implies a trend towards less extreme precipitation events. This could potentially mitigate the risks of flooding and improve water resource management in the region.
Extremes and Records
The region's temperature extremes are marked by a record high of 46.0°C (114.8°F) and a record low of -3.3°C (26.1°F). These extremes underscore the variability inherent in a Mediterranean climate, where summer heatwaves can be intense, and winter cold snaps, though less frequent, can occur. Such extremes are critical considerations for infrastructure planning and public health strategies.
Regional Climate Initiatives
Algeria has been actively pursuing climate adaptation and mitigation strategies, focusing on renewable energy and sustainable water management. The warming trends observed in Alger-Dar El Beida align with national efforts to address climate change impacts, including the promotion of solar energy to reduce reliance on fossil fuels. As the region continues to experience these climatic shifts, the integration of climate data into policy and planning remains essential for building resilience against future challenges.
Station Statistics
10-Year Trend
High: +1.20 °C/decade
Low: +2.24 °C/decade
Rain: -0.37 mm/decade
25-Year Trend
High: +0.39 °C/decade
Low: +0.72 °C/decade
Rain: -0.04 mm/decade
50-Year Trend
High: +0.40 °C/decade
Low: +0.30 °C/decade
Rain: -0.03 mm/decade
All-Time Trend
High: +0.21 °C/decade
Low: +0.12 °C/decade
Rain: -0.06 mm/decade
Percentage Above-Average Days
Last 12 Months: 54.5%
This Year: 63.9%
Precipitation Concentration Index (PCI) ℹ️
Last 12 Months: 15.2
Historical Average: 16.5
Percentile Rank of Last 12 Months ℹ️
High: 96th percentile
Low: 99th percentile
Rain: 50th percentile
Change in Variance ℹ️
High: +5.4%
Low: +14.4%
Intraday: -3.2%
Data Coverage
92.5%
First Year of Data
1940
Station Location
Historical Weather Records
| Max High | Avg High | Min High | Max Avg | Avg Avg | Min Avg | Max Low | Avg Low | Min Low | Max Precipitation | Avg Precipitation | Max Snow | Avg Snow | |
|---|---|---|---|---|---|---|---|---|---|---|---|---|---|
| Record | 46.0 °C | — | 3.0 °C | 36.3 °C | — | 0.7 °C | 30.6 °C | — | -3.3 °C | 136.6 mm | — | — | — |
| January | 27.4 °C | 16.5 °C | 3.0 °C | 21.0 °C | 10.7 °C | 0.7 °C | 18.1 °C | 5.8 °C | -3.3 °C | 61.0 mm | 3.0 mm | — | — |
| February | 31.3 °C | 17.3 °C | 4.1 °C | 23.8 °C | 11.5 °C | 1.4 °C | 21.3 °C | 6.0 °C | -1.9 °C | 76.7 mm | 2.7 mm | — | — |
| March | 36.3 °C | 19.2 °C | 5.7 °C | 24.9 °C | 13.2 °C | 3.2 °C | 22.0 °C | 7.5 °C | -1.0 °C | 86.7 mm | 2.2 mm | — | — |
| April | 36.5 °C | 21.1 °C | 11.7 °C | 27.7 °C | 15.3 °C | 7.7 °C | 26.2 °C | 9.4 °C | -0.8 °C | 93.3 mm | 2.1 mm | — | — |
| May | 40.8 °C | 24.3 °C | 13.2 °C | 30.8 °C | 18.6 °C | 11.2 °C | 25.4 °C | 12.4 °C | 2.6 °C | 62.1 mm | 1.3 mm | — | — |
| June | 44.0 °C | 28.1 °C | 17.0 °C | 32.3 °C | 22.4 °C | 15.3 °C | 26.0 °C | 16.1 °C | 5.5 °C | 48.6 mm | 0.5 mm | — | — |
| July | 46.0 °C | 31.2 °C | 22.4 °C | 36.3 °C | 25.4 °C | 19.4 °C | 30.6 °C | 18.9 °C | 9.0 °C | 20.9 mm | 0.1 mm | — | — |
| August | 45.6 °C | 32.0 °C | 24.0 °C | 34.9 °C | 25.9 °C | 19.1 °C | 30.3 °C | 19.7 °C | 9.5 °C | 34.0 mm | 0.2 mm | — | — |
| September | 43.2 °C | 29.5 °C | 18.0 °C | 35.3 °C | 23.5 °C | 14.7 °C | 30.0 °C | 17.7 °C | 8.2 °C | 124.3 mm | 1.0 mm | — | — |
| October | 39.4 °C | 25.7 °C | 11.4 °C | 30.6 °C | 19.6 °C | 10.3 °C | 27.4 °C | 14.0 °C | 4.1 °C | 104.4 mm | 2.2 mm | — | — |
| November | 34.4 °C | 20.8 °C | 8.5 °C | 27.3 °C | 14.9 °C | 5.8 °C | 24.0 °C | 9.9 °C | -0.1 °C | 136.6 mm | 3.5 mm | — | — |
| December | 30.4 °C | 17.5 °C | 5.7 °C | 24.4 °C | 11.9 °C | 5.0 °C | 20.0 °C | 7.1 °C | -2.3 °C | 83.0 mm | 3.3 mm | — | — |
Data Visualisations
Remove WatermarksCurrent Year Climate Trends vs Historical

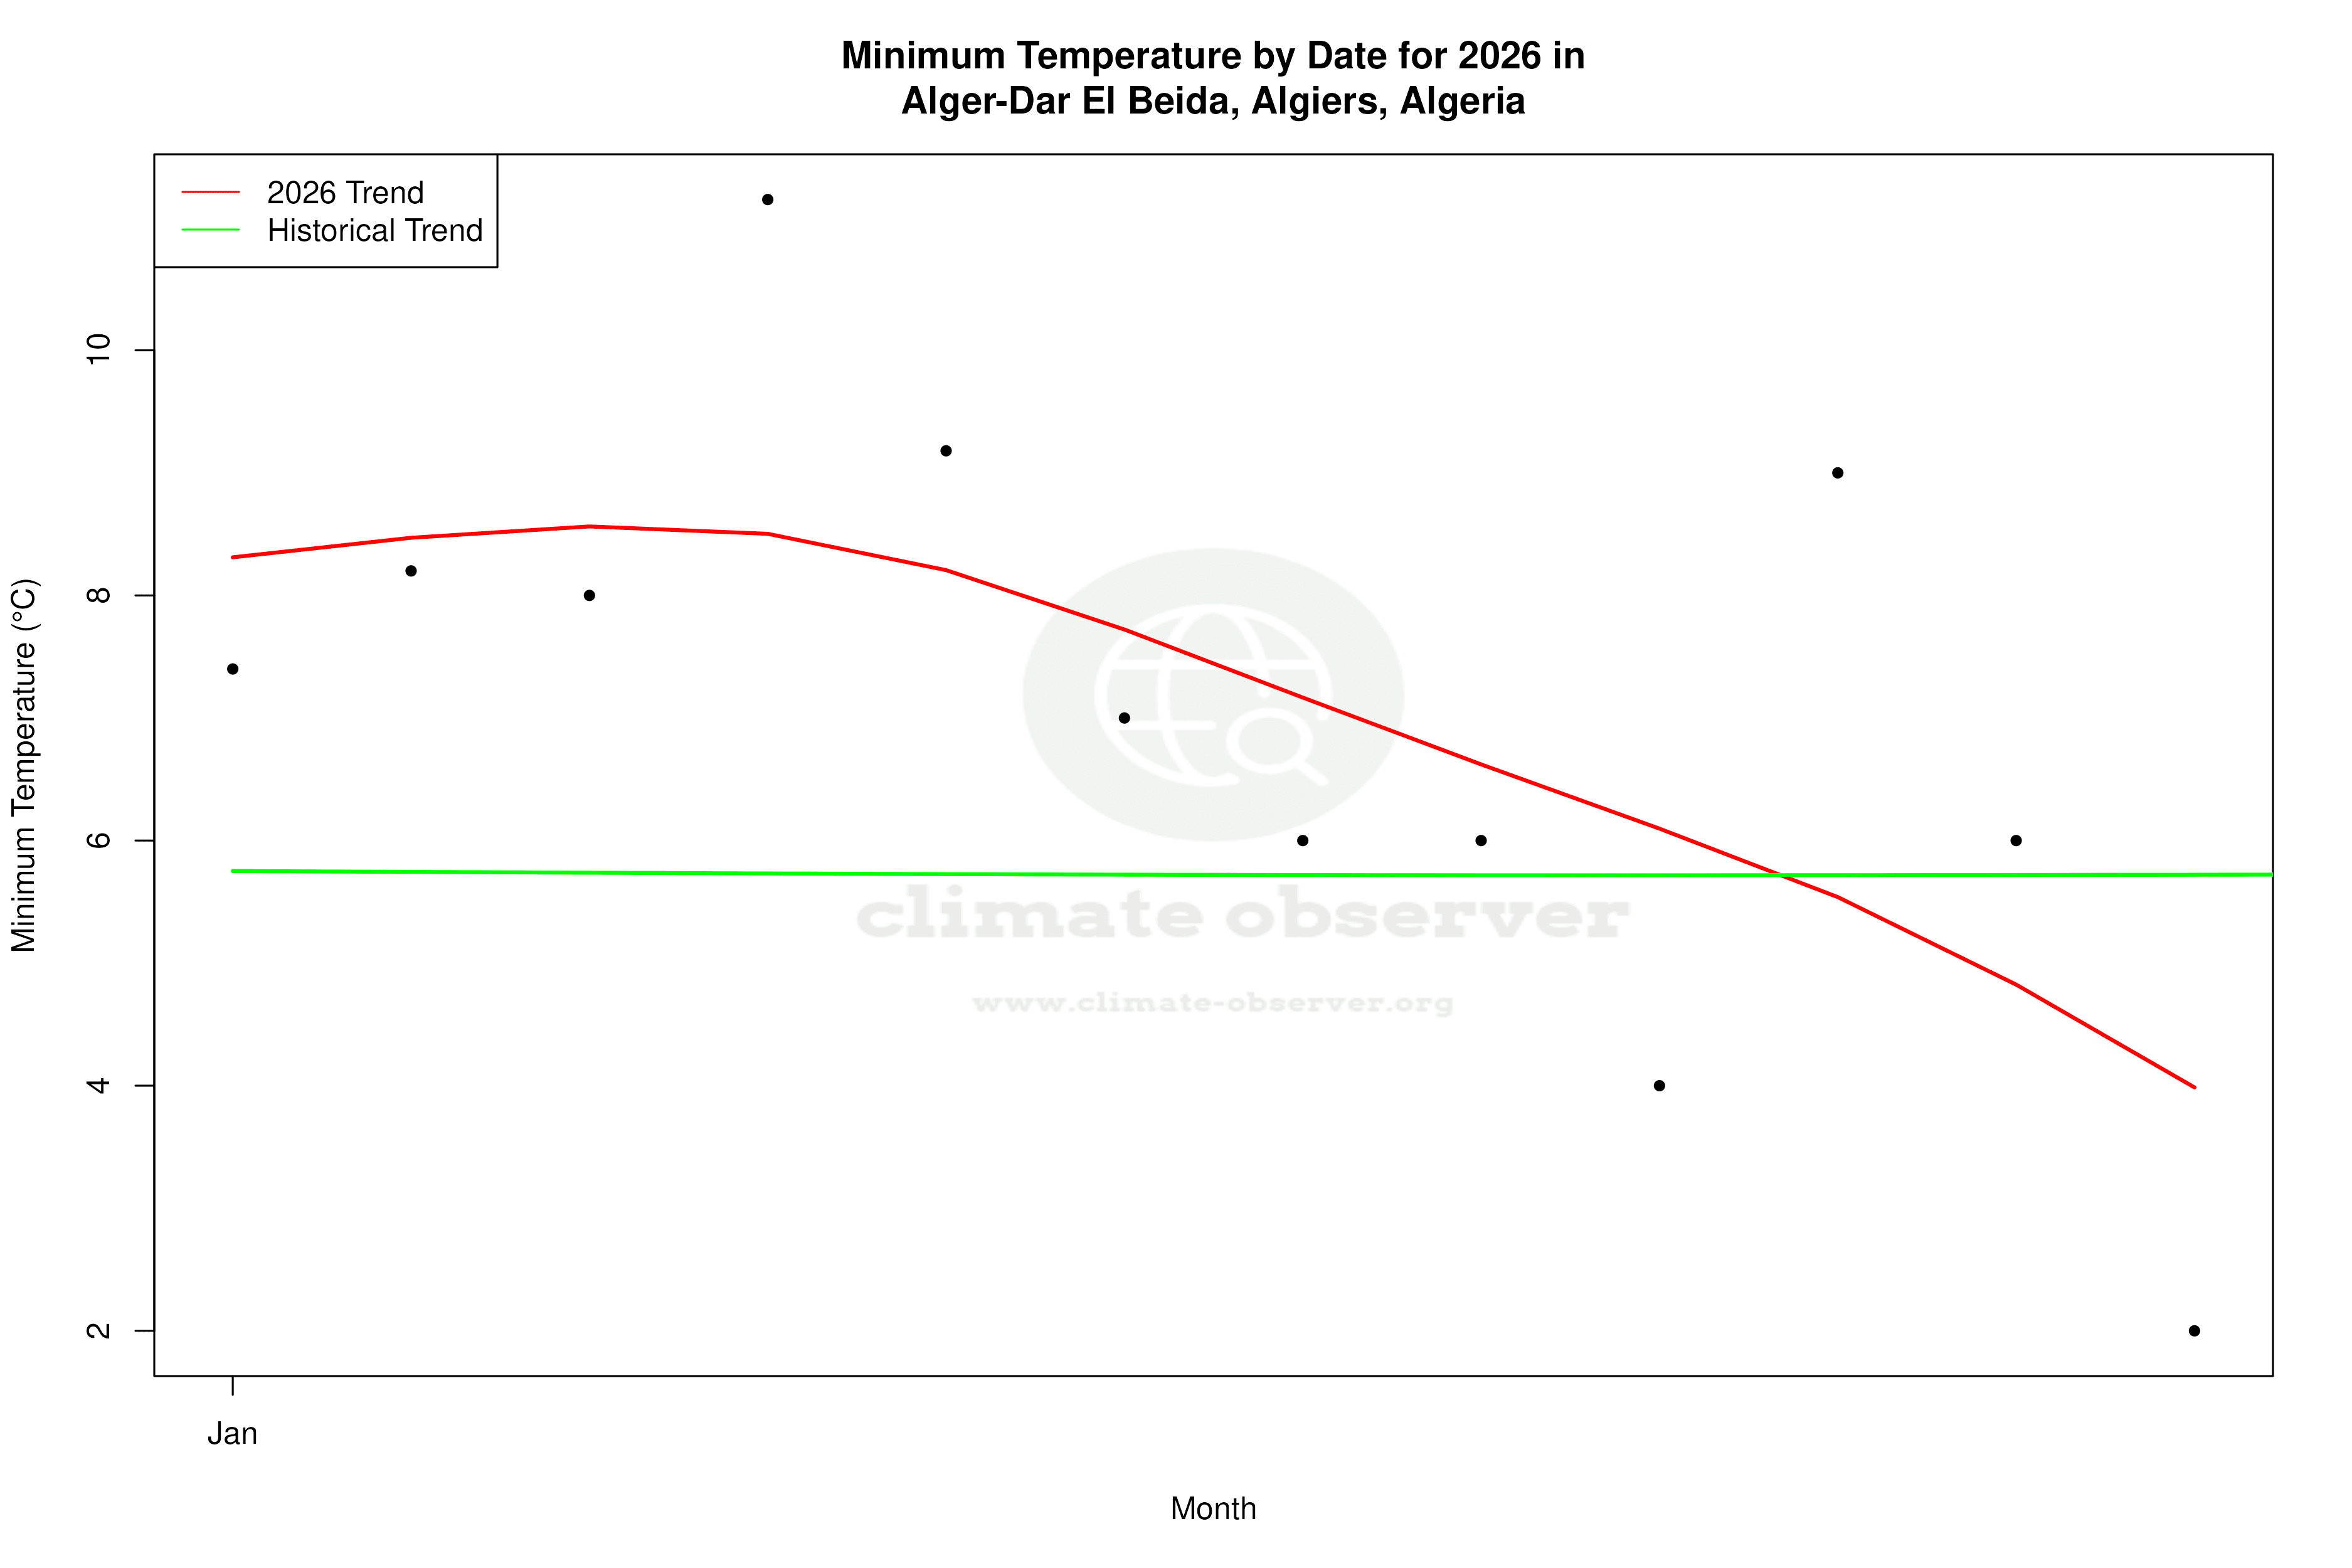


Max Temperature this Year | 1 of 6
Climate 12-Month Moving Averages

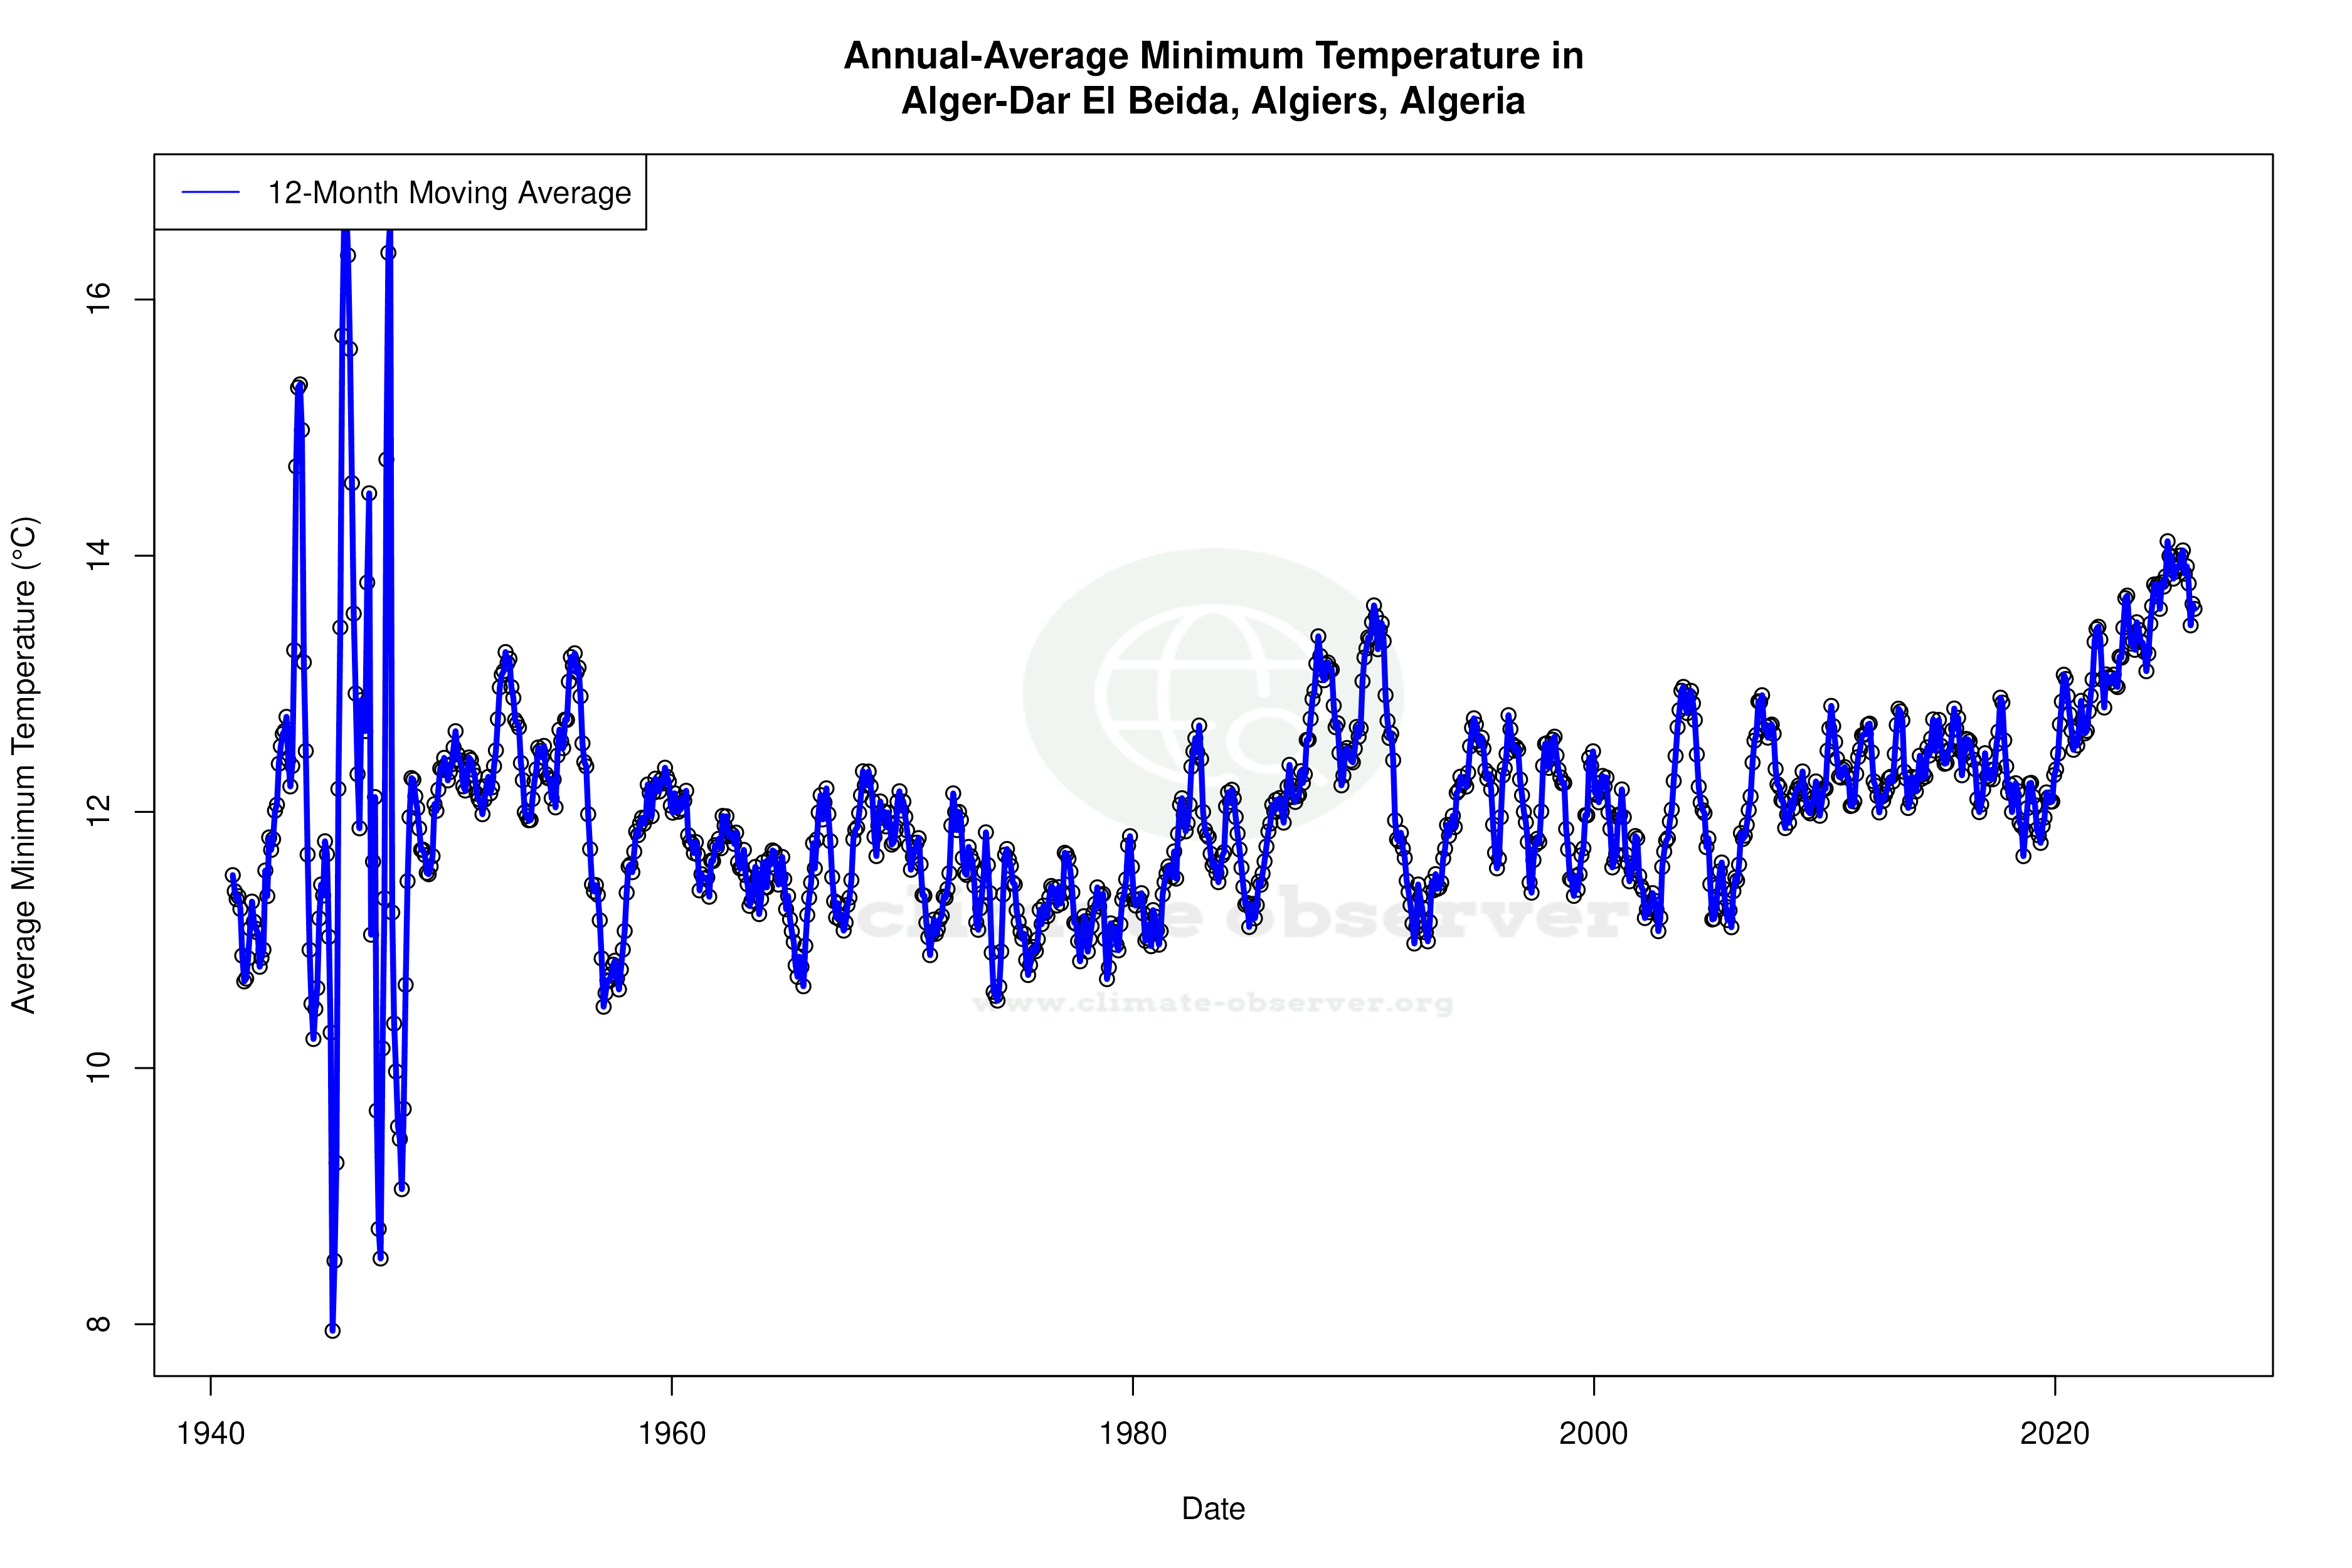


Max Temperature 12-Month MA | 1 of 6
Daily Data Points and Averages Throughout the Year


Average Max Temperature Throughout Year | 1 of 5
