Climate for Station: Tizi Ouzou, Algeria
Loading live weather...
Climate Analysis & Overview
Tizi Ouzou is experiencing a notable warming trend, with recent data indicating a significant rise in both high and low temperatures over the past decade. The region's precipitation patterns have become more evenly distributed, suggesting a shift in local climate dynamics.
Warming Trends in Tizi Ouzou
Tizi Ouzou, located in the mountainous region of northern Algeria, is classified under the Mediterranean climate (Csa) according to the Köppen system. This classification typically involves hot, dry summers and mild, wet winters. Over the past decade, Tizi Ouzou has witnessed a pronounced warming trend, with high temperatures increasing by 2.62°C (4.72°F) and low temperatures by 1.62°C (2.92°F). These figures highlight a significant deviation from the all-time trends, which show a more modest rise of 0.02°C (0.04°F) for highs and 0.14°C (0.25°F) for lows. This accelerated warming over the past ten years may be influenced by regional climate variability and global climate change dynamics.
Temperature Extremes and Records
The temperature records for Tizi Ouzou reveal the potential for extreme weather events. The highest recorded temperature stands at 48.0°C (118.4°F), while the lowest is -6.0°C (21.2°F). These extremes underscore the variability inherent in the region's climate, likely exacerbated by its mountainous terrain, which can lead to rapid changes in weather conditions.
Shifts in Precipitation Patterns
The Precipitation Concentration Index (PCI) for Tizi Ouzou has shown a decrease from a baseline of 15.64 to a current value of 13.32. This indicates that precipitation is now more evenly distributed throughout the year, as opposed to being concentrated in fewer, more intense events. This shift towards a more even distribution of rainfall could have implications for water resource management and agricultural planning in the region, potentially offering more stability in water availability.
Implications of Climate Change
The warming trends and changes in precipitation patterns in Tizi Ouzou are reflective of broader climate changes observed across Algeria. The country has been actively working towards regional climate goals, including adaptation strategies to mitigate the impacts of climate change on agriculture and water resources. Recent weather events, such as heatwaves and altered rainfall patterns, further highlight the need for ongoing monitoring and adaptation efforts to ensure resilience in the face of a changing climate.
Regional Climate Dynamics
Tizi Ouzou's geographical location, nestled within the Tell Atlas mountains and close to the Mediterranean Sea, plays a crucial role in its climatic conditions. The interplay between the mountains and the sea contributes to the region's unique microclimate, which is now undergoing noticeable shifts. As the climate continues to evolve, understanding these regional dynamics becomes increasingly important for developing effective climate adaptation strategies.
Station Statistics
10-Year Trend
High: +2.69 °C/decade
Low: +1.30 °C/decade
Rain: -0.42 mm/decade
25-Year Trend
High: +0.31 °C/decade
Low: +0.67 °C/decade
Rain: -0.12 mm/decade
50-Year Trend
High: +0.57 °C/decade
Low: +0.86 °C/decade
Rain: +0.09 mm/decade
All-Time Trend
High: +0.02 °C/decade
Low: +0.14 °C/decade
Rain: -0.04 mm/decade
Percentage Above-Average Days
Last 12 Months: 49.9%
This Year: 56.7%
Precipitation Concentration Index (PCI) ℹ️
Last 12 Months: 14.9
Historical Average: 15.7
Percentile Rank of Last 12 Months ℹ️
High: 94th percentile
Low: 92nd percentile
Rain: 27th percentile
Change in Variance ℹ️
High: +6.0%
Low: -0.1%
Intraday: -1.9%
Data Coverage
54.0%
First Year of Data
1879
Station Location
Historical Weather Records
| Max High | Avg High | Min High | Max Avg | Avg Avg | Min Avg | Max Low | Avg Low | Min Low | Max Precipitation | Avg Precipitation | Max Snow | Avg Snow | |
|---|---|---|---|---|---|---|---|---|---|---|---|---|---|
| Record | 48.0 °C | — | 1.6 °C | 41.2 °C | — | -0.9 °C | 31.0 °C | — | -6.0 °C | 130.0 mm | — | — | — |
| January | 26.6 °C | 14.5 °C | 1.6 °C | 19.1 °C | 9.5 °C | -0.9 °C | 16.0 °C | 5.1 °C | -4.2 °C | 70.0 mm | 3.9 mm | — | — |
| February | 30.0 °C | 15.8 °C | 2.0 °C | 23.4 °C | 10.4 °C | 0.5 °C | 19.0 °C | 5.5 °C | -6.0 °C | 78.4 mm | 3.2 mm | — | — |
| March | 33.0 °C | 18.4 °C | 3.0 °C | 24.0 °C | 12.7 °C | 1.4 °C | 20.0 °C | 7.4 °C | -2.0 °C | 68.0 mm | 2.7 mm | — | — |
| April | 37.8 °C | 21.3 °C | 9.0 °C | 30.5 °C | 15.3 °C | 7.0 °C | 23.0 °C | 9.4 °C | 0.6 °C | 86.0 mm | 2.2 mm | — | — |
| May | 41.0 °C | 25.5 °C | 10.0 °C | 31.3 °C | 19.4 °C | 8.6 °C | 25.0 °C | 12.6 °C | 1.0 °C | 118.0 mm | 1.7 mm | — | — |
| June | 45.0 °C | 31.2 °C | 15.7 °C | 37.5 °C | 24.5 °C | 14.4 °C | 29.7 °C | 16.7 °C | 4.0 °C | 29.1 mm | 0.5 mm | — | — |
| July | 48.0 °C | 35.7 °C | 22.0 °C | 41.2 °C | 28.3 °C | 19.0 °C | 30.0 °C | 19.9 °C | 8.0 °C | 34.0 mm | 0.1 mm | — | — |
| August | 47.4 °C | 36.0 °C | 19.0 °C | 39.2 °C | 28.3 °C | 20.1 °C | 31.0 °C | 20.5 °C | 10.0 °C | 28.0 mm | 0.2 mm | — | — |
| September | 44.0 °C | 31.4 °C | 14.0 °C | 36.2 °C | 24.2 °C | 14.5 °C | 29.0 °C | 17.8 °C | 9.0 °C | 62.0 mm | 1.2 mm | — | — |
| October | 40.5 °C | 26.1 °C | 10.0 °C | 31.8 °C | 19.8 °C | 10.7 °C | 28.0 °C | 13.9 °C | 1.0 °C | 103.2 mm | 2.0 mm | — | — |
| November | 36.0 °C | 19.8 °C | 5.0 °C | 27.7 °C | 14.3 °C | 3.9 °C | 23.0 °C | 9.6 °C | -0.5 °C | 117.5 mm | 3.4 mm | — | — |
| December | 27.0 °C | 15.4 °C | 3.0 °C | 22.7 °C | 10.8 °C | 2.9 °C | 20.0 °C | 6.4 °C | -4.0 °C | 130.0 mm | 3.9 mm | — | — |
Data Visualisations
Remove WatermarksCurrent Year Climate Trends vs Historical
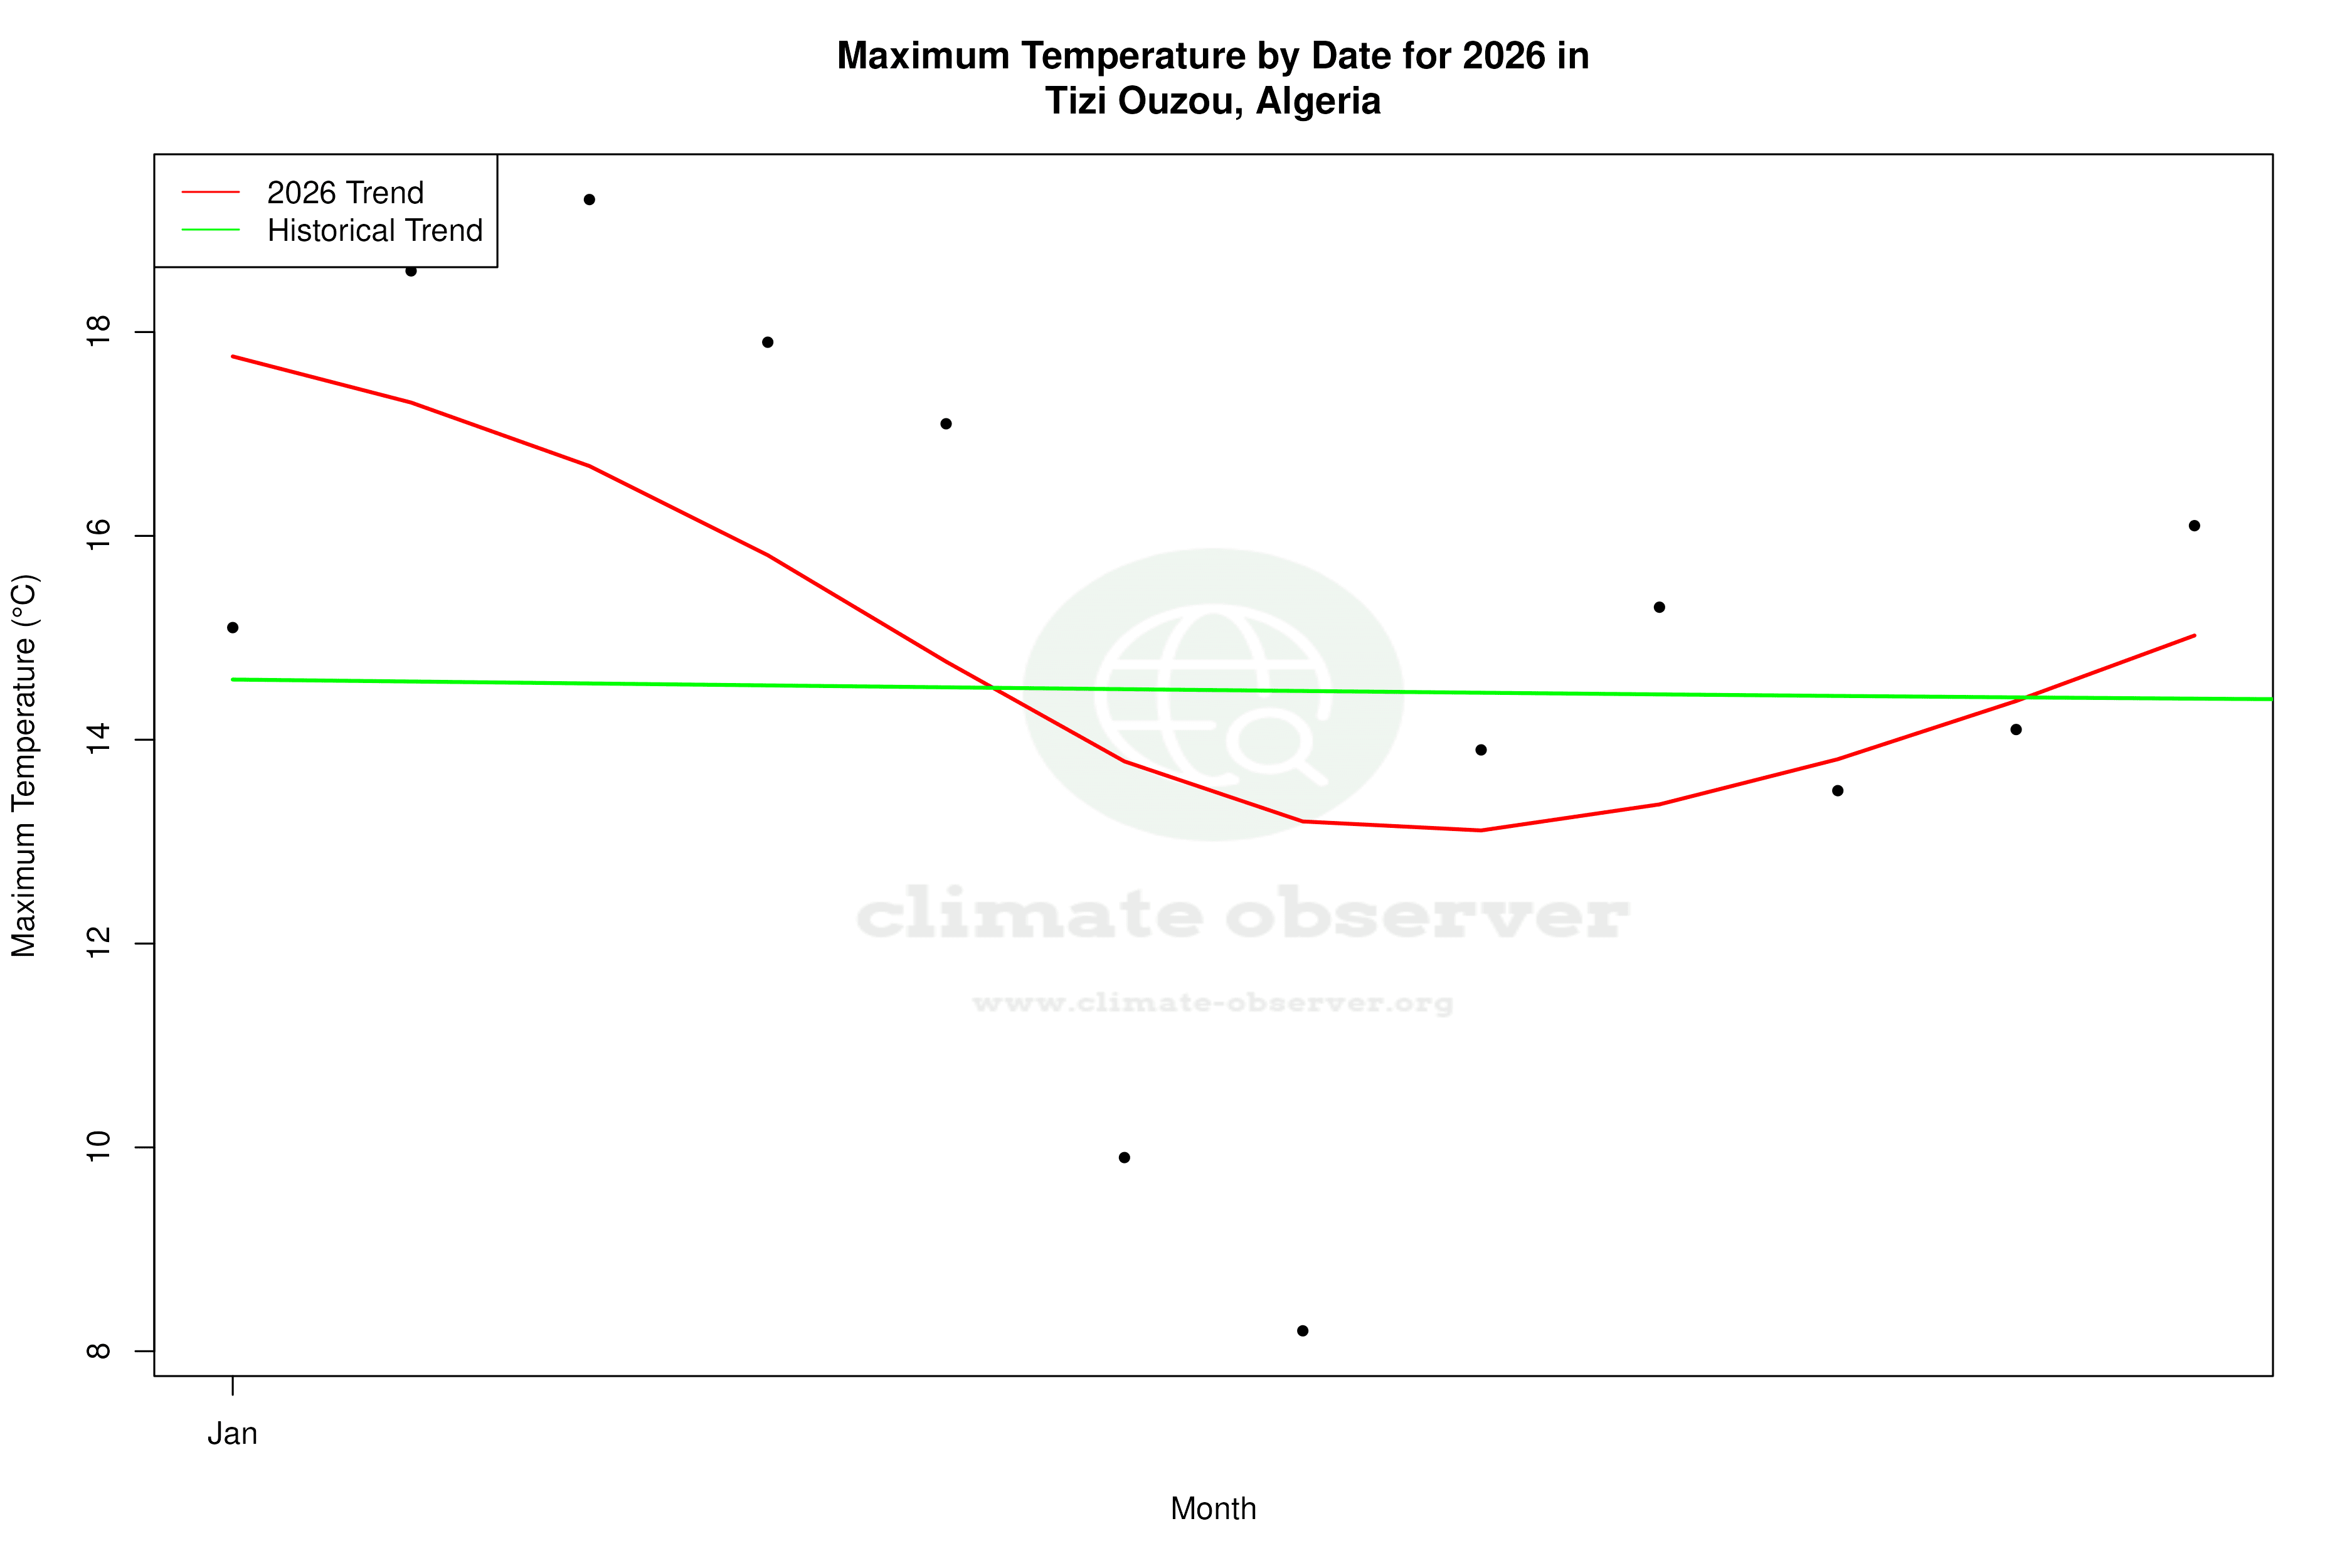


Max Temperature this Year | 1 of 6
Climate 12-Month Moving Averages


Max Temperature 12-Month MA | 1 of 6
Daily Data Points and Averages Throughout the Year


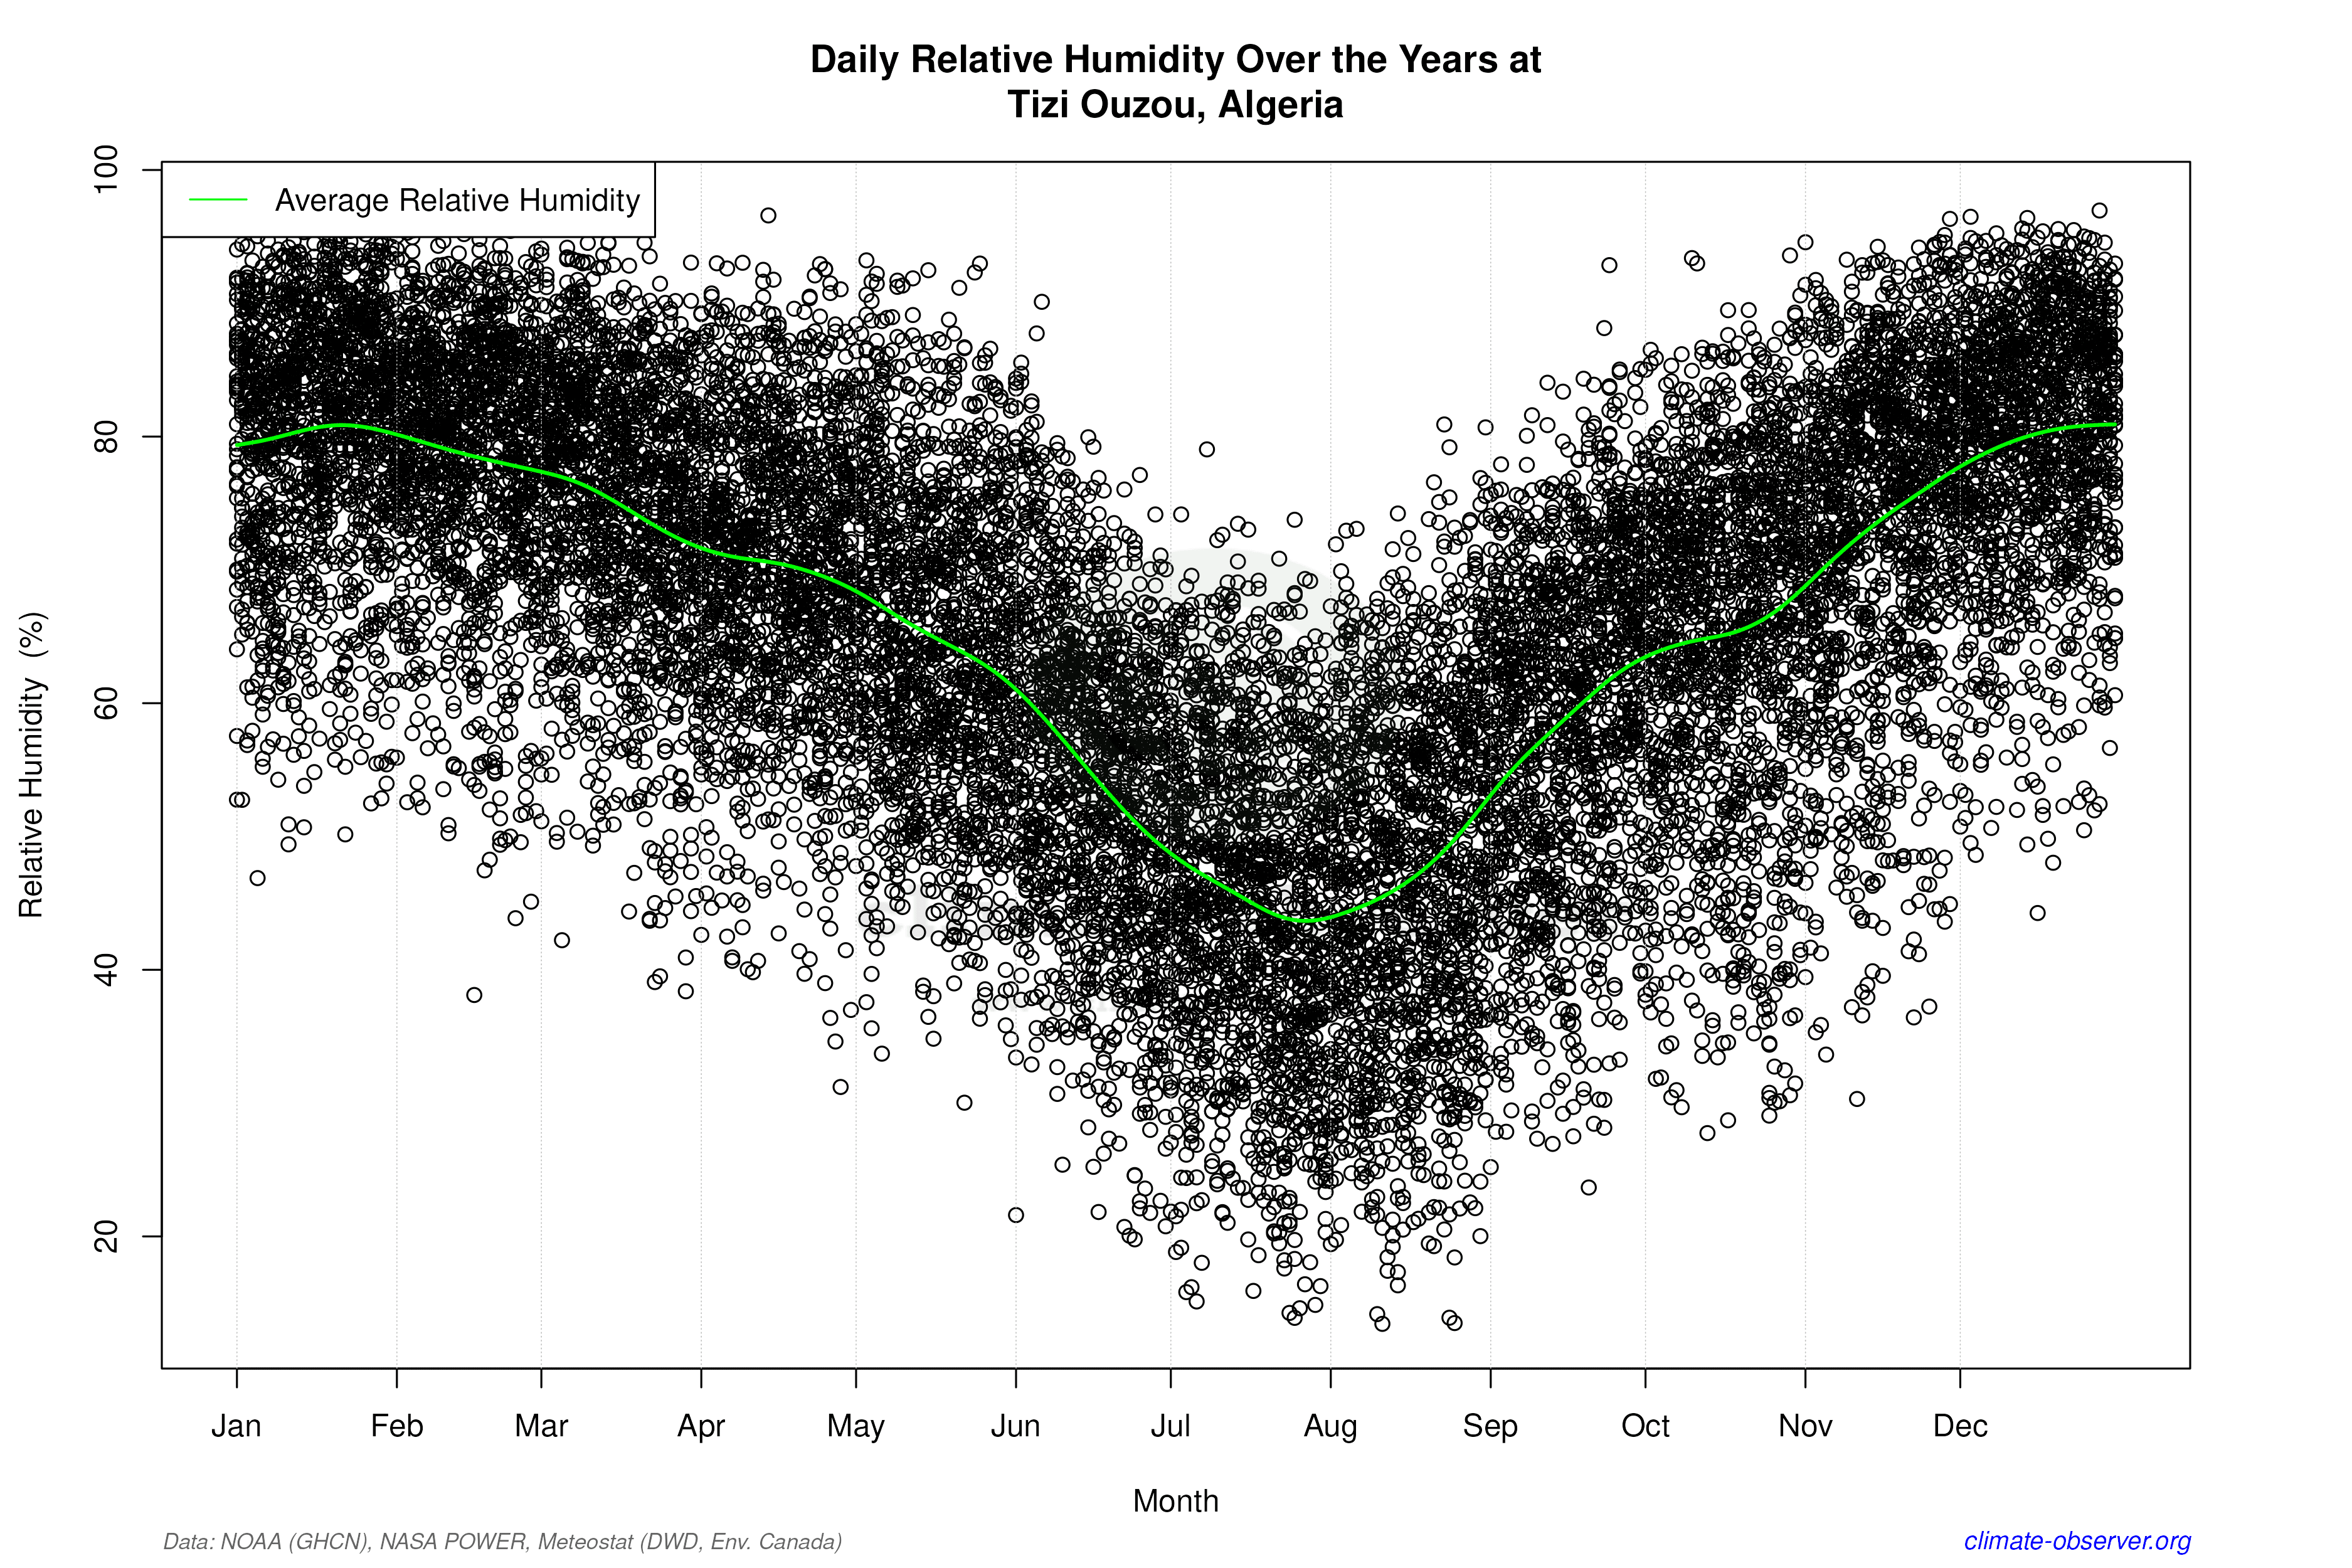

Average Max Temperature Throughout Year | 1 of 5
