Climate for Station: Nemours (Ghazaouet), Tlemcen, Algeria
Loading live weather...
Climate Analysis & Overview
Nemours, located in the coastal region of Ghazaouet, Algeria, is experiencing a warming trend, particularly in nighttime temperatures, with a notable decrease in precipitation concentration. This shift suggests a more evenly distributed rainfall pattern, potentially impacting local agriculture and water management strategies.
Coastal Climate Dynamics
Nemours, situated at the coordinates 35.1, -1.85, falls under the Mediterranean climate classification (Csa) according to the Köppen system. This classification is characterised by hot, dry summers and mild, wet winters. The proximity to the Mediterranean Sea influences its climate, moderating temperatures and contributing to the seasonal precipitation patterns. The region's geography, with its coastal plains and nearby mountains, plays a crucial role in shaping local weather conditions.
Warming Trends in Nemours
Over the last decade, Nemours has experienced a noticeable increase in temperatures, particularly in the lows. The 10-year trend shows a rise in high temperatures of 0.38°C (0.68°F) and a more significant increase in low temperatures of 1.21°C (2.18°F). When considering the all-time trends, the increase is more modest, with highs rising by 0.10°C (0.18°F) and lows by 0.17°C (0.31°F). This warming trend, especially at night, could have implications for local ecosystems and human comfort, as well as energy consumption patterns.
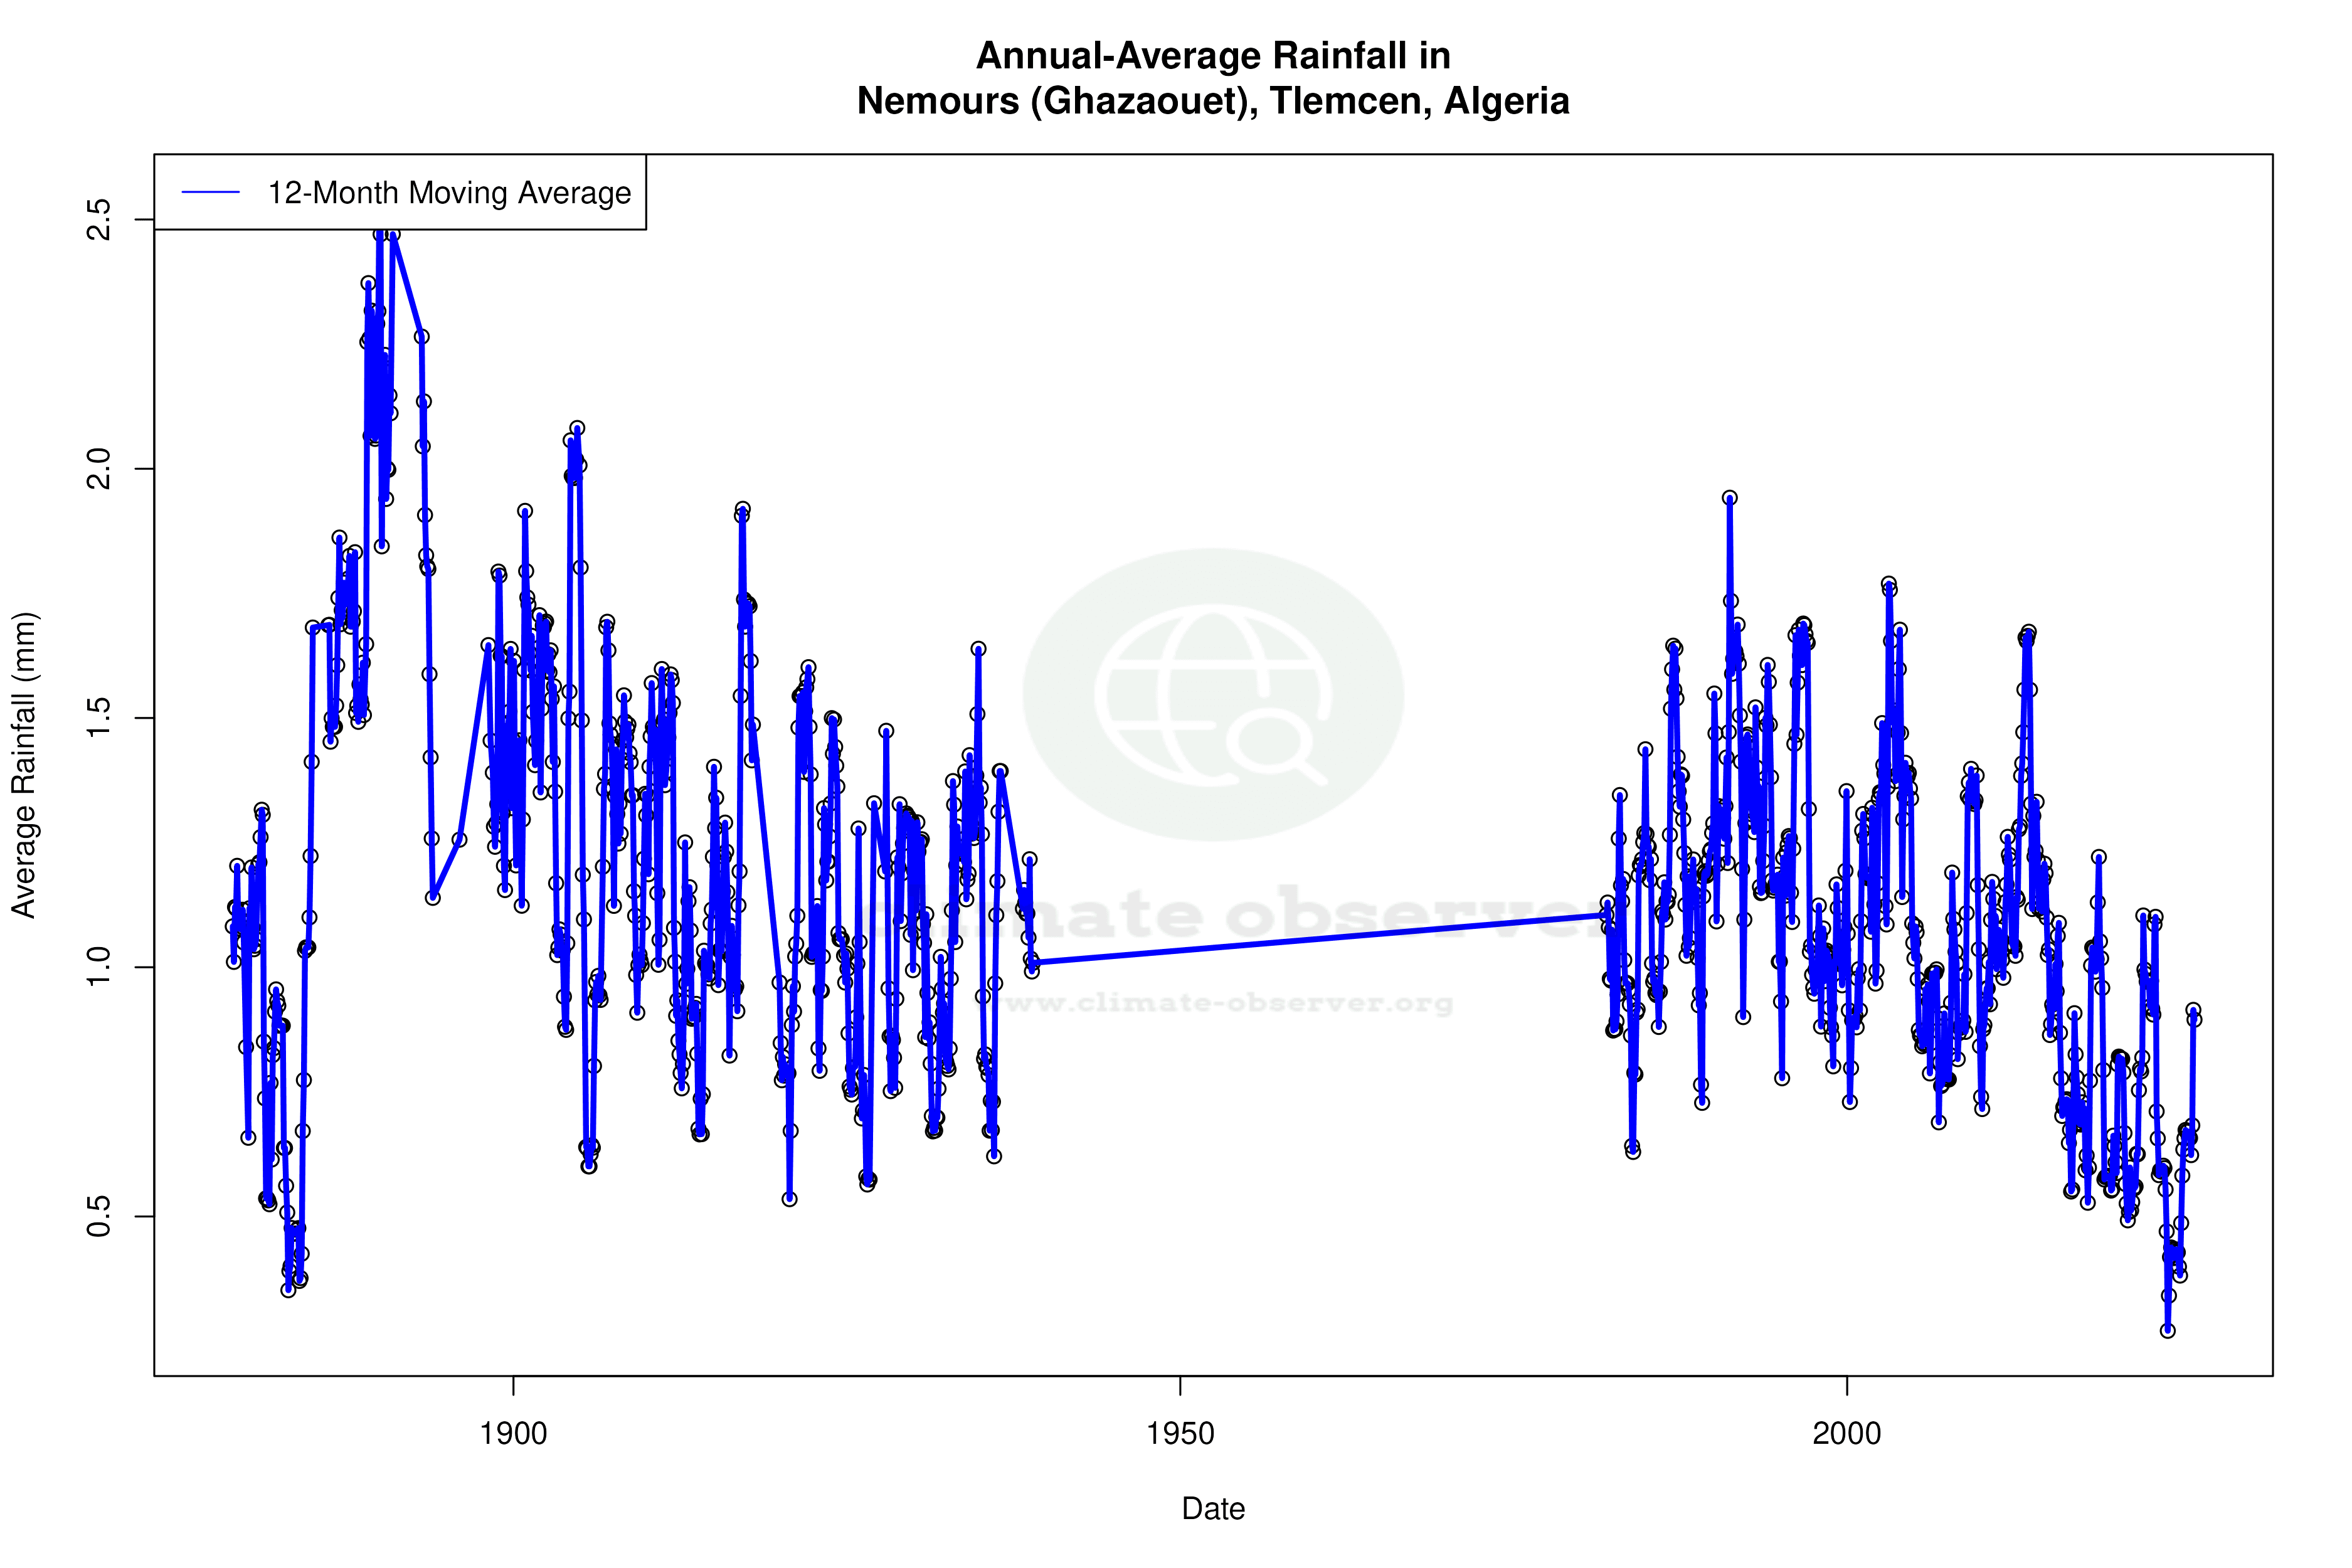
Precipitation Patterns and Implications
The Precipitation Concentration Index (PCI) for Nemours has decreased from a baseline of 15.75 to a current value of 13.52. This indicates a more even distribution of rainfall throughout the year, as opposed to being concentrated in fewer, intense events. Such a change can be beneficial for agriculture, reducing the risk of flooding and soil erosion, while also potentially improving water availability for crops. However, it may also challenge existing water management systems that are designed for more concentrated rainfall events.
Temperature Extremes
Nemours has recorded extreme temperatures, with a maximum of 41.6°C (106.9°F) and a minimum of -5.0°C (23.0°F). These extremes highlight the variability within the Mediterranean climate, where summer heatwaves can be intense, and winter cold snaps, although less frequent, can occur. Understanding these extremes is crucial for preparing local infrastructure and communities for potential impacts.
Regional Climate Goals and Considerations
Algeria has set ambitious climate goals to mitigate and adapt to climate change impacts. The warming trends and altered precipitation patterns in Nemours underscore the importance of these goals. Recent regional initiatives focus on sustainable water management and the development of climate-resilient agricultural practices. As Nemours continues to experience these climatic shifts, such efforts will be essential in ensuring the region's resilience to future climate variability.
Station Statistics
10-Year Trend
High: -0.05 °C/decade
Low: +0.77 °C/decade
Rain: -0.11 mm/decade
25-Year Trend
High: -0.05 °C/decade
Low: +0.88 °C/decade
Rain: -0.28 mm/decade
50-Year Trend
High: -0.16 °C/decade
Low: +1.03 °C/decade
Rain: -0.12 mm/decade
All-Time Trend
High: +0.09 °C/decade
Low: +0.17 °C/decade
Rain: -0.02 mm/decade
Percentage Above-Average Days
Last 12 Months: 51.5%
This Year: 63.2%
Precipitation Concentration Index (PCI) ℹ️
Last 12 Months: 18.8
Historical Average: 18.1
Percentile Rank of Last 12 Months ℹ️
High: 62nd percentile
Low: 94th percentile
Rain: 12th percentile
Change in Variance ℹ️
High: +3.7%
Low: -0.9%
Intraday: -5.0%
Data Coverage
57.4%
First Year of Data
1878
Station Location
Historical Weather Records
| Max High | Avg High | Min High | Max Avg | Avg Avg | Min Avg | Max Low | Avg Low | Min Low | Max Precipitation | Avg Precipitation | Max Snow | Avg Snow | |
|---|---|---|---|---|---|---|---|---|---|---|---|---|---|
| Record | 44.4 °C | — | 3.4 °C | 36.2 °C | — | 0.3 °C | 29.4 °C | — | -5.0 °C | 104.2 mm | — | — | — |
| January | 30.4 °C | 16.3 °C | 3.4 °C | 23.1 °C | 12.1 °C | 0.3 °C | 17.1 °C | 7.2 °C | -3.6 °C | 68.0 mm | 1.9 mm | — | — |
| February | 31.0 °C | 17.3 °C | 6.6 °C | 23.2 °C | 13.1 °C | 4.3 °C | 18.0 °C | 7.9 °C | -3.5 °C | 67.0 mm | 1.7 mm | — | — |
| March | 31.2 °C | 18.7 °C | 7.4 °C | 24.0 °C | 14.9 °C | 4.0 °C | 19.0 °C | 9.3 °C | -2.1 °C | 85.4 mm | 1.7 mm | — | — |
| April | 33.7 °C | 20.4 °C | 10.0 °C | 27.8 °C | 16.6 °C | 9.2 °C | 20.9 °C | 11.1 °C | 0.7 °C | 50.6 mm | 1.4 mm | — | — |
| May | 35.0 °C | 22.7 °C | 12.5 °C | 28.1 °C | 19.4 °C | 11.3 °C | 21.3 °C | 13.7 °C | 3.0 °C | 88.4 mm | 1.1 mm | — | — |
| June | 40.2 °C | 26.1 °C | 17.0 °C | 32.7 °C | 23.0 °C | 15.2 °C | 25.7 °C | 17.1 °C | 6.0 °C | 62.8 mm | 0.4 mm | — | — |
| July | 44.4 °C | 29.1 °C | 20.0 °C | 36.2 °C | 26.2 °C | 19.5 °C | 28.0 °C | 20.1 °C | 10.0 °C | 9.0 mm | 0.1 mm | — | — |
| August | 42.4 °C | 29.8 °C | 18.0 °C | 35.1 °C | 26.7 °C | 20.0 °C | 29.4 °C | 20.8 °C | 9.0 °C | 38.9 mm | 0.2 mm | — | — |
| September | 40.0 °C | 27.4 °C | 18.6 °C | 32.0 °C | 24.1 °C | 15.9 °C | 28.0 °C | 18.5 °C | 9.2 °C | 60.0 mm | 0.7 mm | — | — |
| October | 36.3 °C | 23.9 °C | 14.0 °C | 31.4 °C | 20.4 °C | 11.3 °C | 23.2 °C | 14.9 °C | 3.0 °C | 46.6 mm | 1.3 mm | — | — |
| November | 33.2 °C | 20.0 °C | 10.0 °C | 31.2 °C | 16.3 °C | 6.3 °C | 24.0 °C | 11.2 °C | -3.0 °C | 104.2 mm | 1.8 mm | — | — |
| December | 30.0 °C | 17.3 °C | 6.8 °C | 25.1 °C | 13.4 °C | 2.4 °C | 20.0 °C | 8.4 °C | -5.0 °C | 64.7 mm | 1.8 mm | — | — |
Data Visualisations
Remove WatermarksCurrent Year Climate Trends vs Historical


Max Temperature this Year | 1 of 6
Climate 12-Month Moving Averages


Max Temperature 12-Month MA | 1 of 6
Daily Data Points and Averages Throughout the Year


Average Max Temperature Throughout Year | 1 of 5
