Climate for Station: Luanda, Angola
Loading live weather...
Climate Analysis & Overview
Luanda's climate is characterised by a warming trend over the long term, with a slight cooling in recent years for high temperatures. The precipitation pattern has become more evenly distributed, suggesting a shift in rainfall dynamics. These changes occur against the backdrop of Angola's efforts to adapt to climate variability.
Tropical Climate Dynamics
Luanda, situated on the Atlantic coast of Angola, falls under the Köppen climate classification of Aw, indicating a tropical savanna climate with a distinct wet and dry season. The coastal location moderates temperature extremes, but recent data reveals nuanced shifts. Over the all-time record, high temperatures have experienced a rise of 0.26°C (0.47°F), while low temperatures have increased by 0.19°C (0.34°F). This warming trend aligns with broader regional patterns, reflecting Angola's vulnerability to global climate change. However, the past decade shows a contrasting trend for high temperatures, with a cooling of 0.45°C (0.81°F), suggesting localised climatic influences or short-term variability.
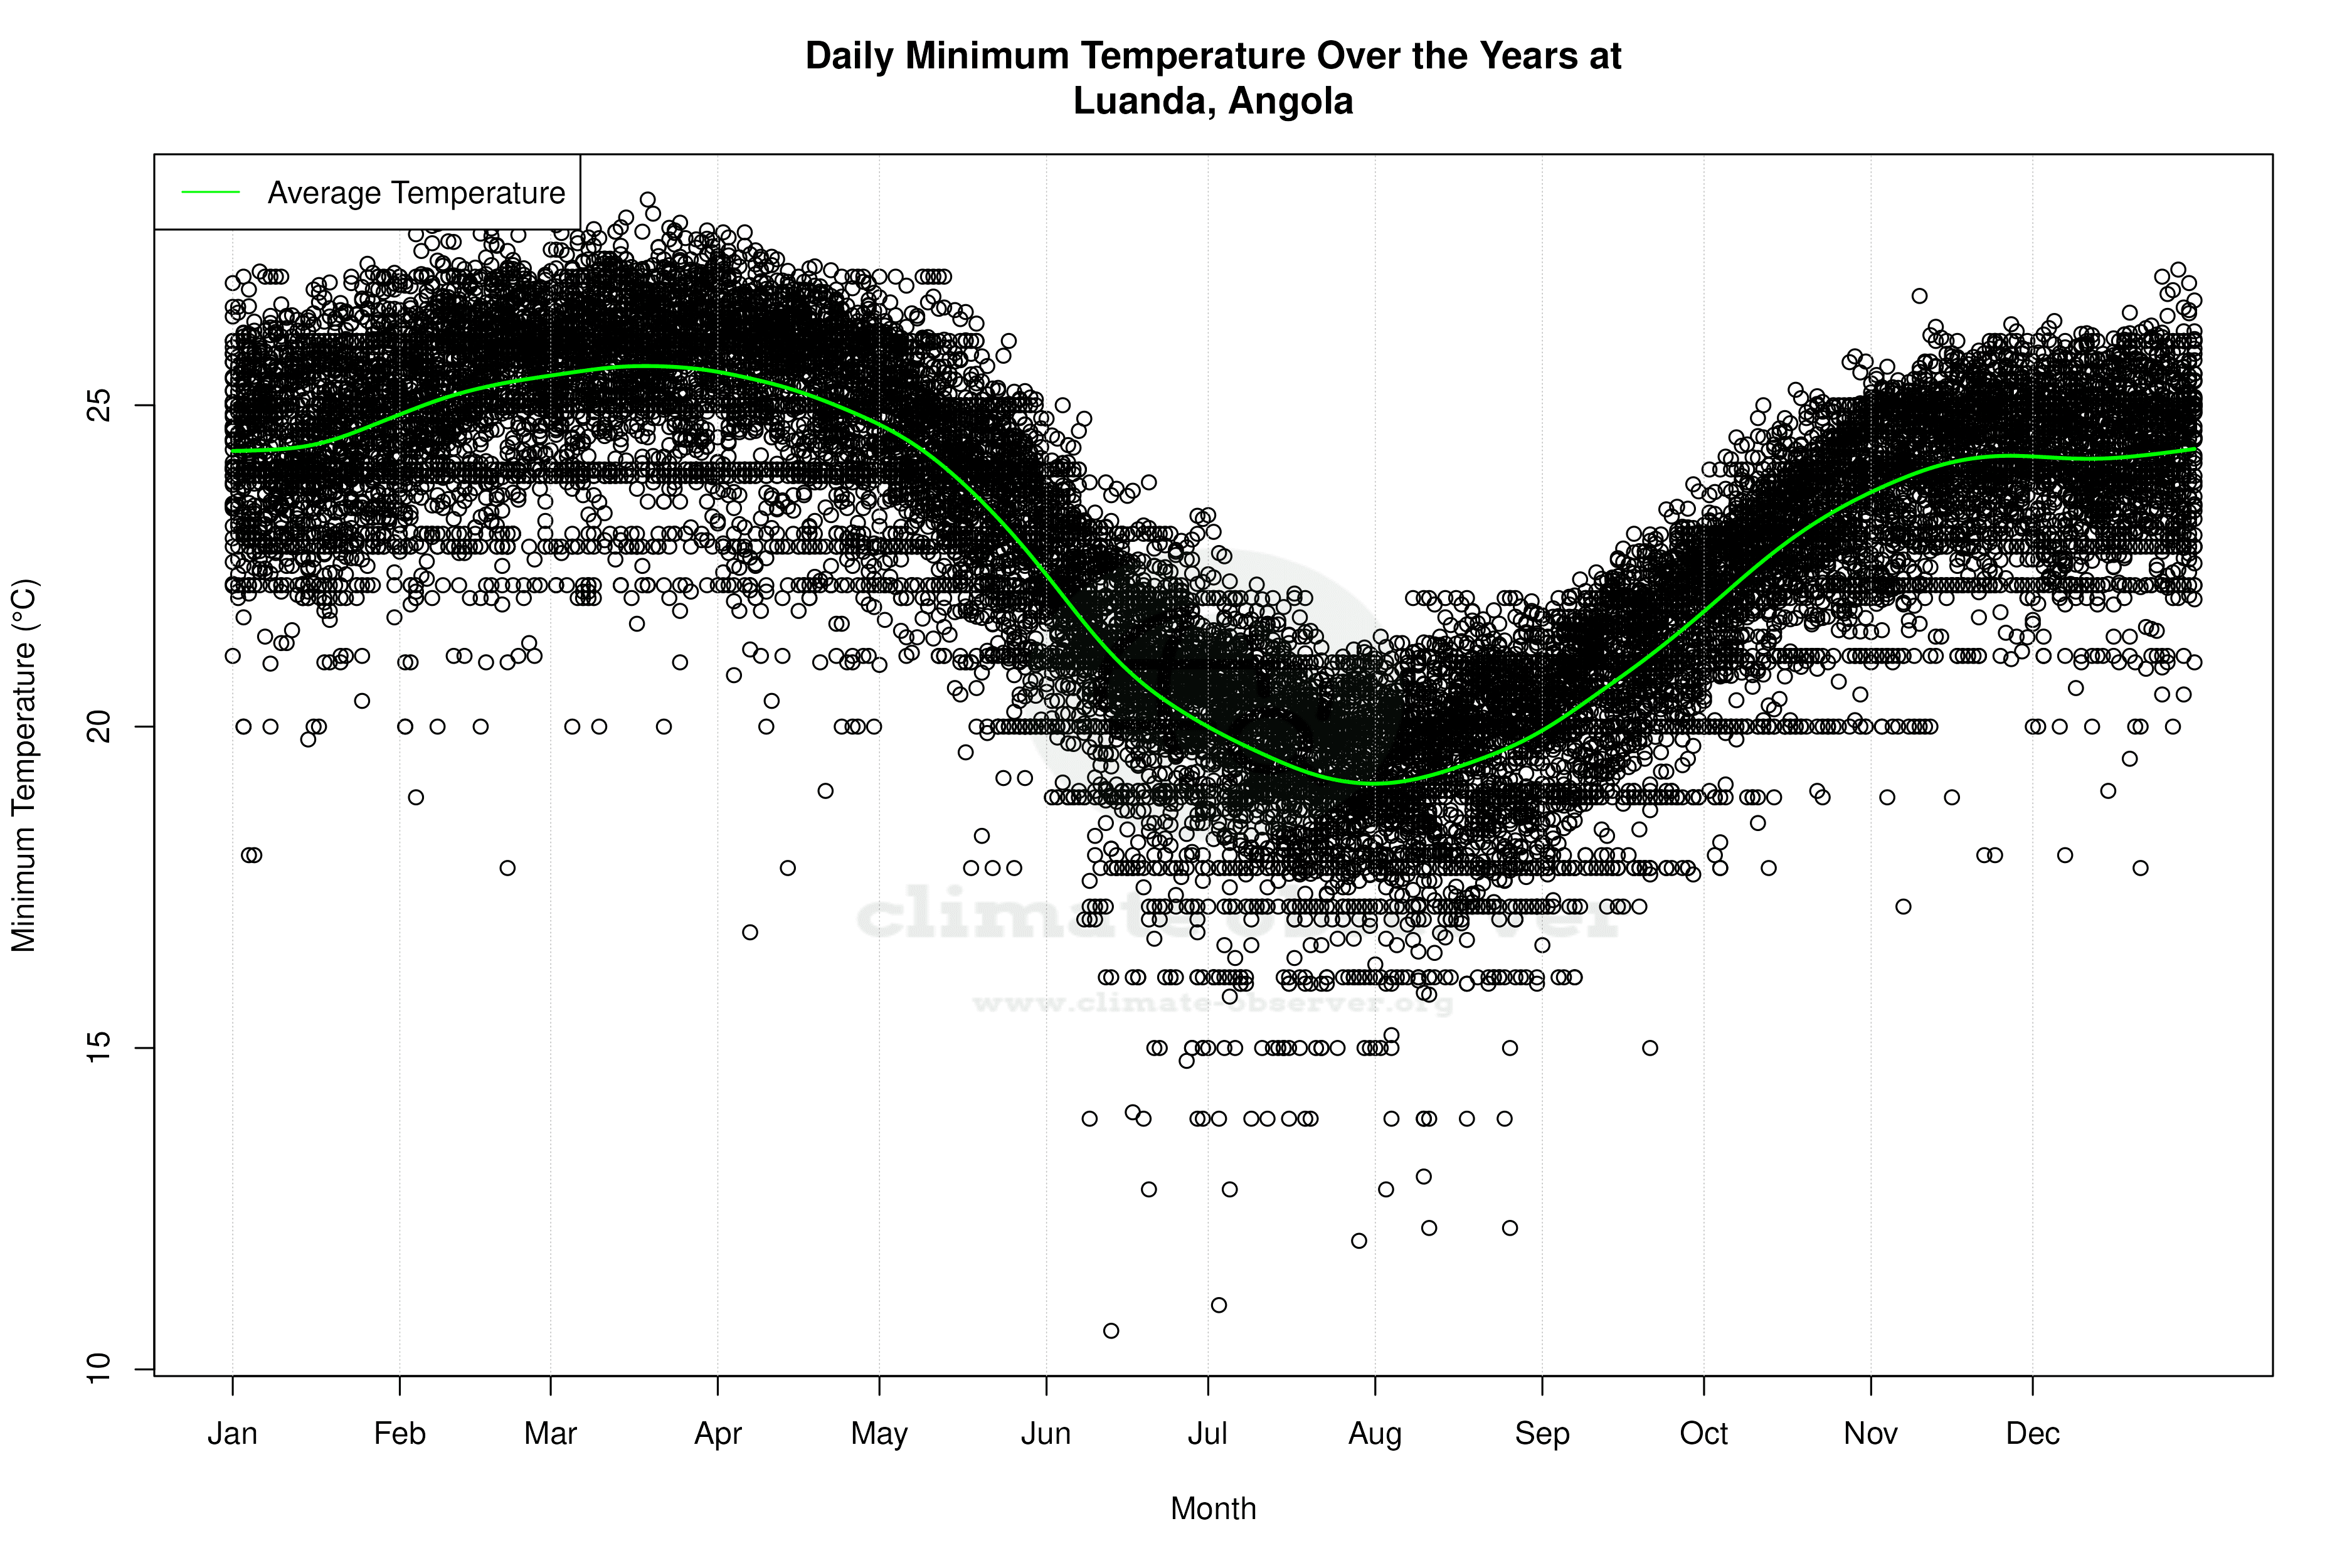
Temperature Extremes and Variability
Luanda's temperature extremes underscore its tropical climate. The highest recorded temperature is 38.0°C (100.4°F), while the lowest is 10.6°C (51.1°F). These figures highlight the range of thermal conditions experienced in the region. The warming trend in low temperatures suggests milder nights, which could affect local ecosystems and energy demand for cooling. The recent cooling trend in daytime highs might offer temporary relief from heat stress but requires further investigation to understand its drivers.
Evolving Precipitation Patterns
The Precipitation Concentration Index (PCI) offers insights into rainfall distribution. A PCI of over 20 indicates highly concentrated precipitation events, while a value under 10 suggests even distribution. Luanda's current PCI stands at 14.8, down from a baseline of 21.5. This significant decrease indicates a shift towards more evenly distributed rainfall, which could mitigate flood risks and enhance water resource management. This change may support Angola's climate adaptation strategies, which aim to bolster resilience against extreme weather events.
Regional Climate Context
Angola's climate goals focus on reducing vulnerability to climate impacts and enhancing adaptive capacity. Luanda's climate profile, with its warming trend and evolving precipitation patterns, underscores the challenges and opportunities in achieving these objectives. The city's coastal geography and urban development further complicate climate resilience efforts, necessitating integrated approaches to urban planning and environmental management.
Implications for Future Adaptation
As Luanda navigates these climatic shifts, understanding the interplay between temperature trends and precipitation distribution is crucial. The city's adaptation strategies must account for both the long-term warming trend and the recent cooling in highs, alongside the more evenly distributed rainfall. These insights will inform policy and infrastructure development, ensuring that Luanda remains resilient in the face of ongoing climate change.
Station Statistics
10-Year Trend
High: -0.62 °C/decade
Low: +0.49 °C/decade
Rain: +1.09 mm/decade
25-Year Trend
High: +0.46 °C/decade
Low: -0.02 °C/decade
Rain: +0.30 mm/decade
50-Year Trend
High: +0.38 °C/decade
Low: +0.13 °C/decade
Rain: -0.04 mm/decade
All-Time Trend
High: +0.26 °C/decade
Low: +0.19 °C/decade
Rain: -0.06 mm/decade
Percentage Above-Average Days
Last 12 Months: 60.0%
This Year: 63.6%
Precipitation Concentration Index (PCI) ℹ️
Last 12 Months: 21.6
Historical Average: 20.8
Percentile Rank of Last 12 Months ℹ️
High: 80th percentile
Low: 69th percentile
Rain: 57th percentile
Change in Variance ℹ️
High: +48.0%
Low: -20.6%
Intraday: +8.9%
Data Coverage
77.6%
First Year of Data
1960
Station Location
Historical Weather Records
| Max High | Avg High | Min High | Max Avg | Avg Avg | Min Avg | Max Low | Avg Low | Min Low | Max Precipitation | Avg Precipitation | Max Snow | Avg Snow | |
|---|---|---|---|---|---|---|---|---|---|---|---|---|---|
| Record | 38.0 °C | — | 19.8 °C | 32.8 °C | — | 16.9 °C | 28.2 °C | — | 10.6 °C | 95.0 mm | — | — | — |
| January | 35.5 °C | 29.6 °C | 24.9 °C | 29.7 °C | 26.5 °C | 23.2 °C | 27.2 °C | 24.5 °C | 18.0 °C | 92.1 mm | 1.3 mm | — | — |
| February | 36.7 °C | 30.2 °C | 26.1 °C | 30.5 °C | 27.3 °C | 23.6 °C | 28.0 °C | 25.2 °C | 17.8 °C | 62.0 mm | 1.9 mm | — | — |
| March | 37.2 °C | 30.3 °C | 25.7 °C | 31.5 °C | 27.5 °C | 23.4 °C | 28.2 °C | 25.6 °C | 16.1 °C | 95.0 mm | 3.1 mm | — | — |
| April | 38.0 °C | 29.8 °C | 24.7 °C | 32.8 °C | 27.0 °C | 23.1 °C | 27.7 °C | 25.2 °C | 16.8 °C | 89.9 mm | 3.3 mm | — | — |
| May | 36.1 °C | 29.4 °C | 25.0 °C | 32.3 °C | 25.9 °C | 20.9 °C | 27.0 °C | 23.8 °C | 17.8 °C | 38.3 mm | 0.9 mm | — | — |
| June | 35.0 °C | 27.2 °C | 22.2 °C | 27.2 °C | 23.2 °C | 17.8 °C | 25.0 °C | 21.0 °C | 10.6 °C | 4.0 mm | 0.0 mm | — | — |
| July | 31.9 °C | 25.4 °C | 19.8 °C | 25.4 °C | 21.5 °C | 16.9 °C | 23.3 °C | 19.5 °C | 11.0 °C | 20.1 mm | 0.0 mm | — | — |
| August | 31.1 °C | 25.2 °C | 21.0 °C | 26.0 °C | 21.5 °C | 17.4 °C | 22.0 °C | 19.4 °C | 12.2 °C | 29.0 mm | 0.1 mm | — | — |
| September | 32.4 °C | 26.5 °C | 22.2 °C | 26.8 °C | 22.8 °C | 18.7 °C | 23.8 °C | 20.8 °C | 15.0 °C | 47.0 mm | 0.2 mm | — | — |
| October | 32.7 °C | 28.1 °C | 23.9 °C | 27.8 °C | 24.7 °C | 19.3 °C | 25.8 °C | 22.8 °C | 11.4 °C | 70.1 mm | 0.7 mm | — | — |
| November | 36.1 °C | 28.8 °C | 24.7 °C | 29.0 °C | 25.9 °C | 22.9 °C | 26.7 °C | 24.1 °C | 17.2 °C | 59.9 mm | 1.9 mm | — | — |
| December | 36.9 °C | 29.1 °C | 23.9 °C | 30.0 °C | 26.1 °C | 21.1 °C | 27.1 °C | 24.2 °C | 17.8 °C | 59.9 mm | 1.5 mm | — | — |
Data Visualisations
Remove WatermarksCurrent Year Climate Trends vs Historical


Max Temperature this Year | 1 of 6
Climate 12-Month Moving Averages


Max Temperature 12-Month MA | 1 of 6
Daily Data Points and Averages Throughout the Year


Average Max Temperature Throughout Year | 1 of 5
