Climate for Station: Lubango Sa Da Band, Huila, Angola
Loading live weather...
Climate Analysis & Overview
Lubango, situated in the highlands of Angola, is experiencing a nuanced climate evolution. Long-term data suggests a slight cooling trend, with a decrease in high temperatures by 0.23°C (0.41°F), while recent years show a more pronounced cooling. Precipitation patterns have become marginally more even, reflecting a shift in local weather dynamics.
Highland Climate Dynamics
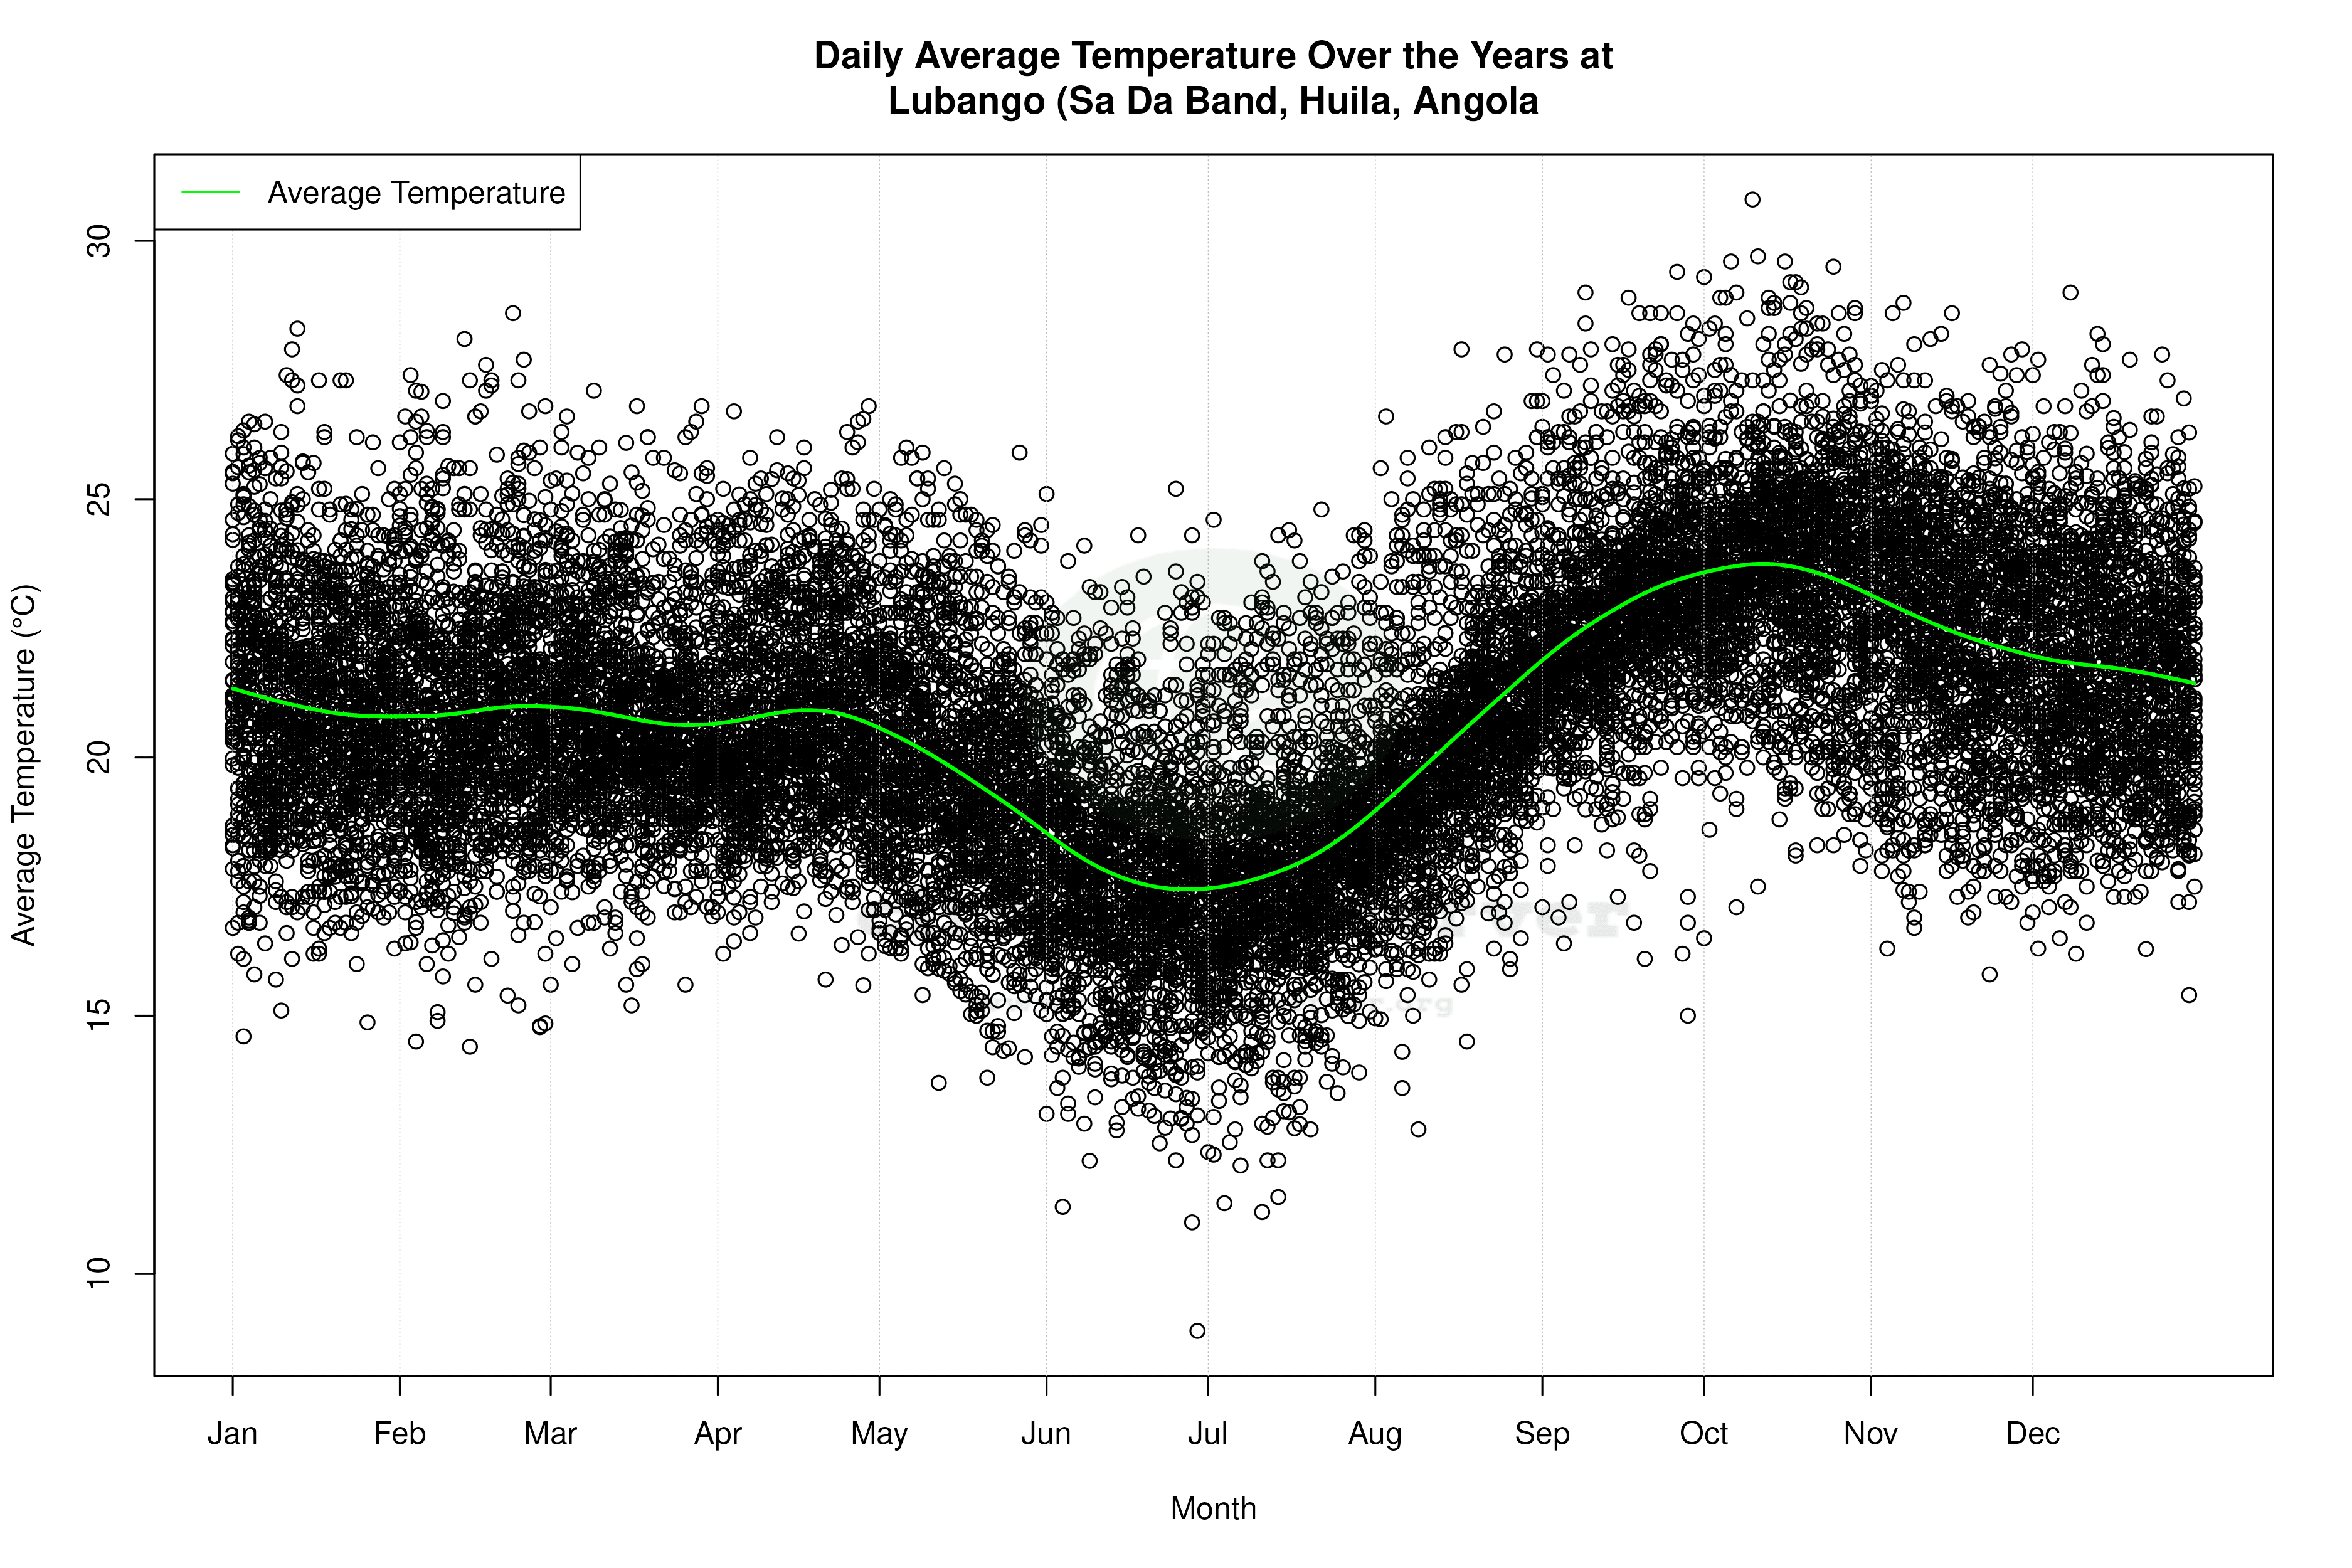
Lubango, located at an elevation of approximately 1,760 meters in the Huíla Province, is classified under the Köppen climate system as Cwb, indicating a subtropical highland climate with a dry winter. The geographical setting, nestled amidst the Serra da Chela mountain range, significantly influences its climate patterns. The altitude moderates temperatures, leading to milder summers and cooler winters compared to the surrounding lowlands.
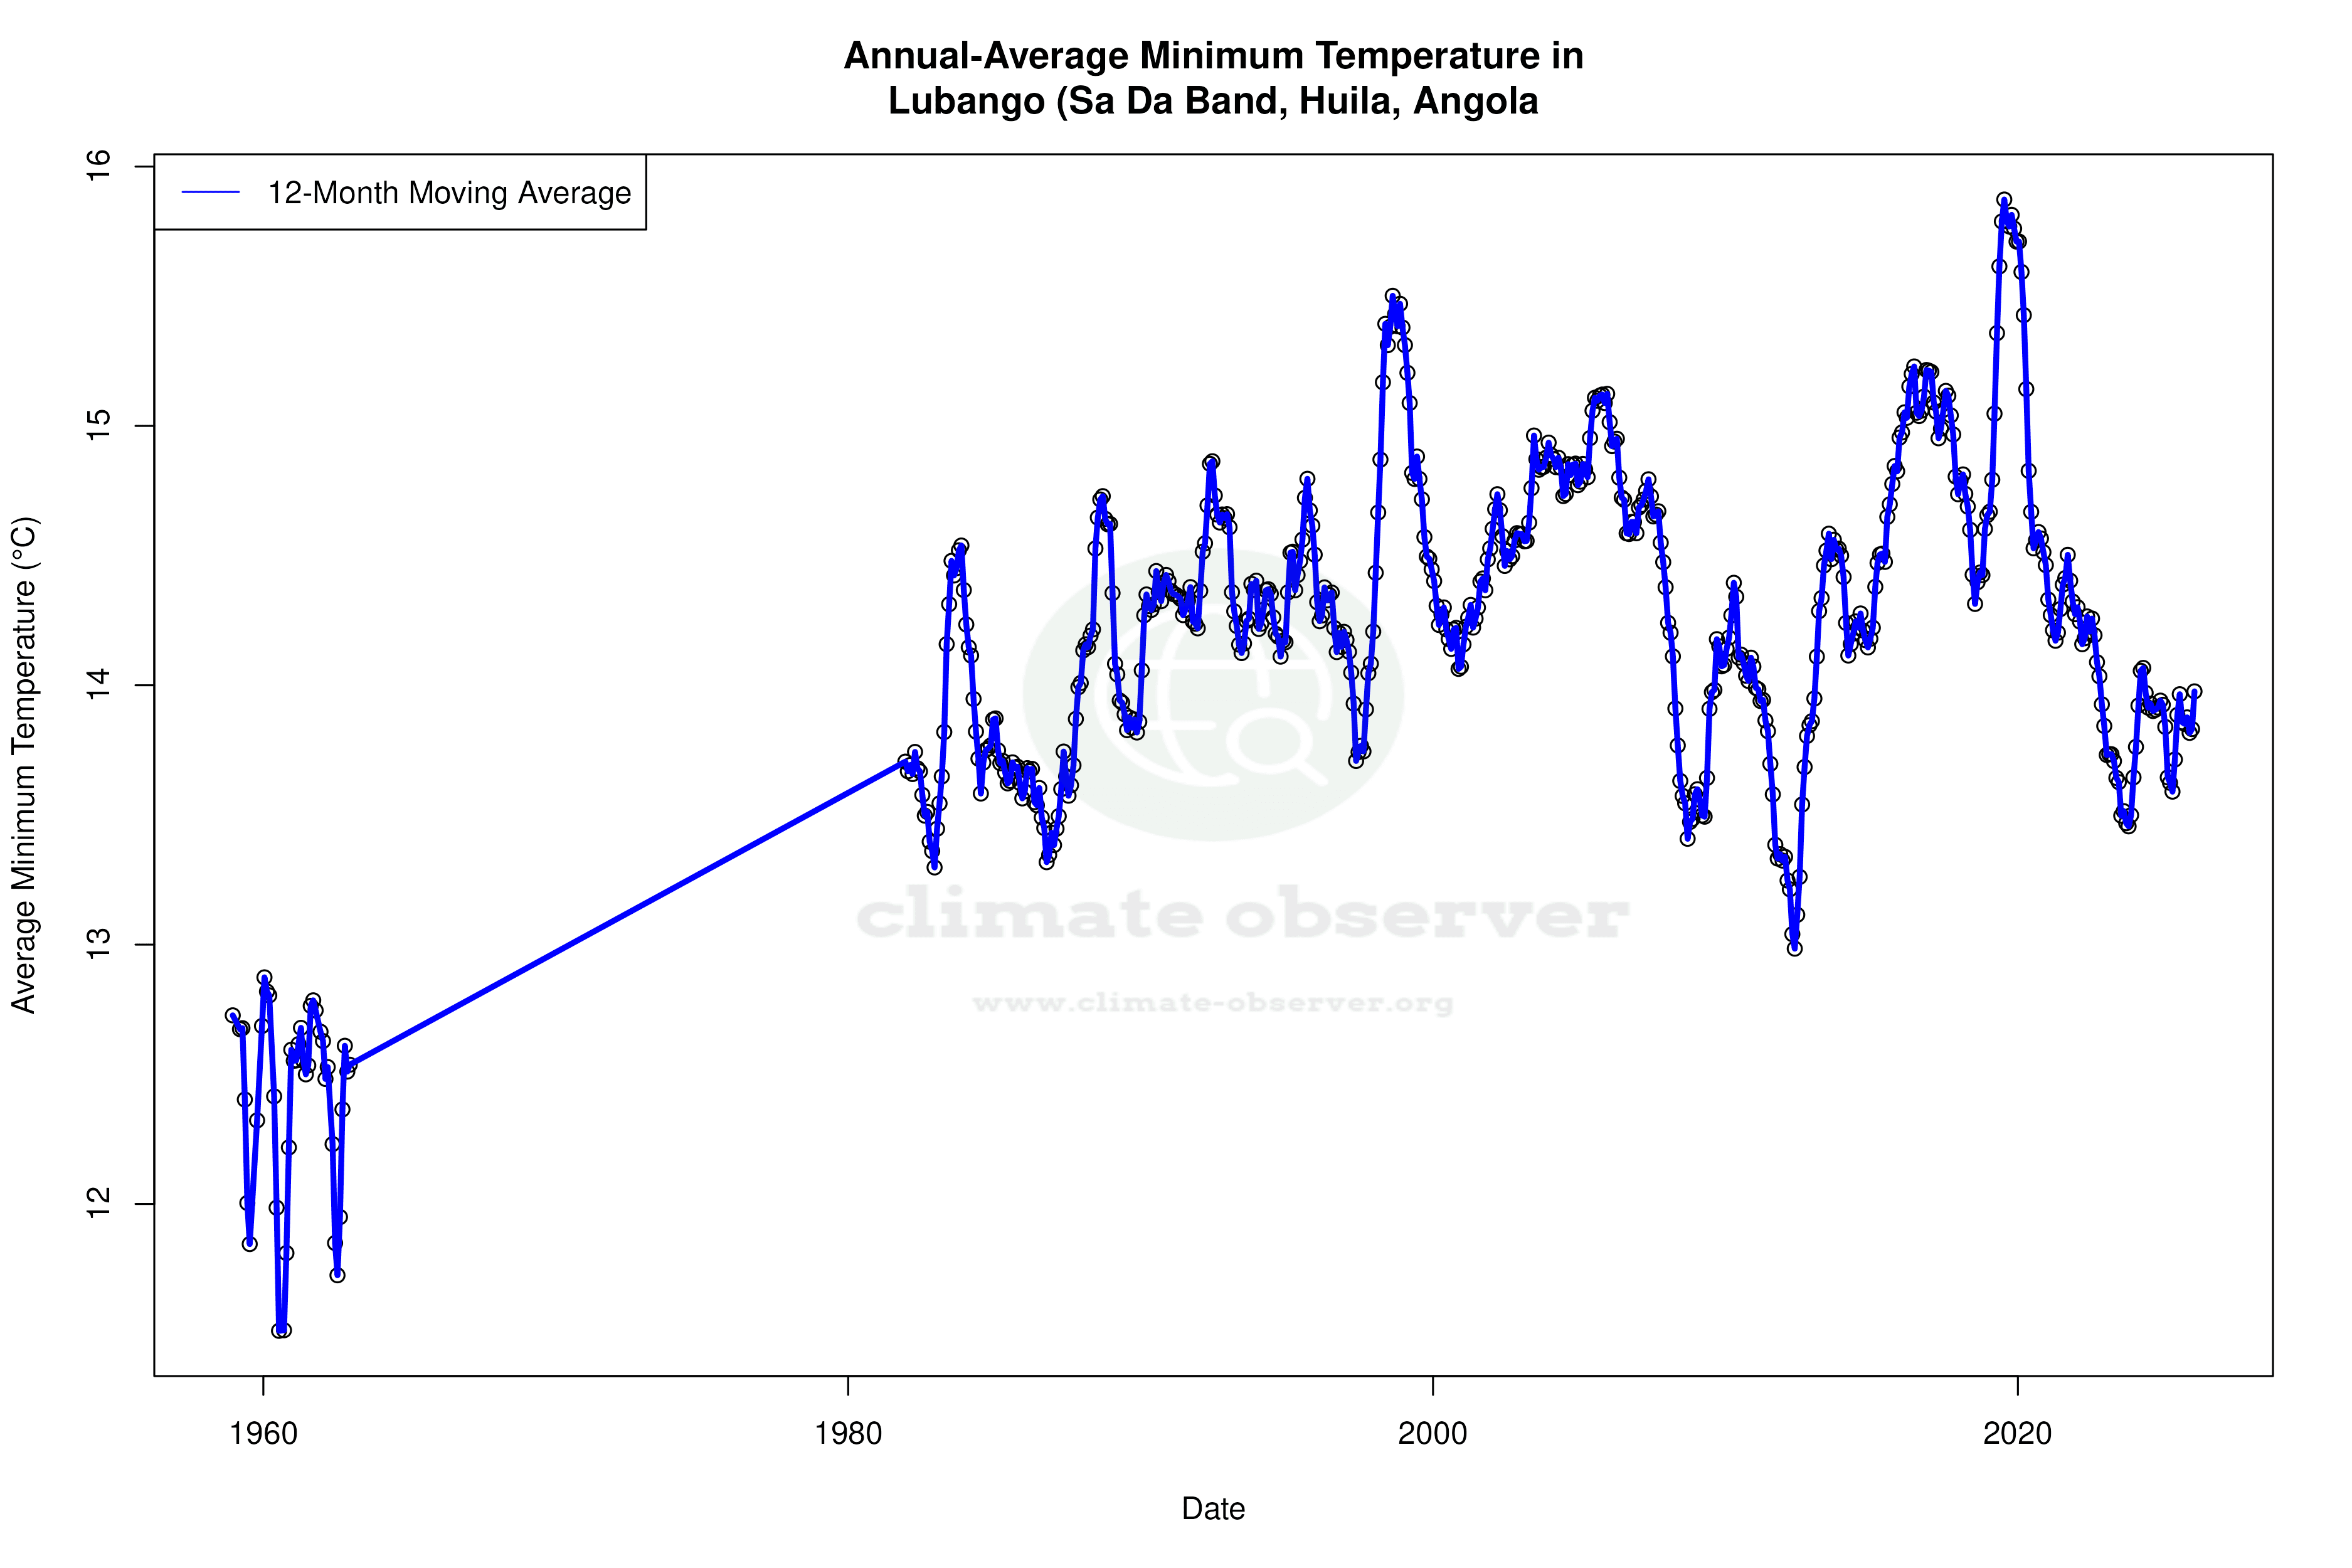
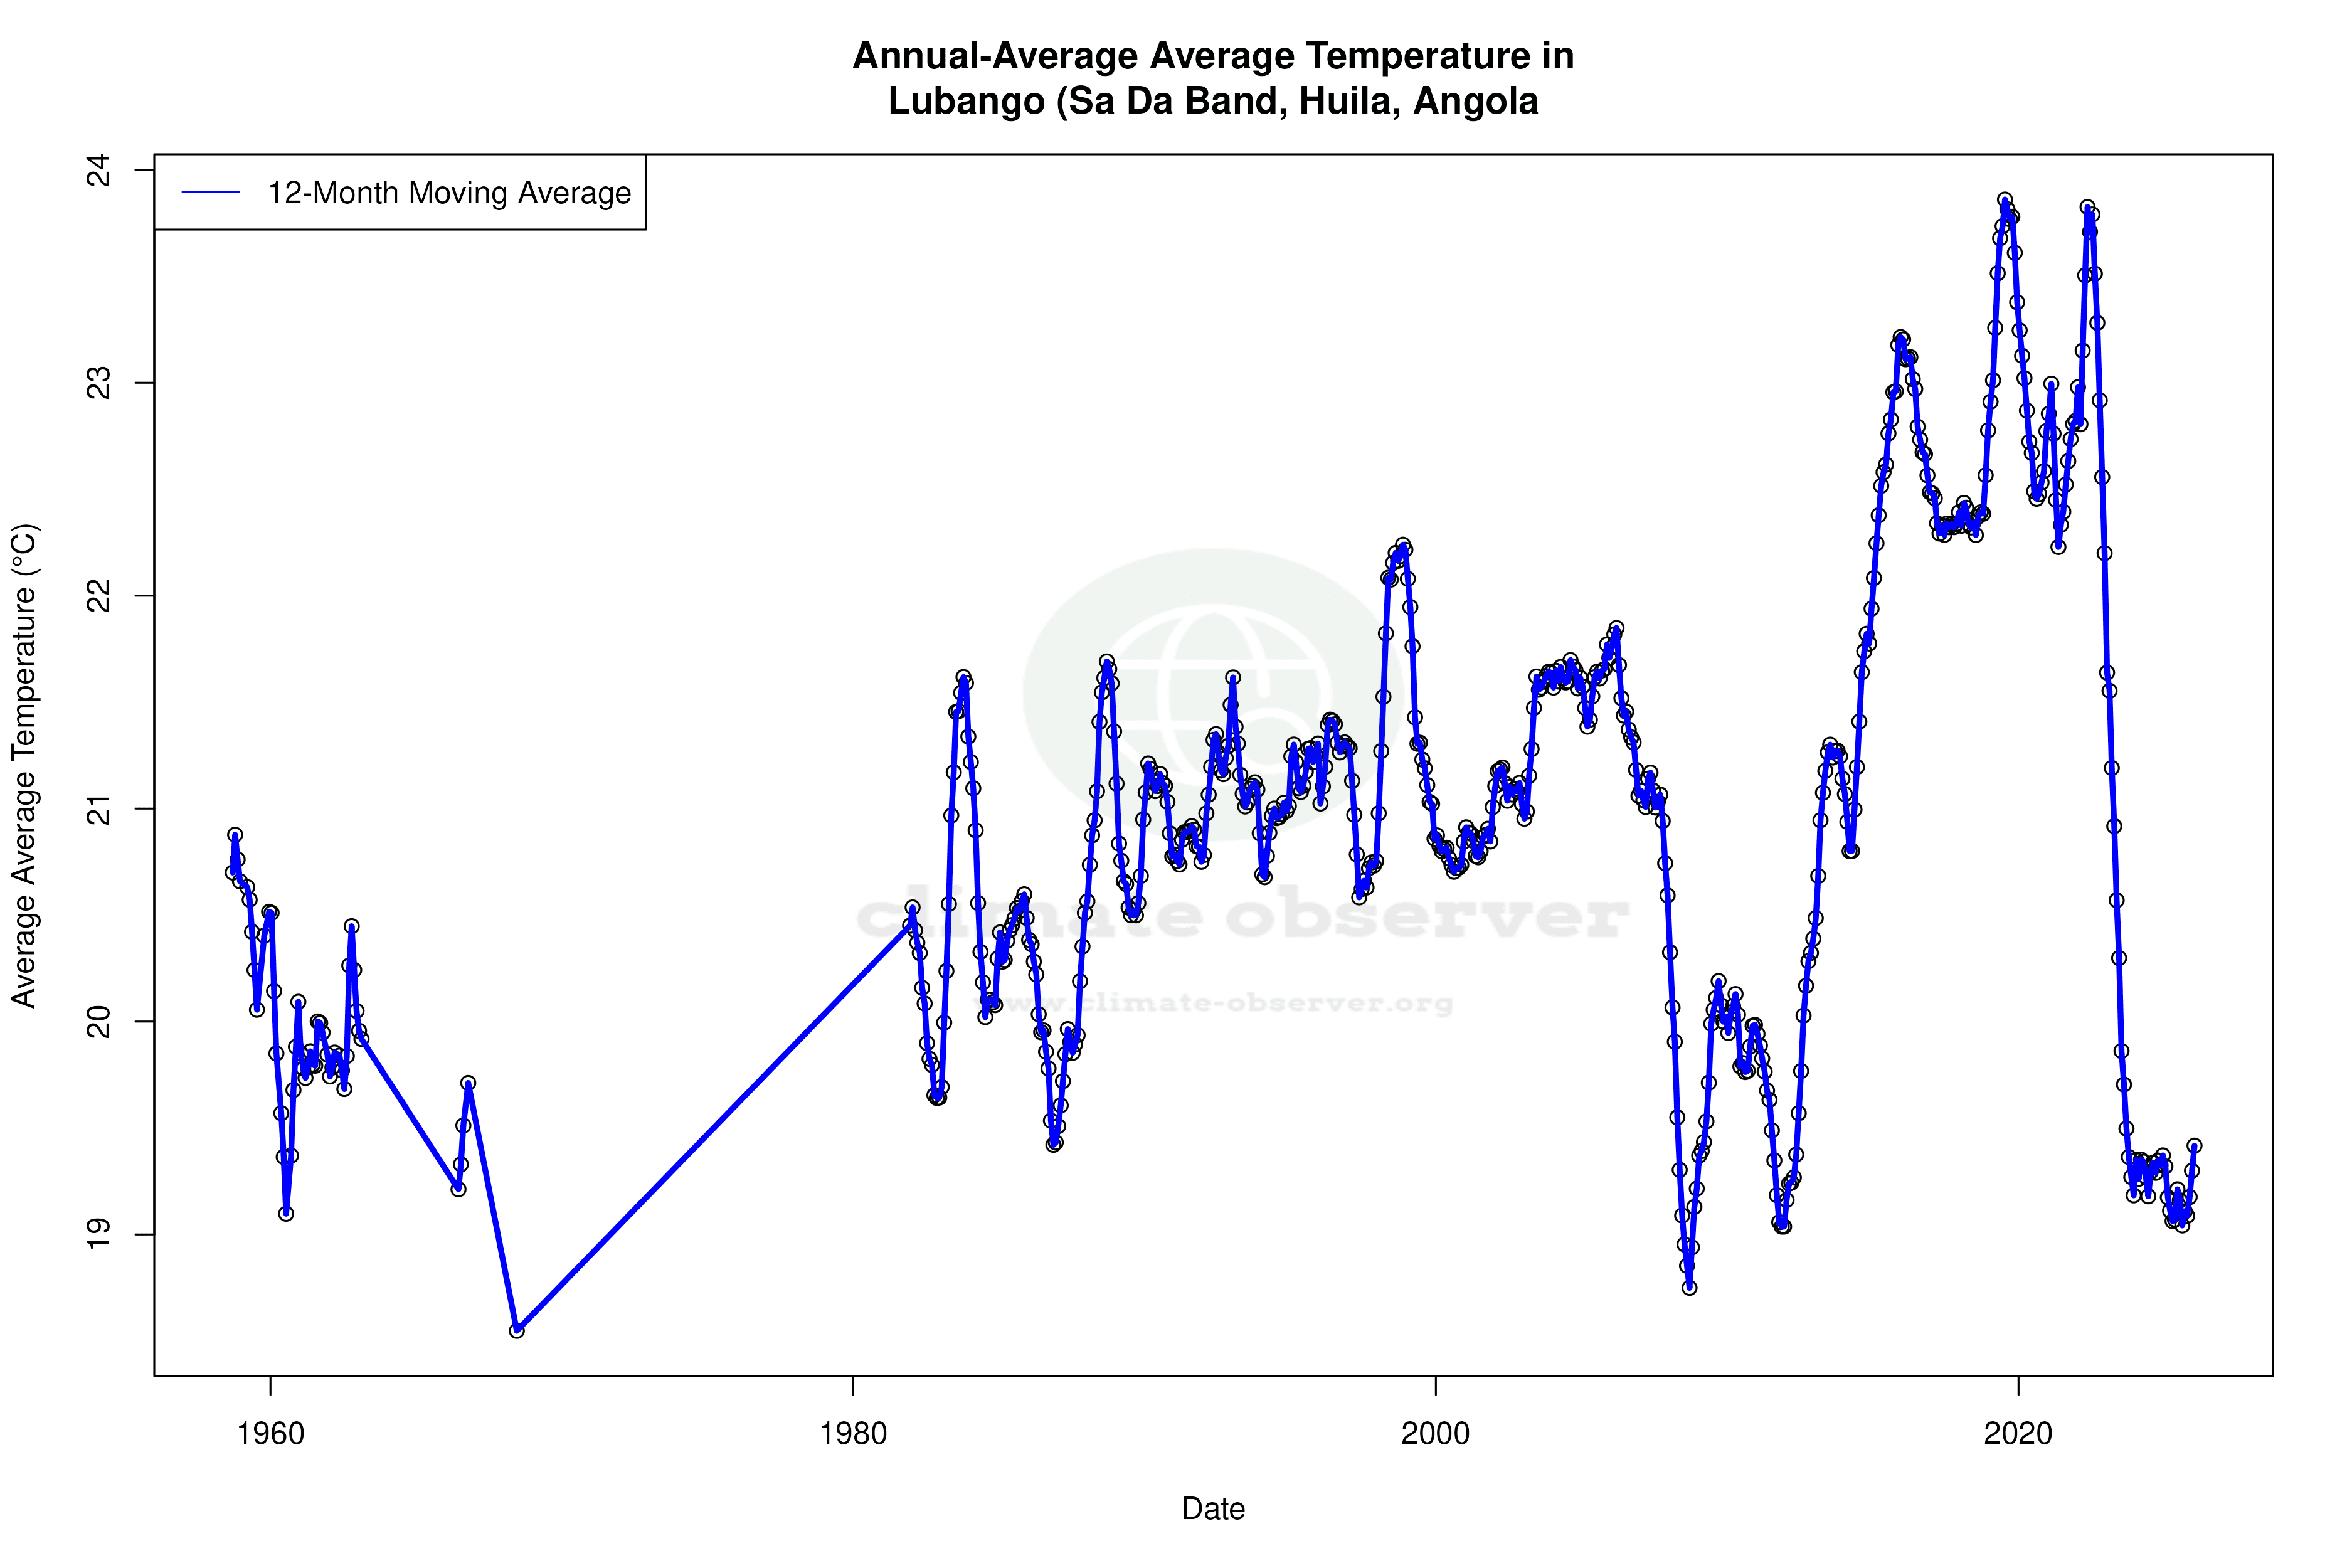
Cooling Trends in Temperature
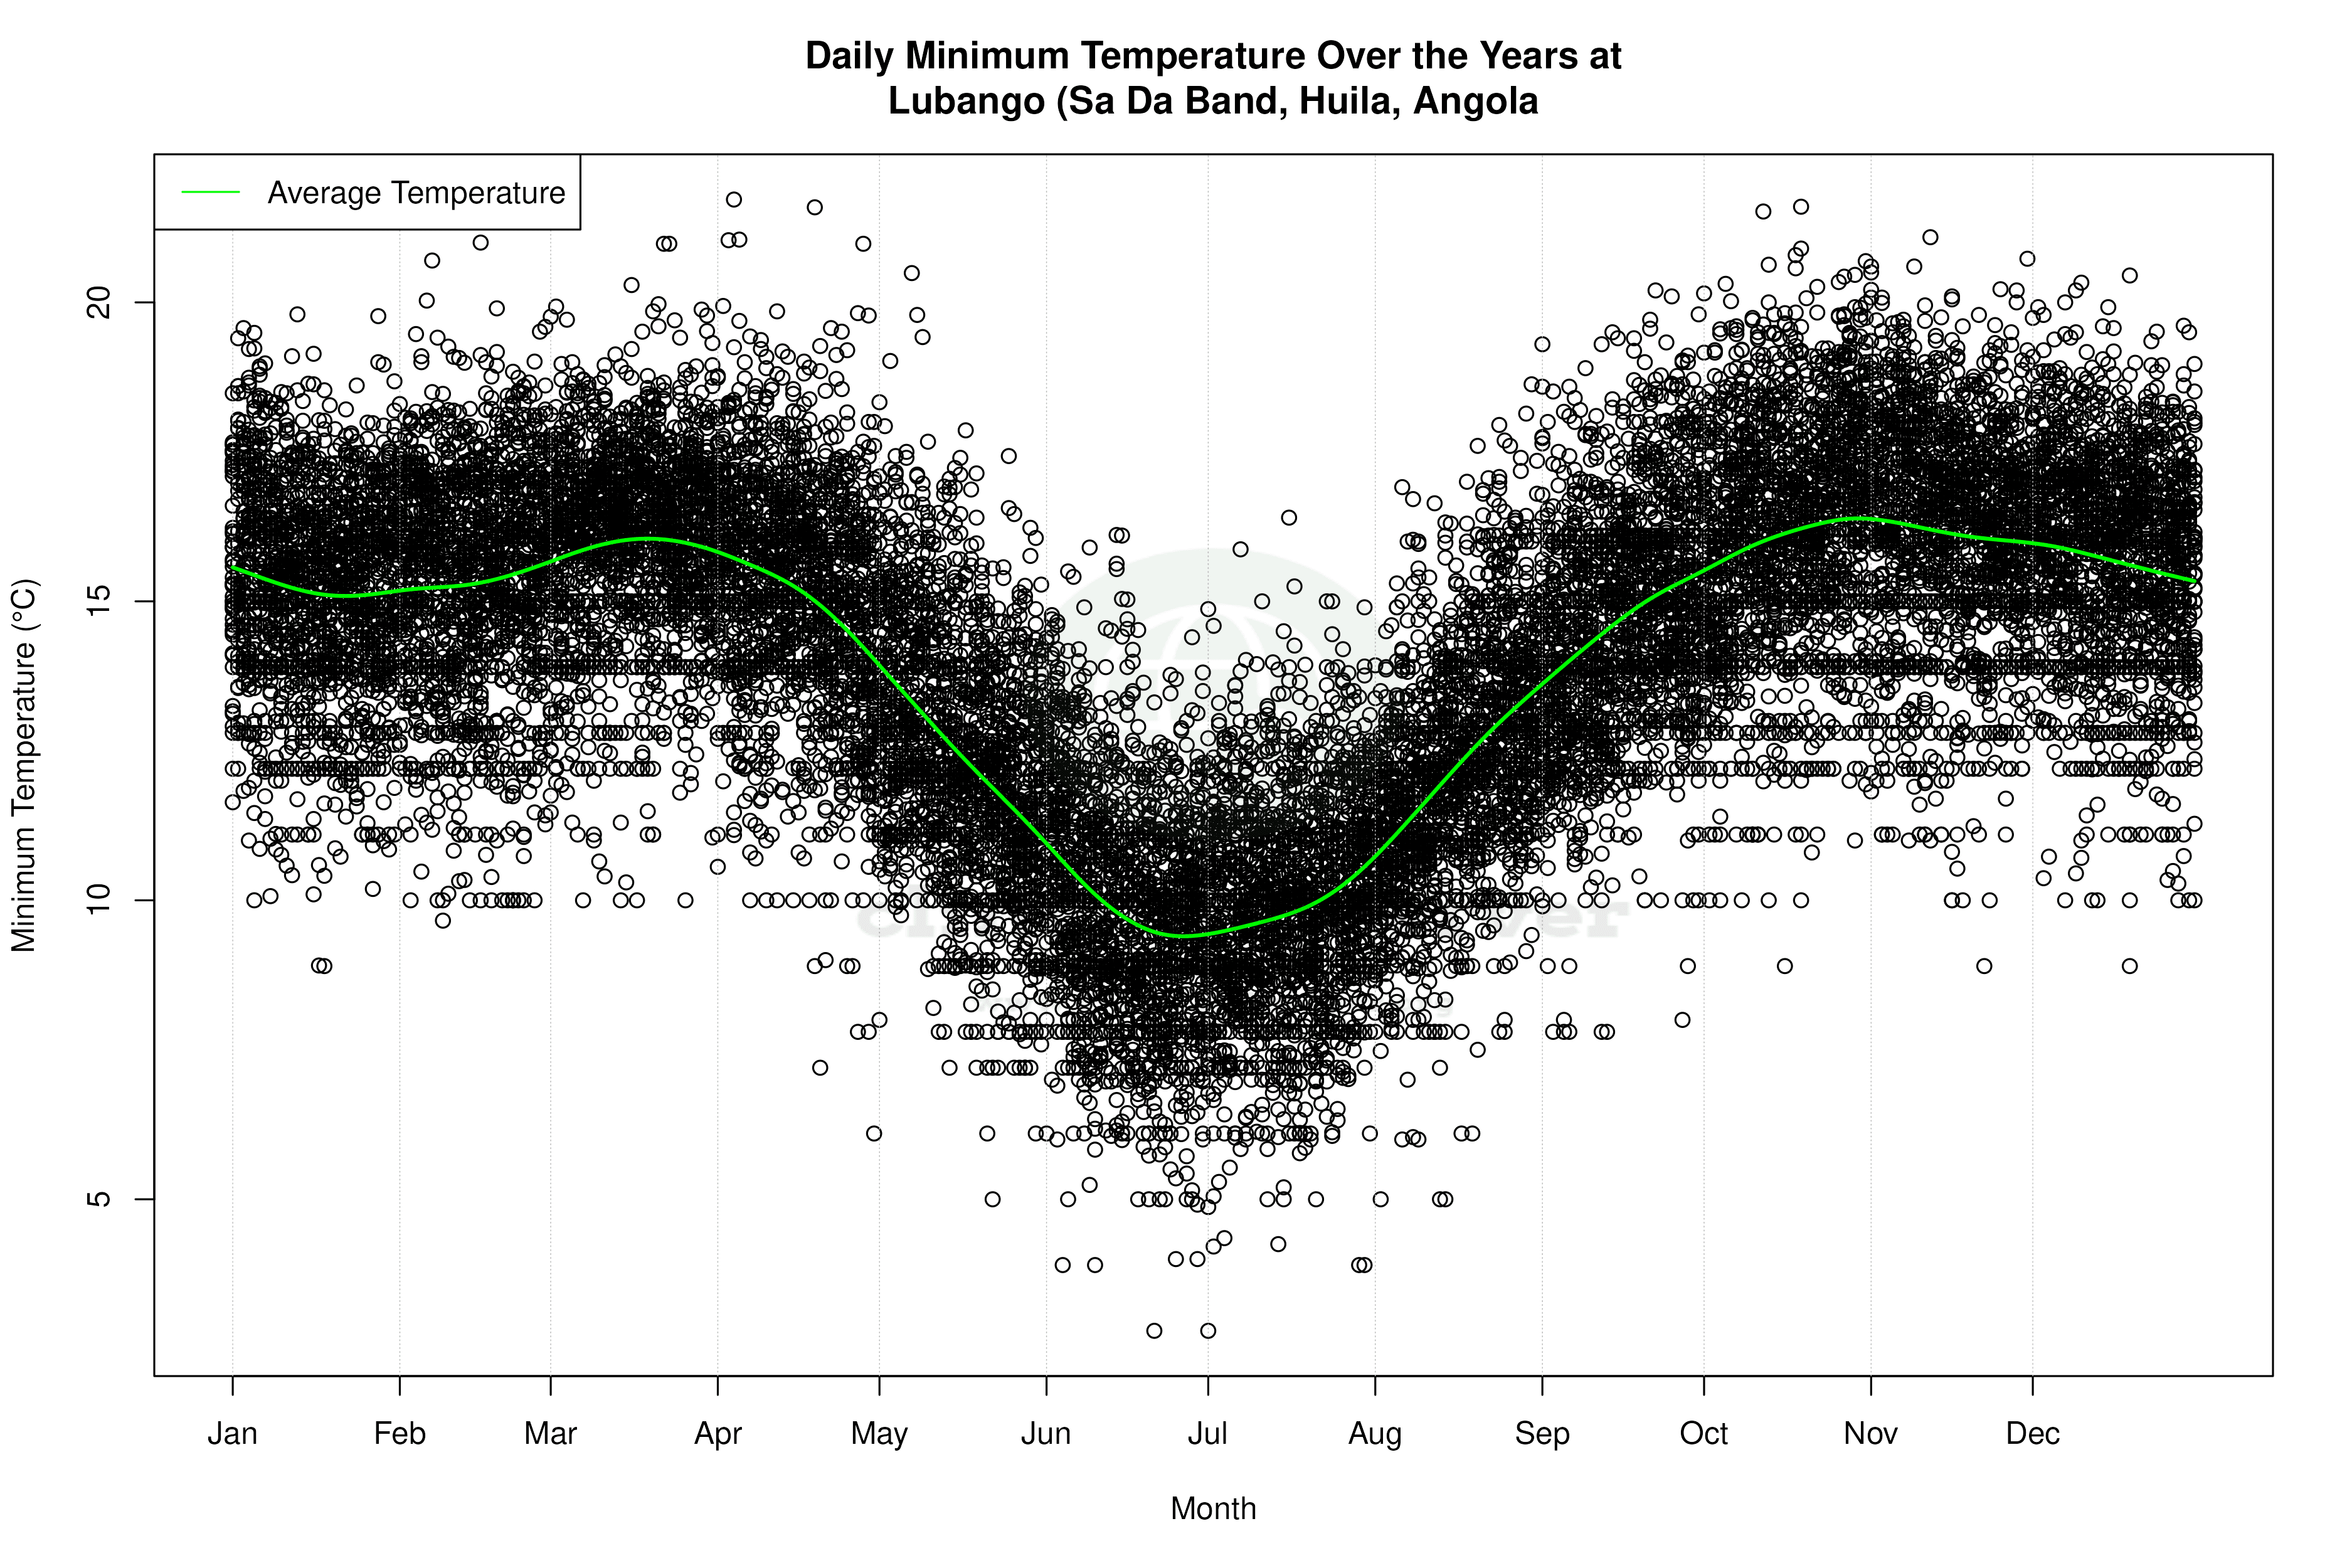
Over the past decade, Lubango has experienced a noticeable cooling in temperature extremes. Highs have decreased by 4.65°C (8.38°F), while lows have fallen by 1.77°C (3.18°F). These changes are more pronounced than the all-time trends, which show a slight cooling in highs by 0.23°C (0.41°F) and a marginal warming in lows by 0.24°C (0.43°F). This divergence suggests a recent intensification of cooling, possibly influenced by local or regional climatic shifts.
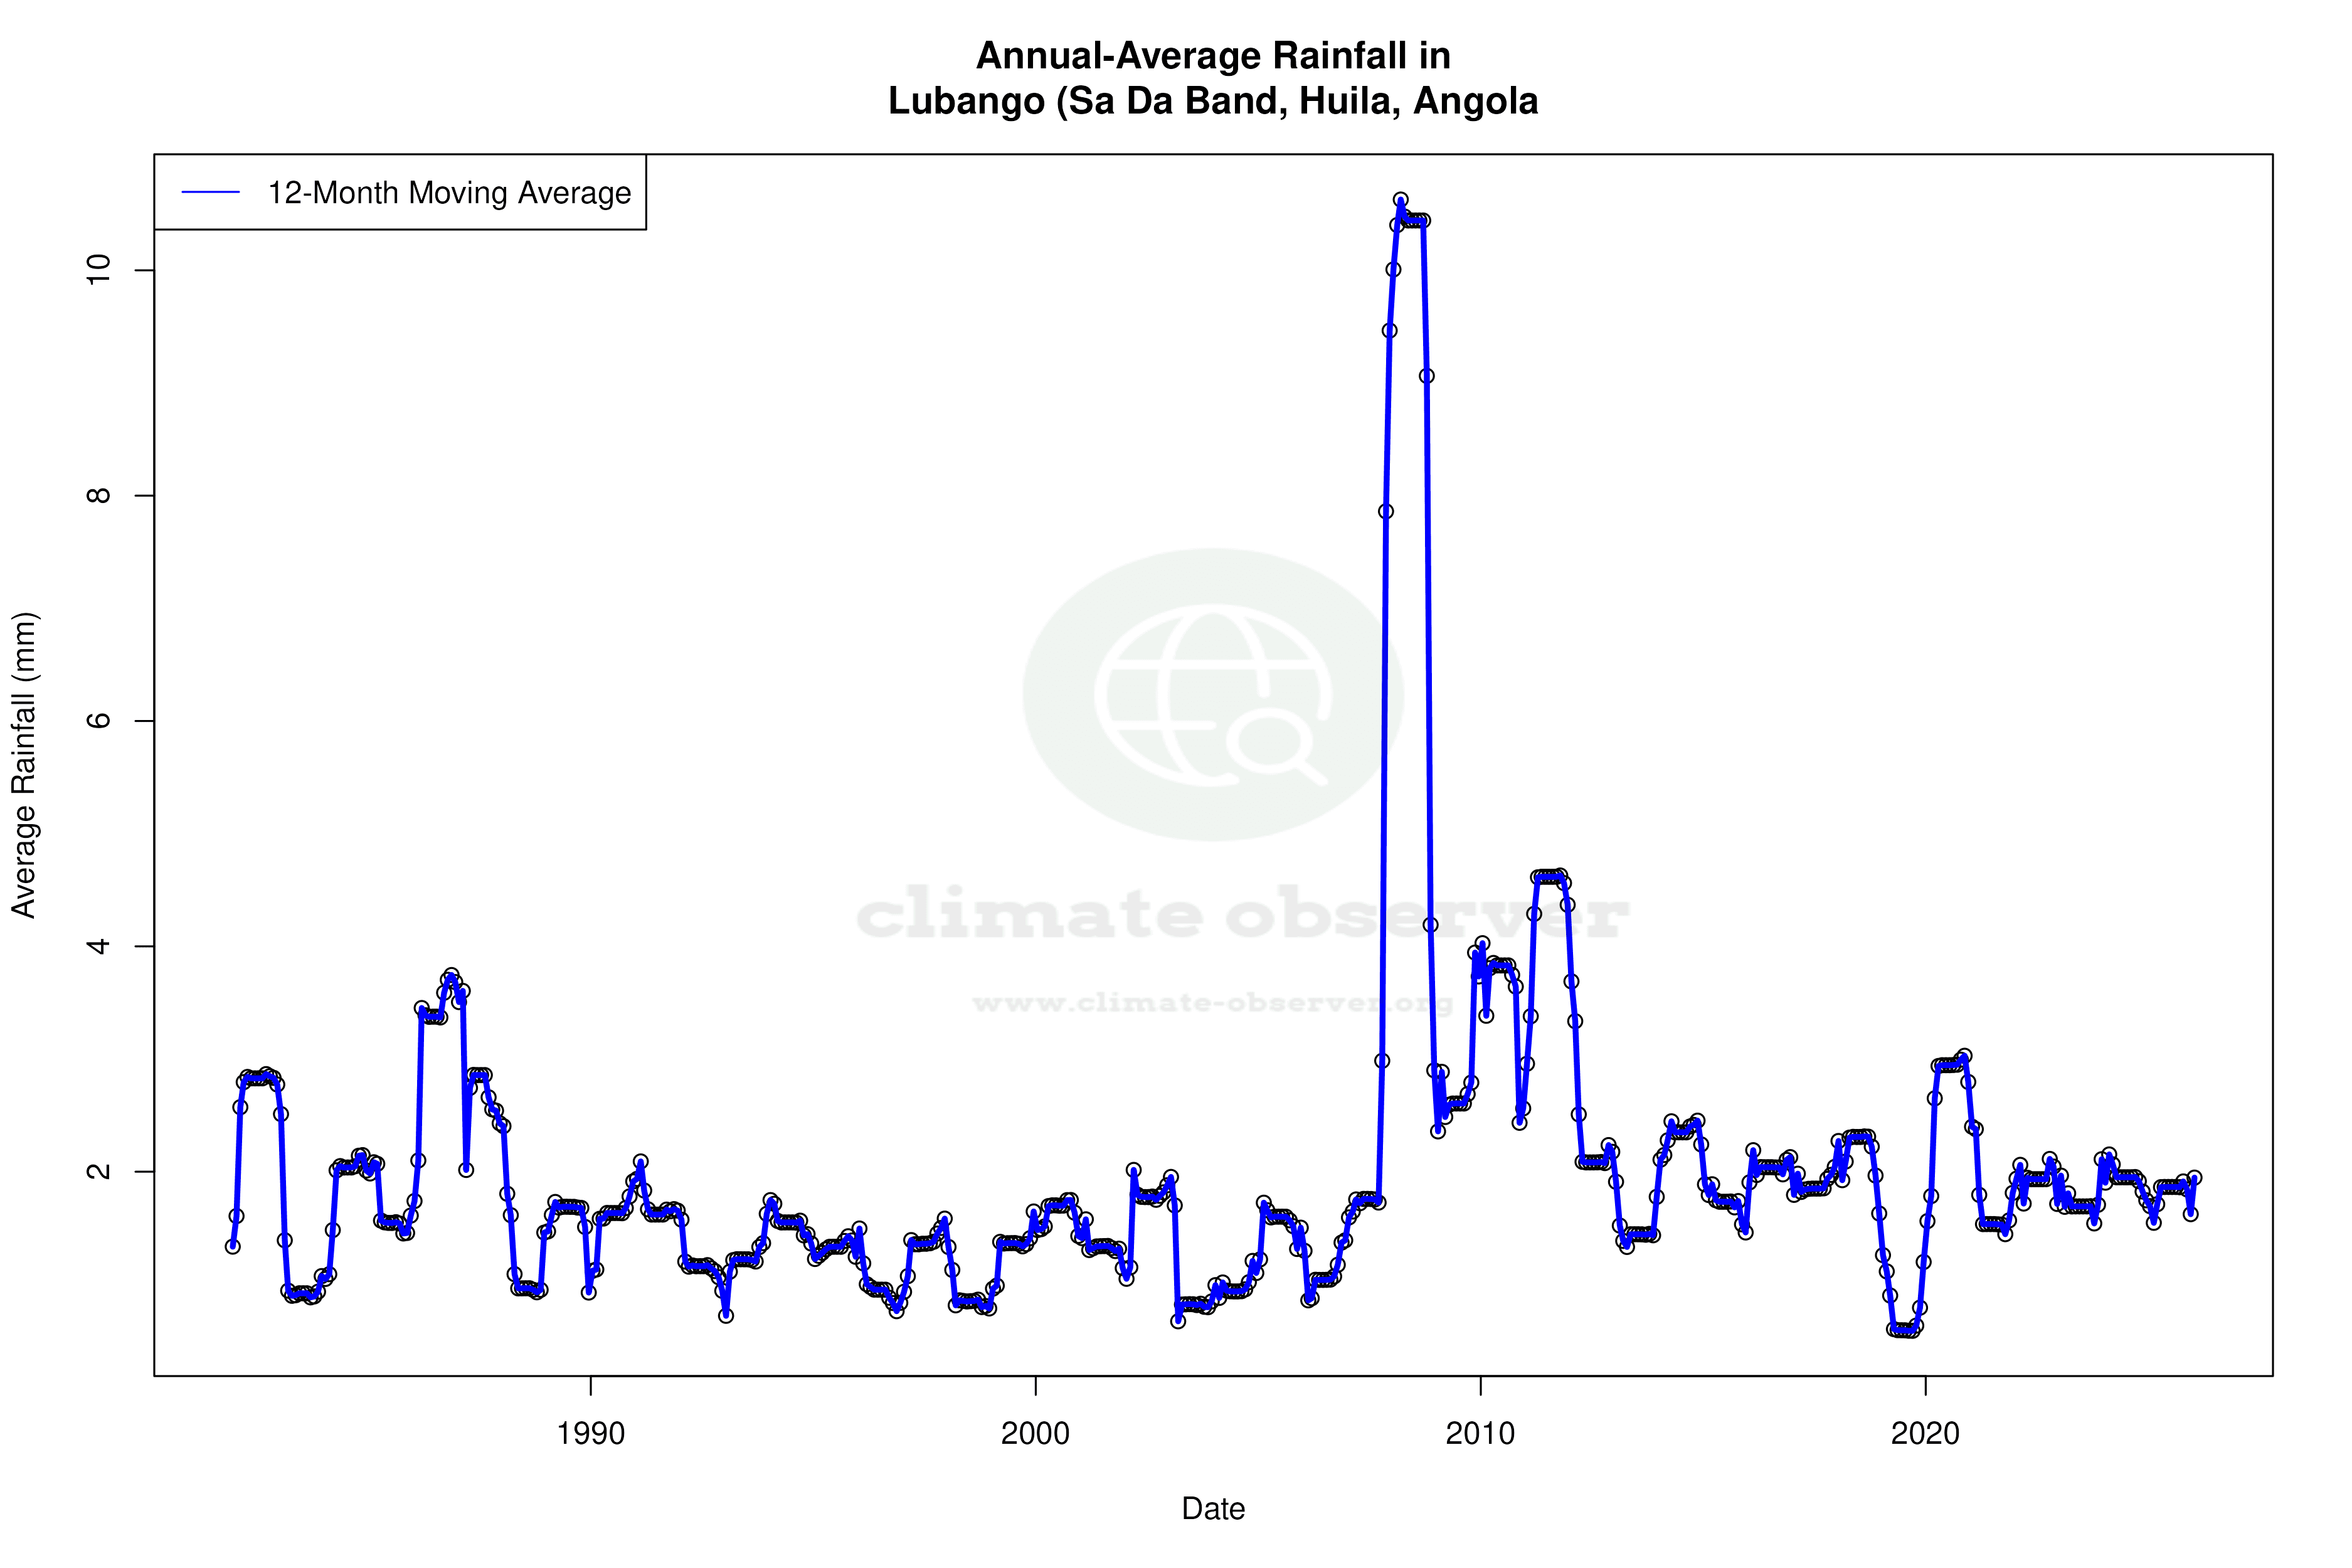
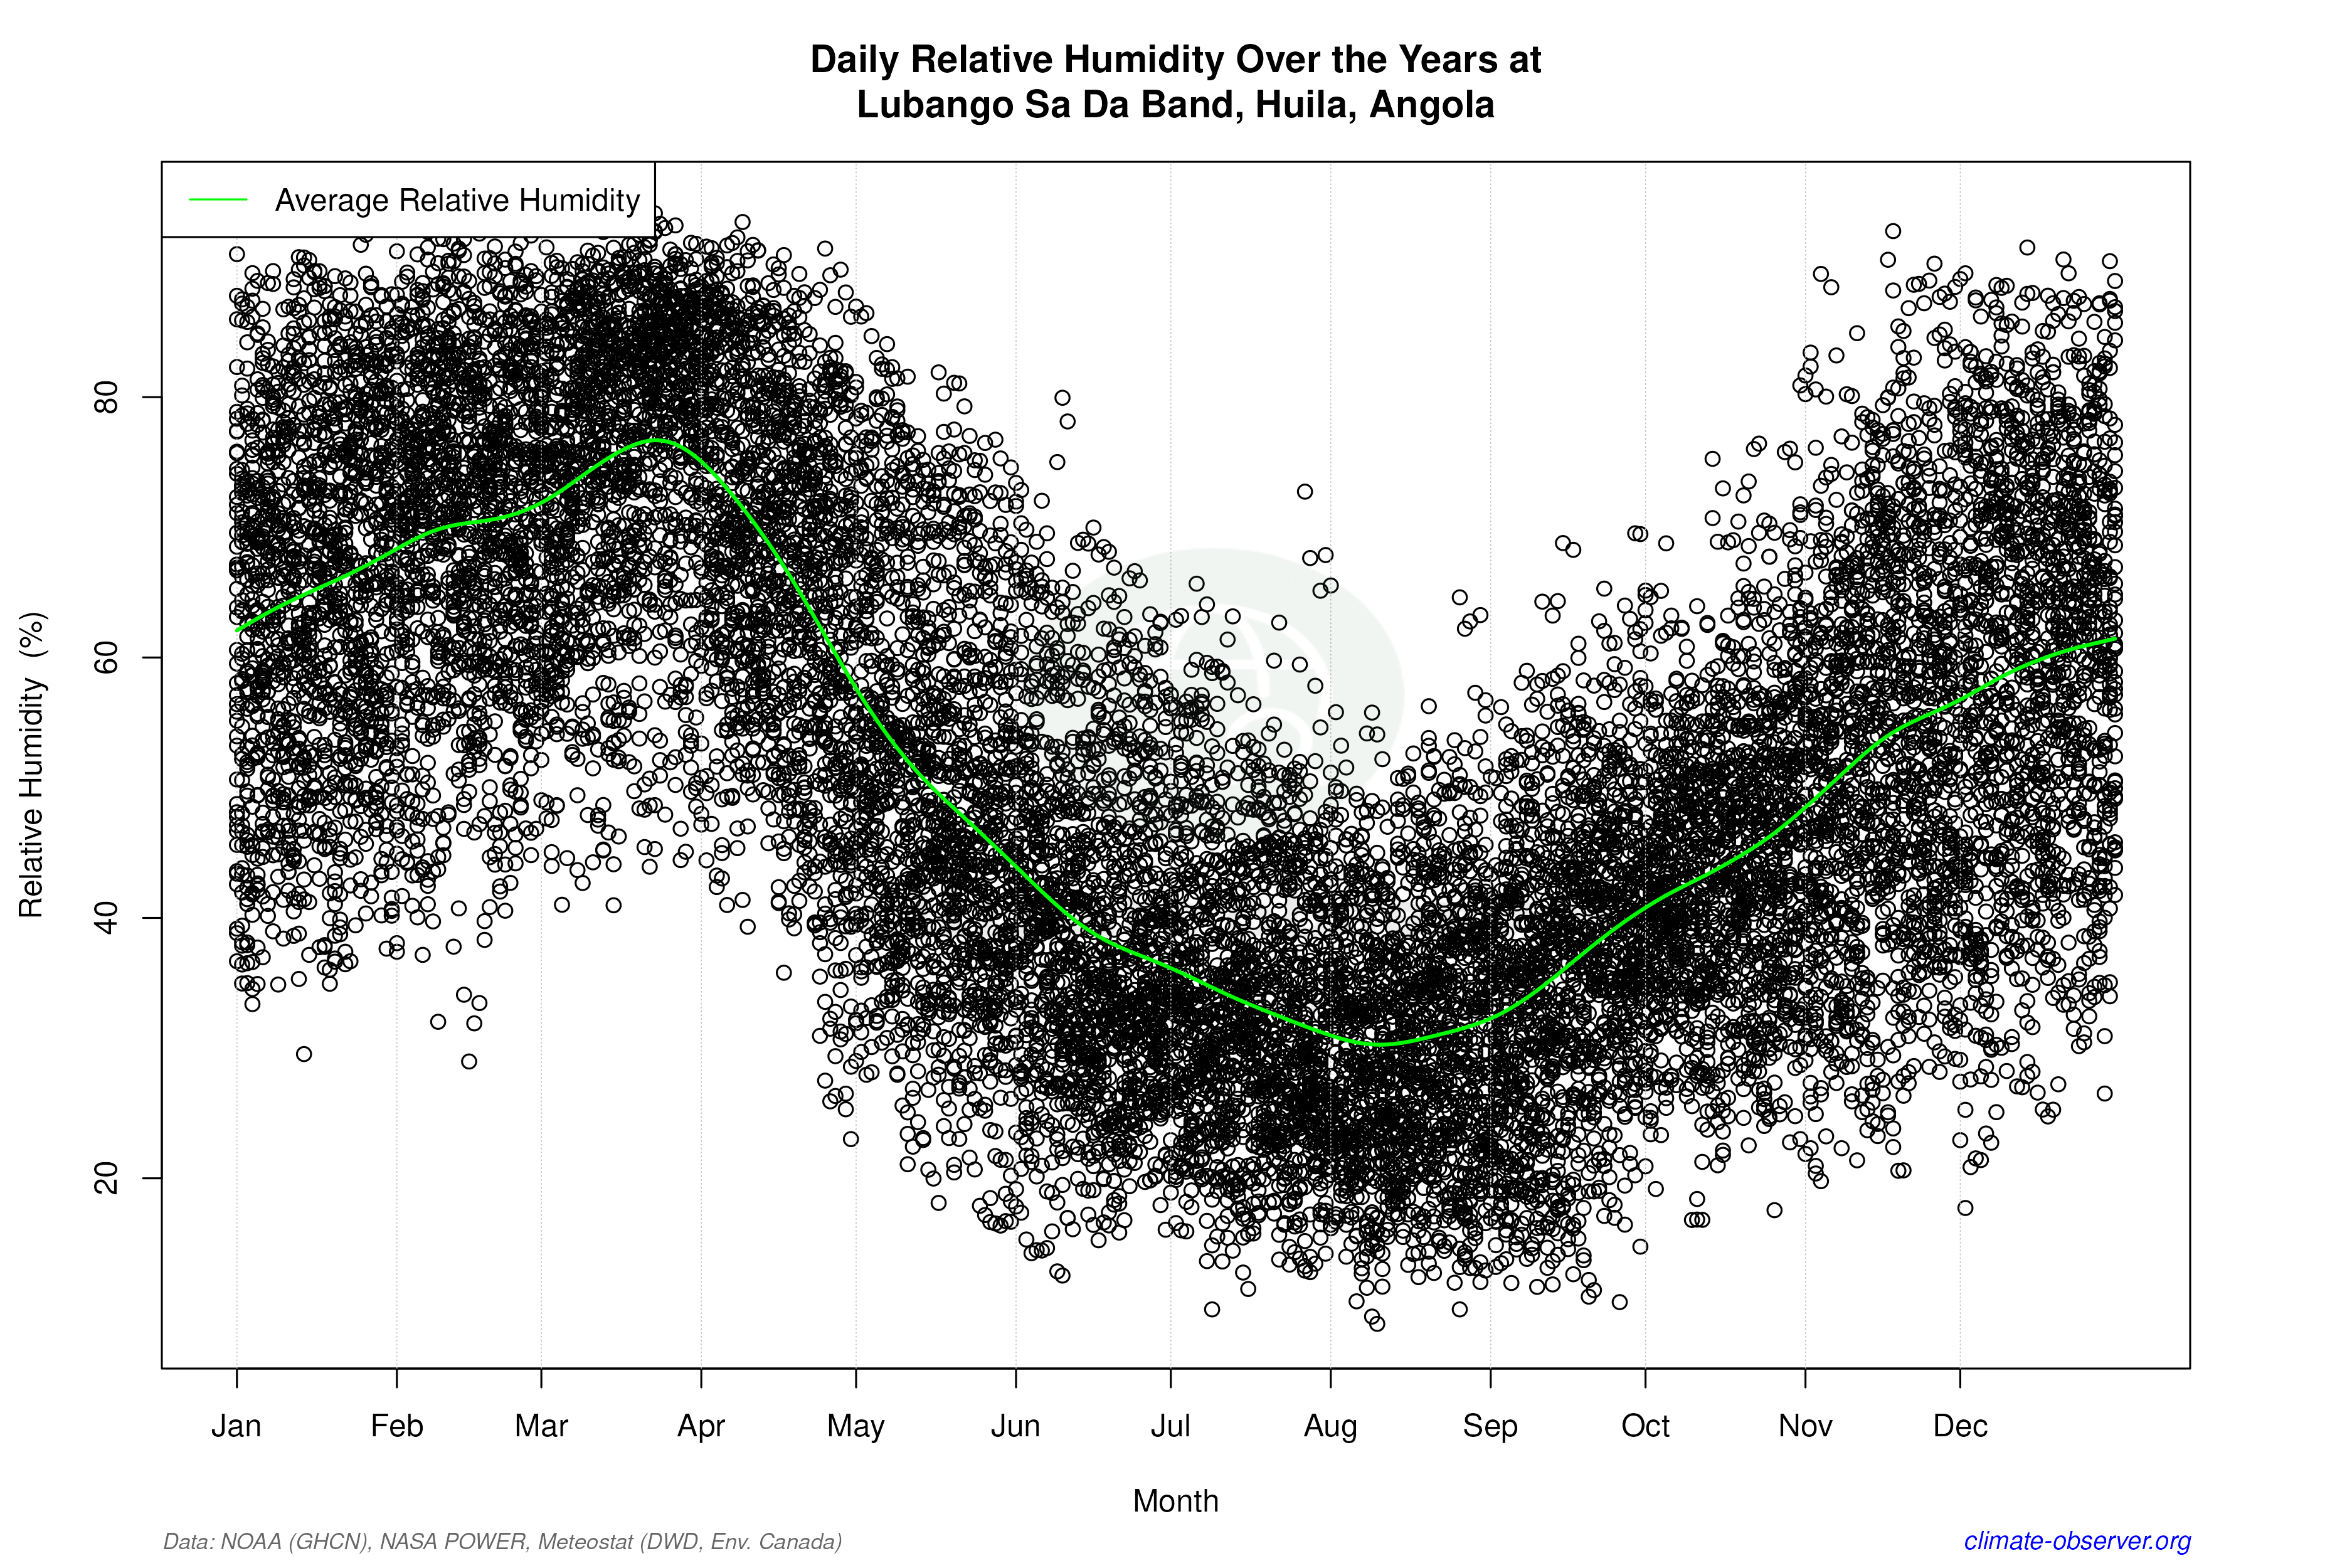
Precipitation Patterns: A Shift Towards Even Distribution
The Precipitation Concentration Index (PCI) for Lubango has decreased from a baseline of 25.47 to a current value of 22.72. This indicates a marginal shift towards more evenly distributed rainfall throughout the year. While the PCI remains high, suggesting some concentration in precipitation events, the decrease points to a trend where rainfall is less clustered and potentially more beneficial for agriculture and water resource management.
Temperature Extremes and Records
Lubango's temperature records highlight its climatic variability, with an all-time high of 38.9°C (102.0°F) and a low of 2.8°C (37.0°F). These extremes underscore the city's ability to experience significant thermal oscillations despite its generally moderate climate. The high altitude and geographic positioning contribute to these variations, offering a unique microclimate within the broader regional context.
Regional Climate Considerations
Angola's climate strategy focuses on adapting to changing weather patterns, enhancing resilience against climate variability. Lubango's evolving climate, marked by cooling trends and shifts in precipitation distribution, aligns with broader regional goals to manage water resources effectively and mitigate the impacts of climate change. Recent weather events, such as unseasonal rains or dry spells, further highlight the importance of continuous monitoring and adaptive strategies in this highland region.
Station Statistics
10-Year Trend
High: -4.64 °C/decade
Low: -1.64 °C/decade
Rain: +0.09 mm/decade
25-Year Trend
High: -0.84 °C/decade
Low: -0.15 °C/decade
Rain: -0.23 mm/decade
50-Year Trend
High: -0.31 °C/decade
Low: +0.08 °C/decade
Rain: +0.14 mm/decade
All-Time Trend
High: -0.25 °C/decade
Low: +0.24 °C/decade
Rain: +0.14 mm/decade
Percentage Above-Average Days
Last 12 Months: 23.0%
This Year: 34.8%
Precipitation Concentration Index (PCI) ℹ️
Last 12 Months: 16.5
Historical Average: 23.2
Percentile Rank of Last 12 Months ℹ️
High: 3rd percentile
Low: 33rd percentile
Rain: 70th percentile
Change in Variance ℹ️
High: -1.2%
Low: -15.8%
Intraday: -13.4%
Data Coverage
73.9%
First Year of Data
1957
Station Location
Historical Weather Records
| Max High | Avg High | Min High | Max Avg | Avg Avg | Min Avg | Max Low | Avg Low | Min Low | Max Precipitation | Avg Precipitation | Max Snow | Avg Snow | |
|---|---|---|---|---|---|---|---|---|---|---|---|---|---|
| Record | 38.9 °C | — | 17.0 °C | 30.8 °C | — | 8.9 °C | 21.7 °C | — | 2.8 °C | 211.8 mm | — | — | — |
| January | 36.6 °C | 27.8 °C | 17.0 °C | 28.3 °C | 20.9 °C | 14.6 °C | 19.8 °C | 15.2 °C | 8.9 °C | 115.4 mm | 3.6 mm | — | — |
| February | 36.1 °C | 27.2 °C | 17.2 °C | 28.6 °C | 20.9 °C | 14.4 °C | 21.0 °C | 15.4 °C | 9.7 °C | 85.1 mm | 4.6 mm | — | — |
| March | 36.0 °C | 26.5 °C | 19.3 °C | 27.1 °C | 20.8 °C | 15.2 °C | 21.0 °C | 16.0 °C | 10.0 °C | 173.0 mm | 6.0 mm | — | — |
| April | 35.0 °C | 27.0 °C | 18.9 °C | 26.8 °C | 20.8 °C | 15.6 °C | 21.7 °C | 15.2 °C | 6.1 °C | 120.0 mm | 1.9 mm | — | — |
| May | 34.0 °C | 27.1 °C | 20.6 °C | 26.0 °C | 19.7 °C | 13.7 °C | 20.5 °C | 12.5 °C | 5.0 °C | 26.9 mm | 0.2 mm | — | — |
| June | 31.1 °C | 26.0 °C | 20.0 °C | 25.2 °C | 17.8 °C | 8.9 °C | 16.1 °C | 9.9 °C | 2.8 °C | 5.2 mm | 0.0 mm | — | — |
| July | 31.4 °C | 26.5 °C | 20.3 °C | 24.8 °C | 18.0 °C | 11.2 °C | 16.4 °C | 9.9 °C | 2.8 °C | 0.8 mm | 0.0 mm | — | — |
| August | 34.1 °C | 29.2 °C | 21.1 °C | 27.9 °C | 20.4 °C | 12.8 °C | 18.6 °C | 12.2 °C | 5.0 °C | 3.5 mm | 0.0 mm | — | — |
| September | 36.4 °C | 31.8 °C | 23.9 °C | 29.4 °C | 22.9 °C | 15.0 °C | 20.2 °C | 14.6 °C | 7.8 °C | 42.6 mm | 0.2 mm | — | — |
| October | 38.9 °C | 31.9 °C | 22.0 °C | 30.8 °C | 23.6 °C | 16.5 °C | 21.6 °C | 16.1 °C | 8.9 °C | 99.3 mm | 0.9 mm | — | — |
| November | 37.6 °C | 30.0 °C | 20.0 °C | 28.8 °C | 22.5 °C | 15.8 °C | 21.1 °C | 16.1 °C | 8.9 °C | 211.8 mm | 3.4 mm | — | — |
| December | 37.2 °C | 28.7 °C | 19.1 °C | 29.0 °C | 21.7 °C | 15.2 °C | 20.4 °C | 15.7 °C | 8.9 °C | 176.9 mm | 3.3 mm | — | — |
Data Visualisations
Remove WatermarksCurrent Year Climate Trends vs Historical


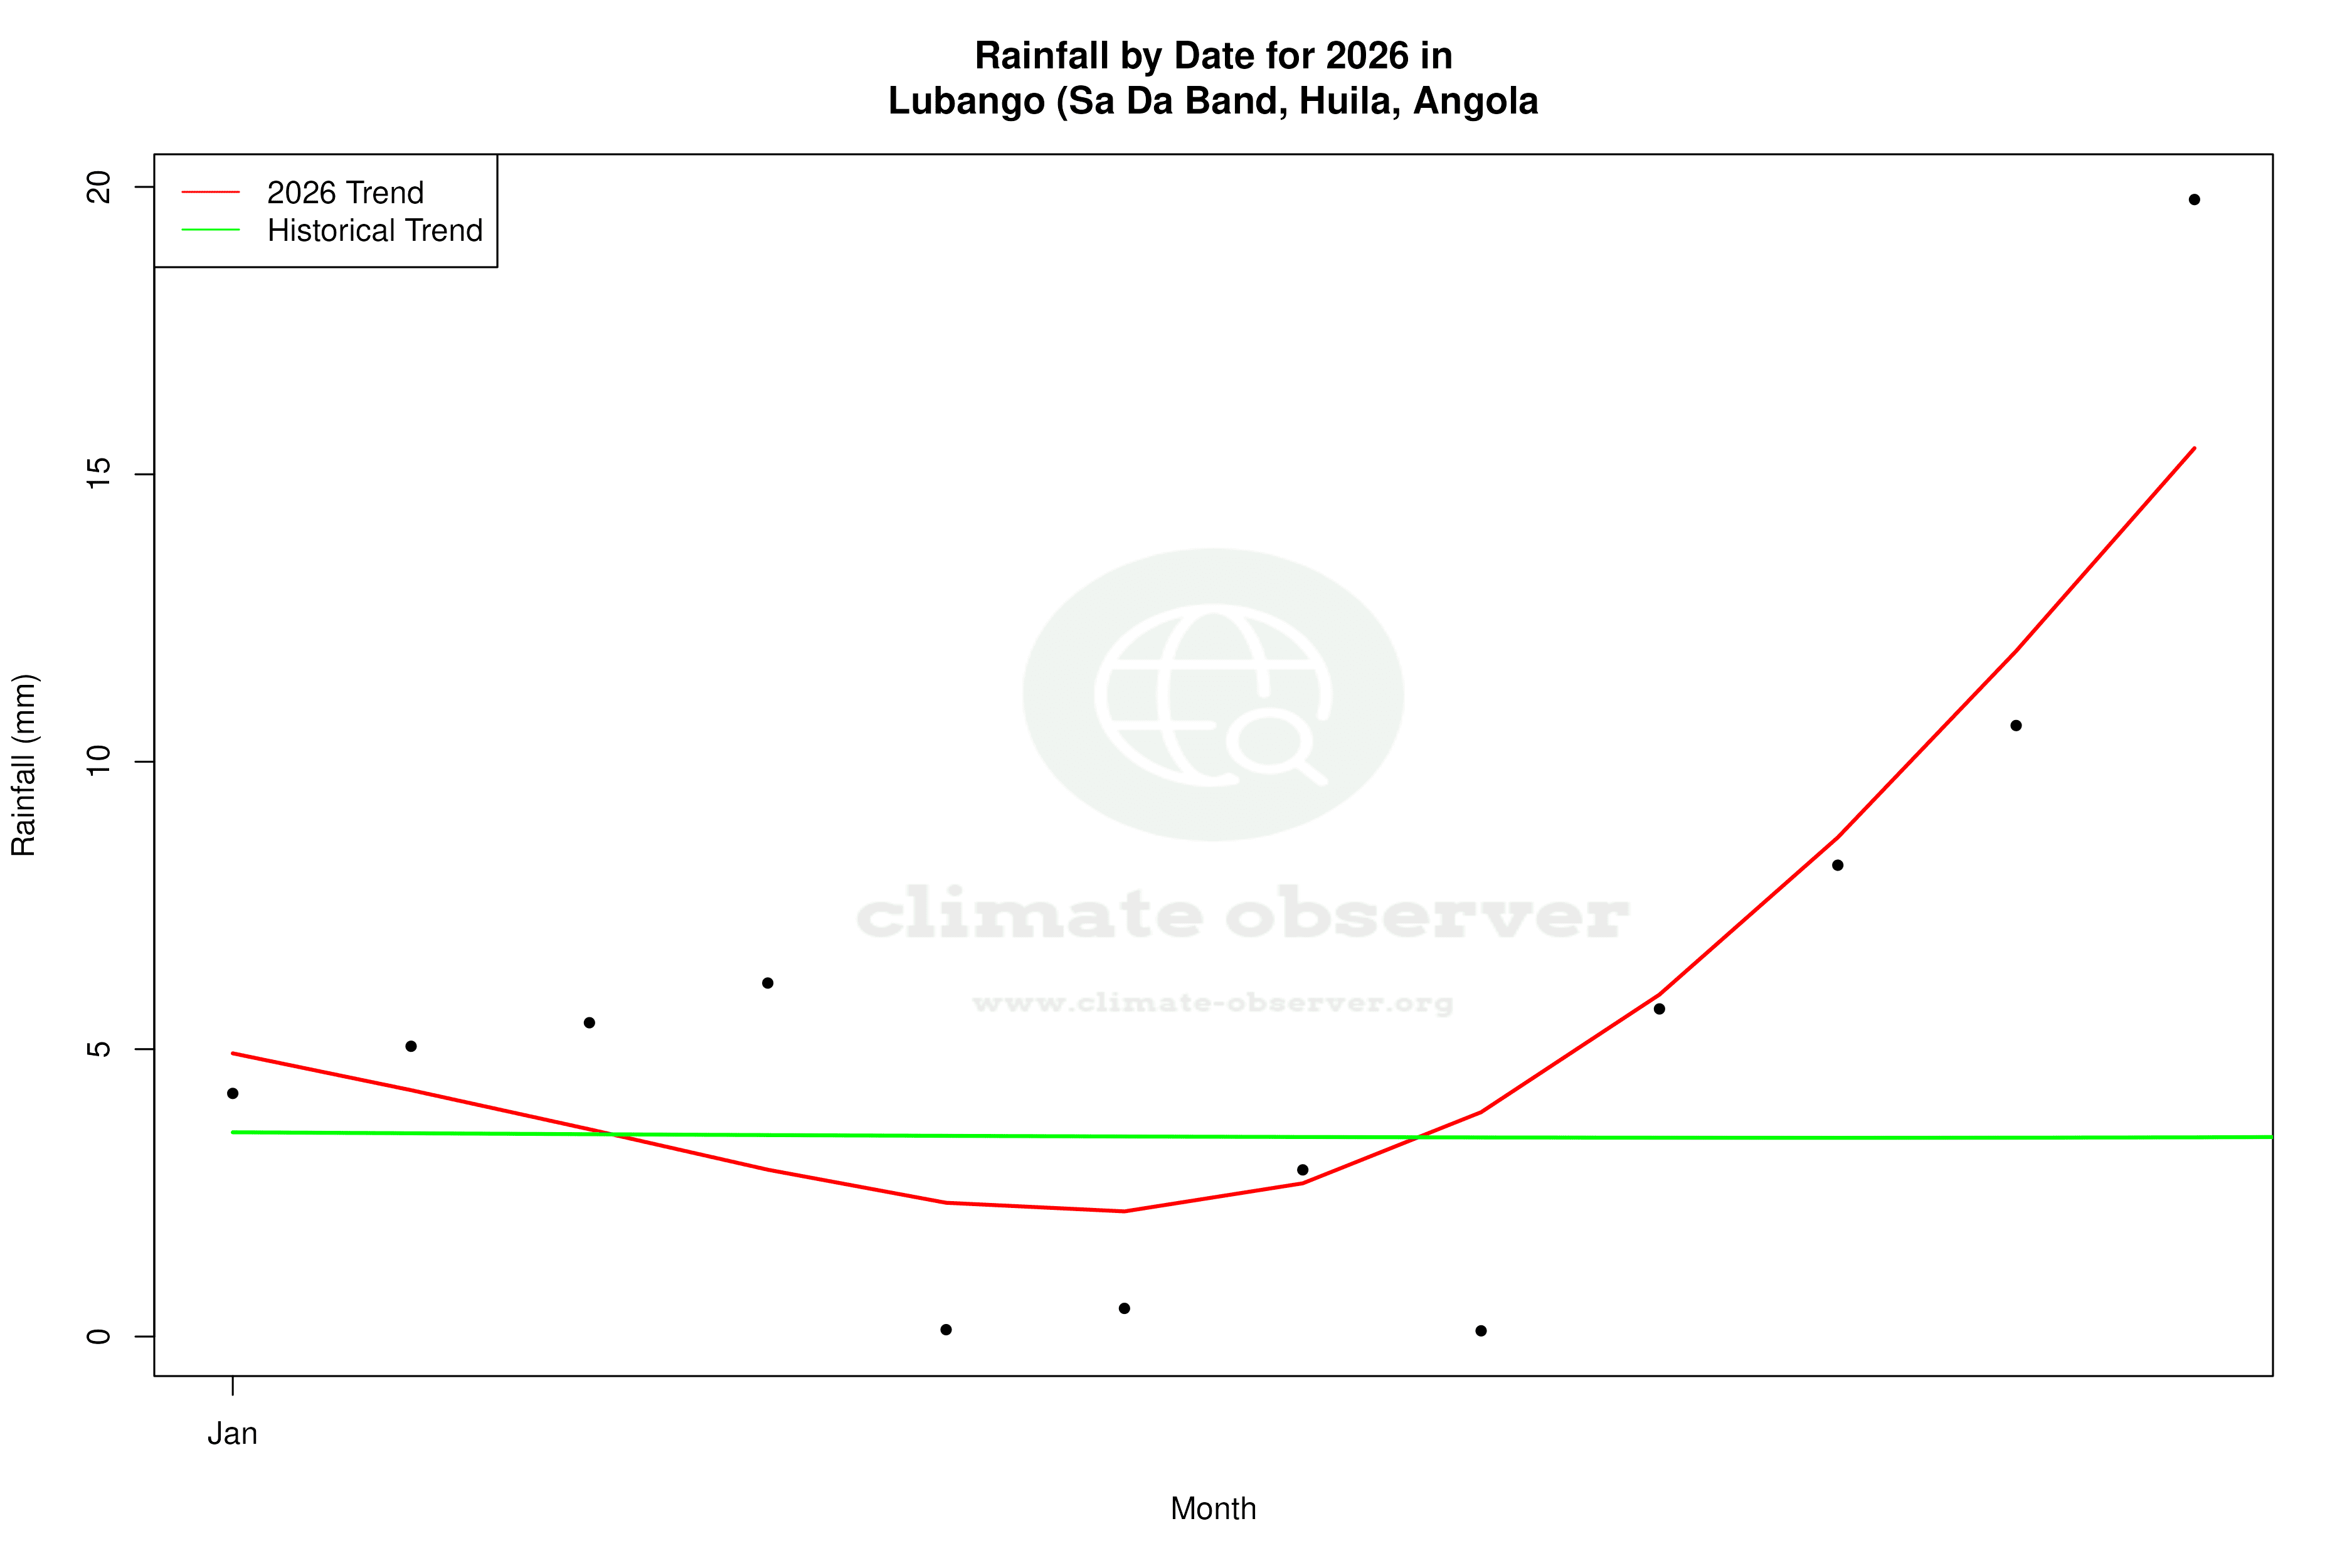


Max Temperature this Year | 1 of 6
Climate 12-Month Moving Averages
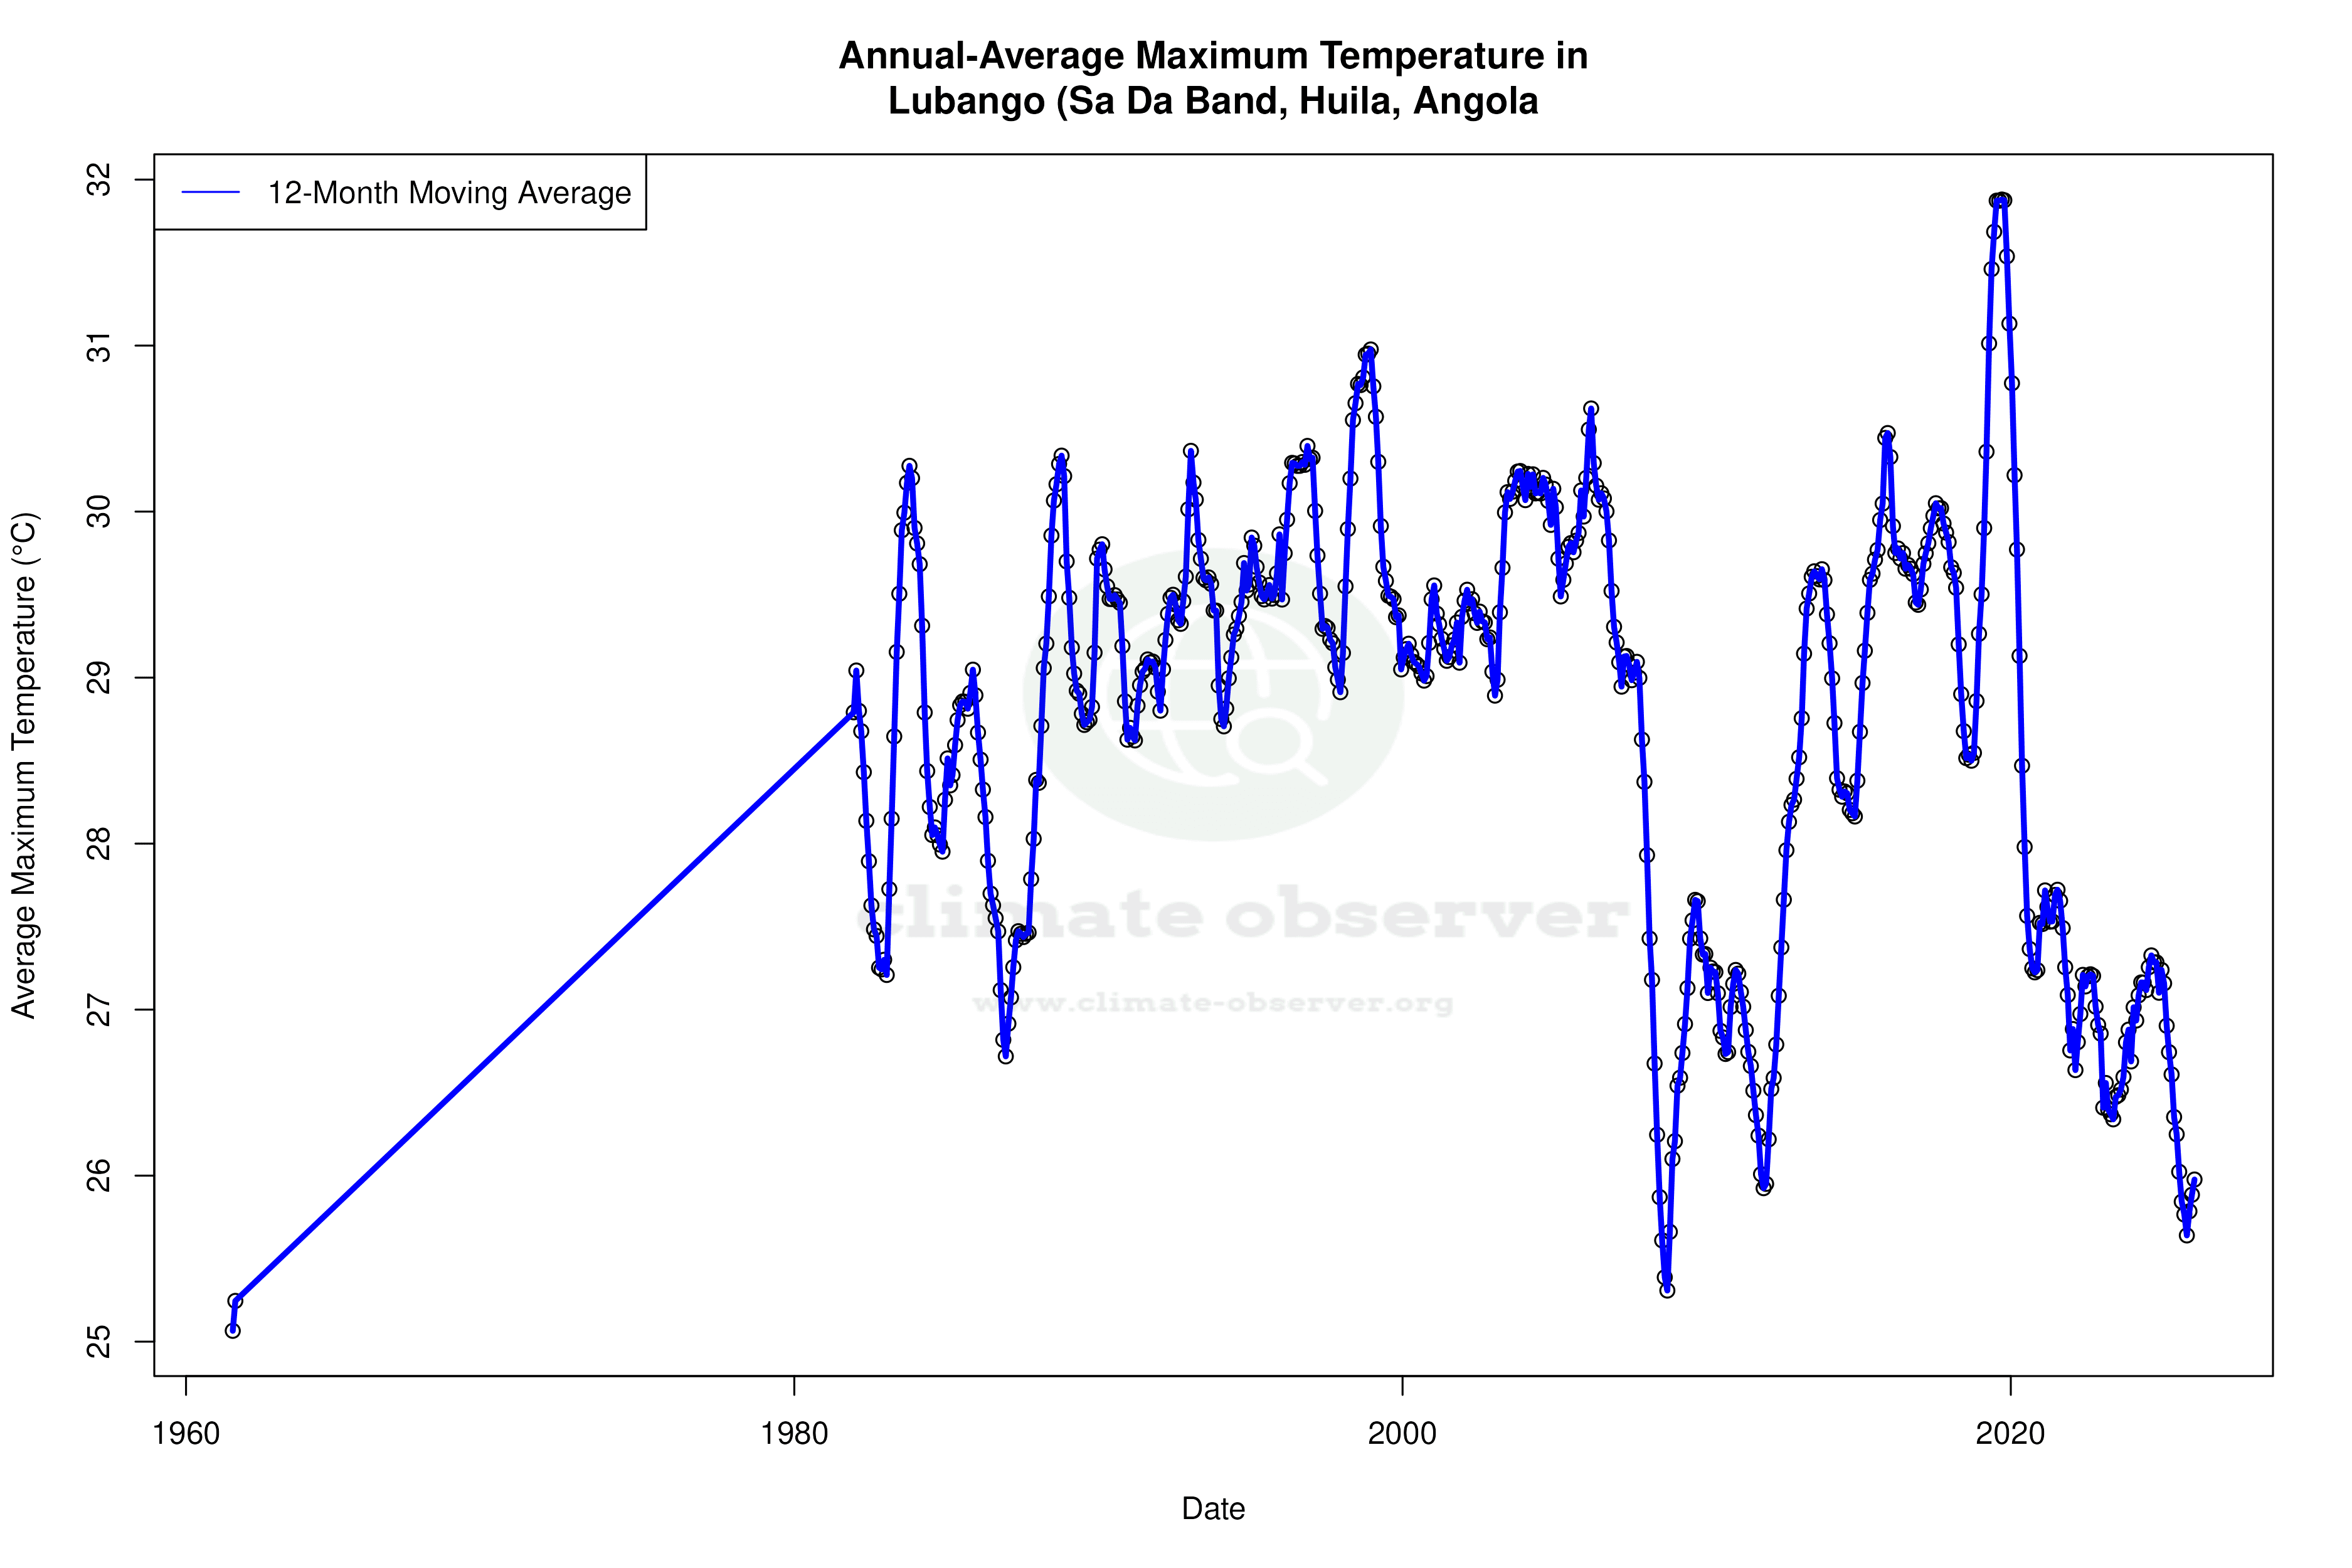


Max Temperature 12-Month MA | 1 of 6
Daily Data Points and Averages Throughout the Year


Average Max Temperature Throughout Year | 1 of 5
