Climate for Station: Mavinga, Cuando Cubango, Angola
Loading live weather...
Climate Analysis & Overview
Mavinga, located in the heart of Angola's Cuando Cubango province, is experiencing a warming trend with significant shifts in precipitation distribution. Over the last decade, high temperatures have increased by 1.39°C (2.50°F), while the Precipitation Concentration Index (PCI) has decreased, indicating a more even distribution of rainfall.
Köppen Climate Context
Mavinga falls under the Köppen climate classification of Aw, which signifies a tropical savanna climate with a distinct wet and dry season. The region's geography, characterised by expansive savannas and proximity to the Cuando River, influences its climate patterns. These features contribute to the area's seasonal rainfall variability and temperature fluctuations.
Temperature Trends: A Decade of Change
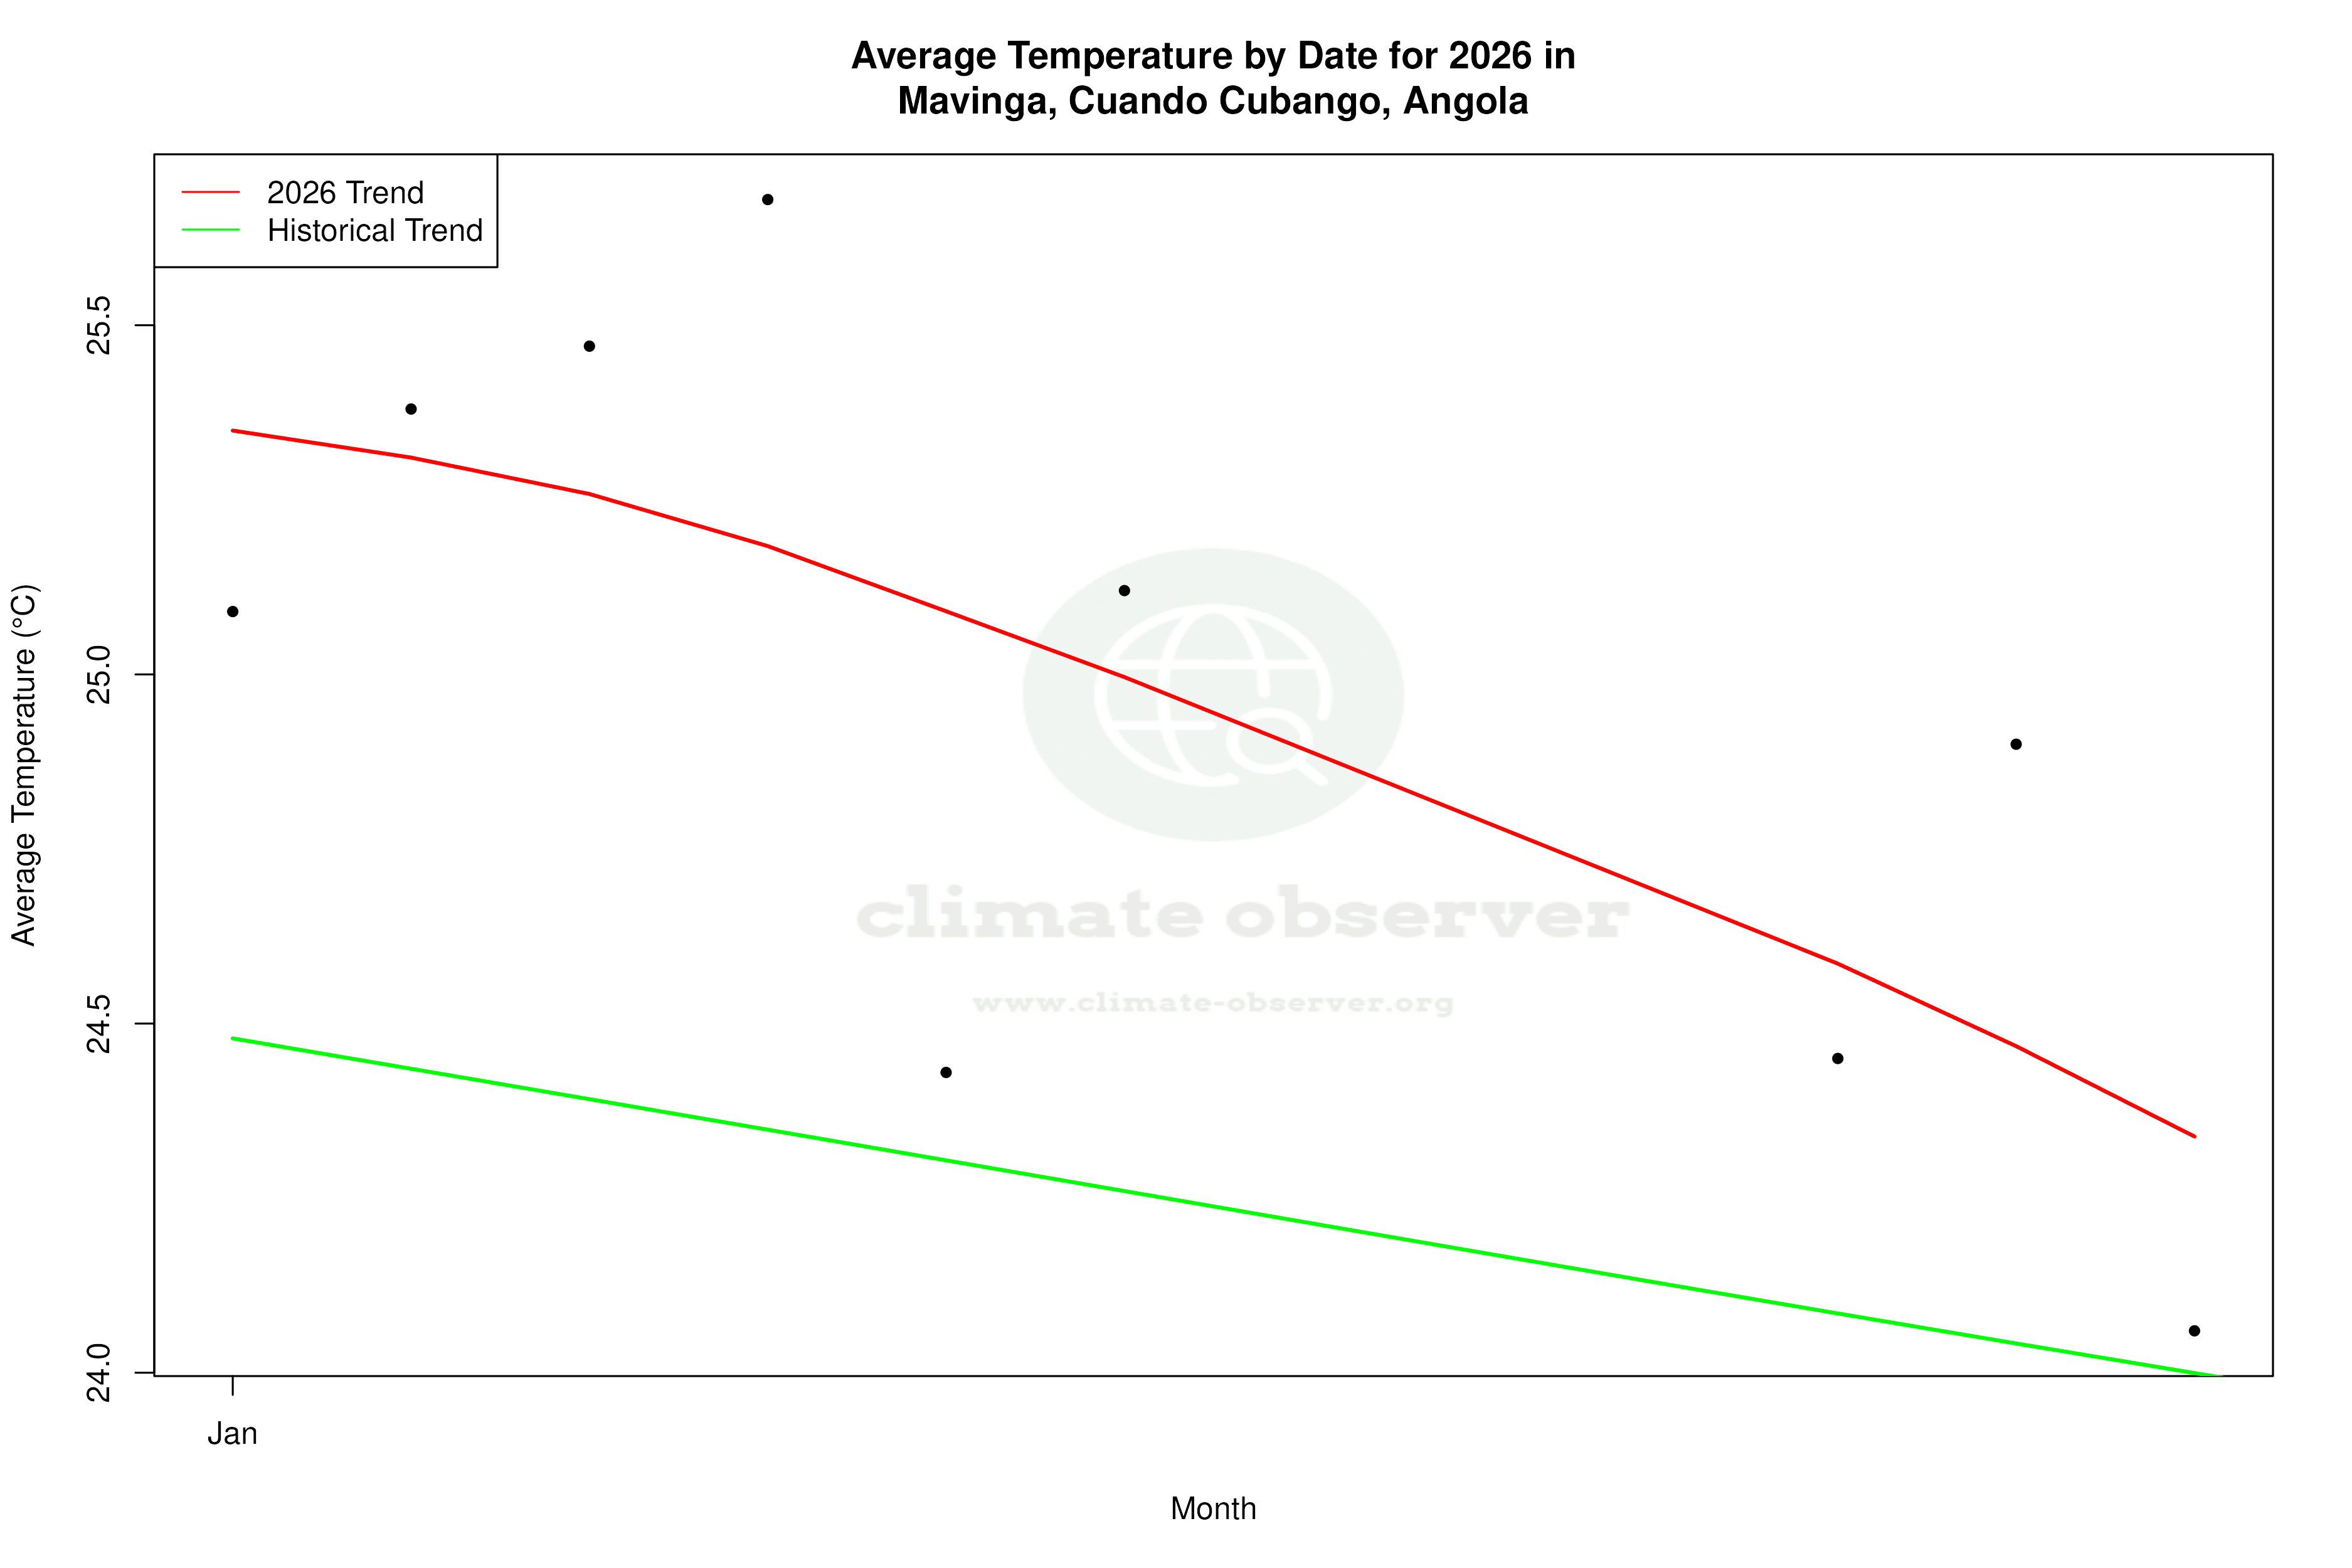
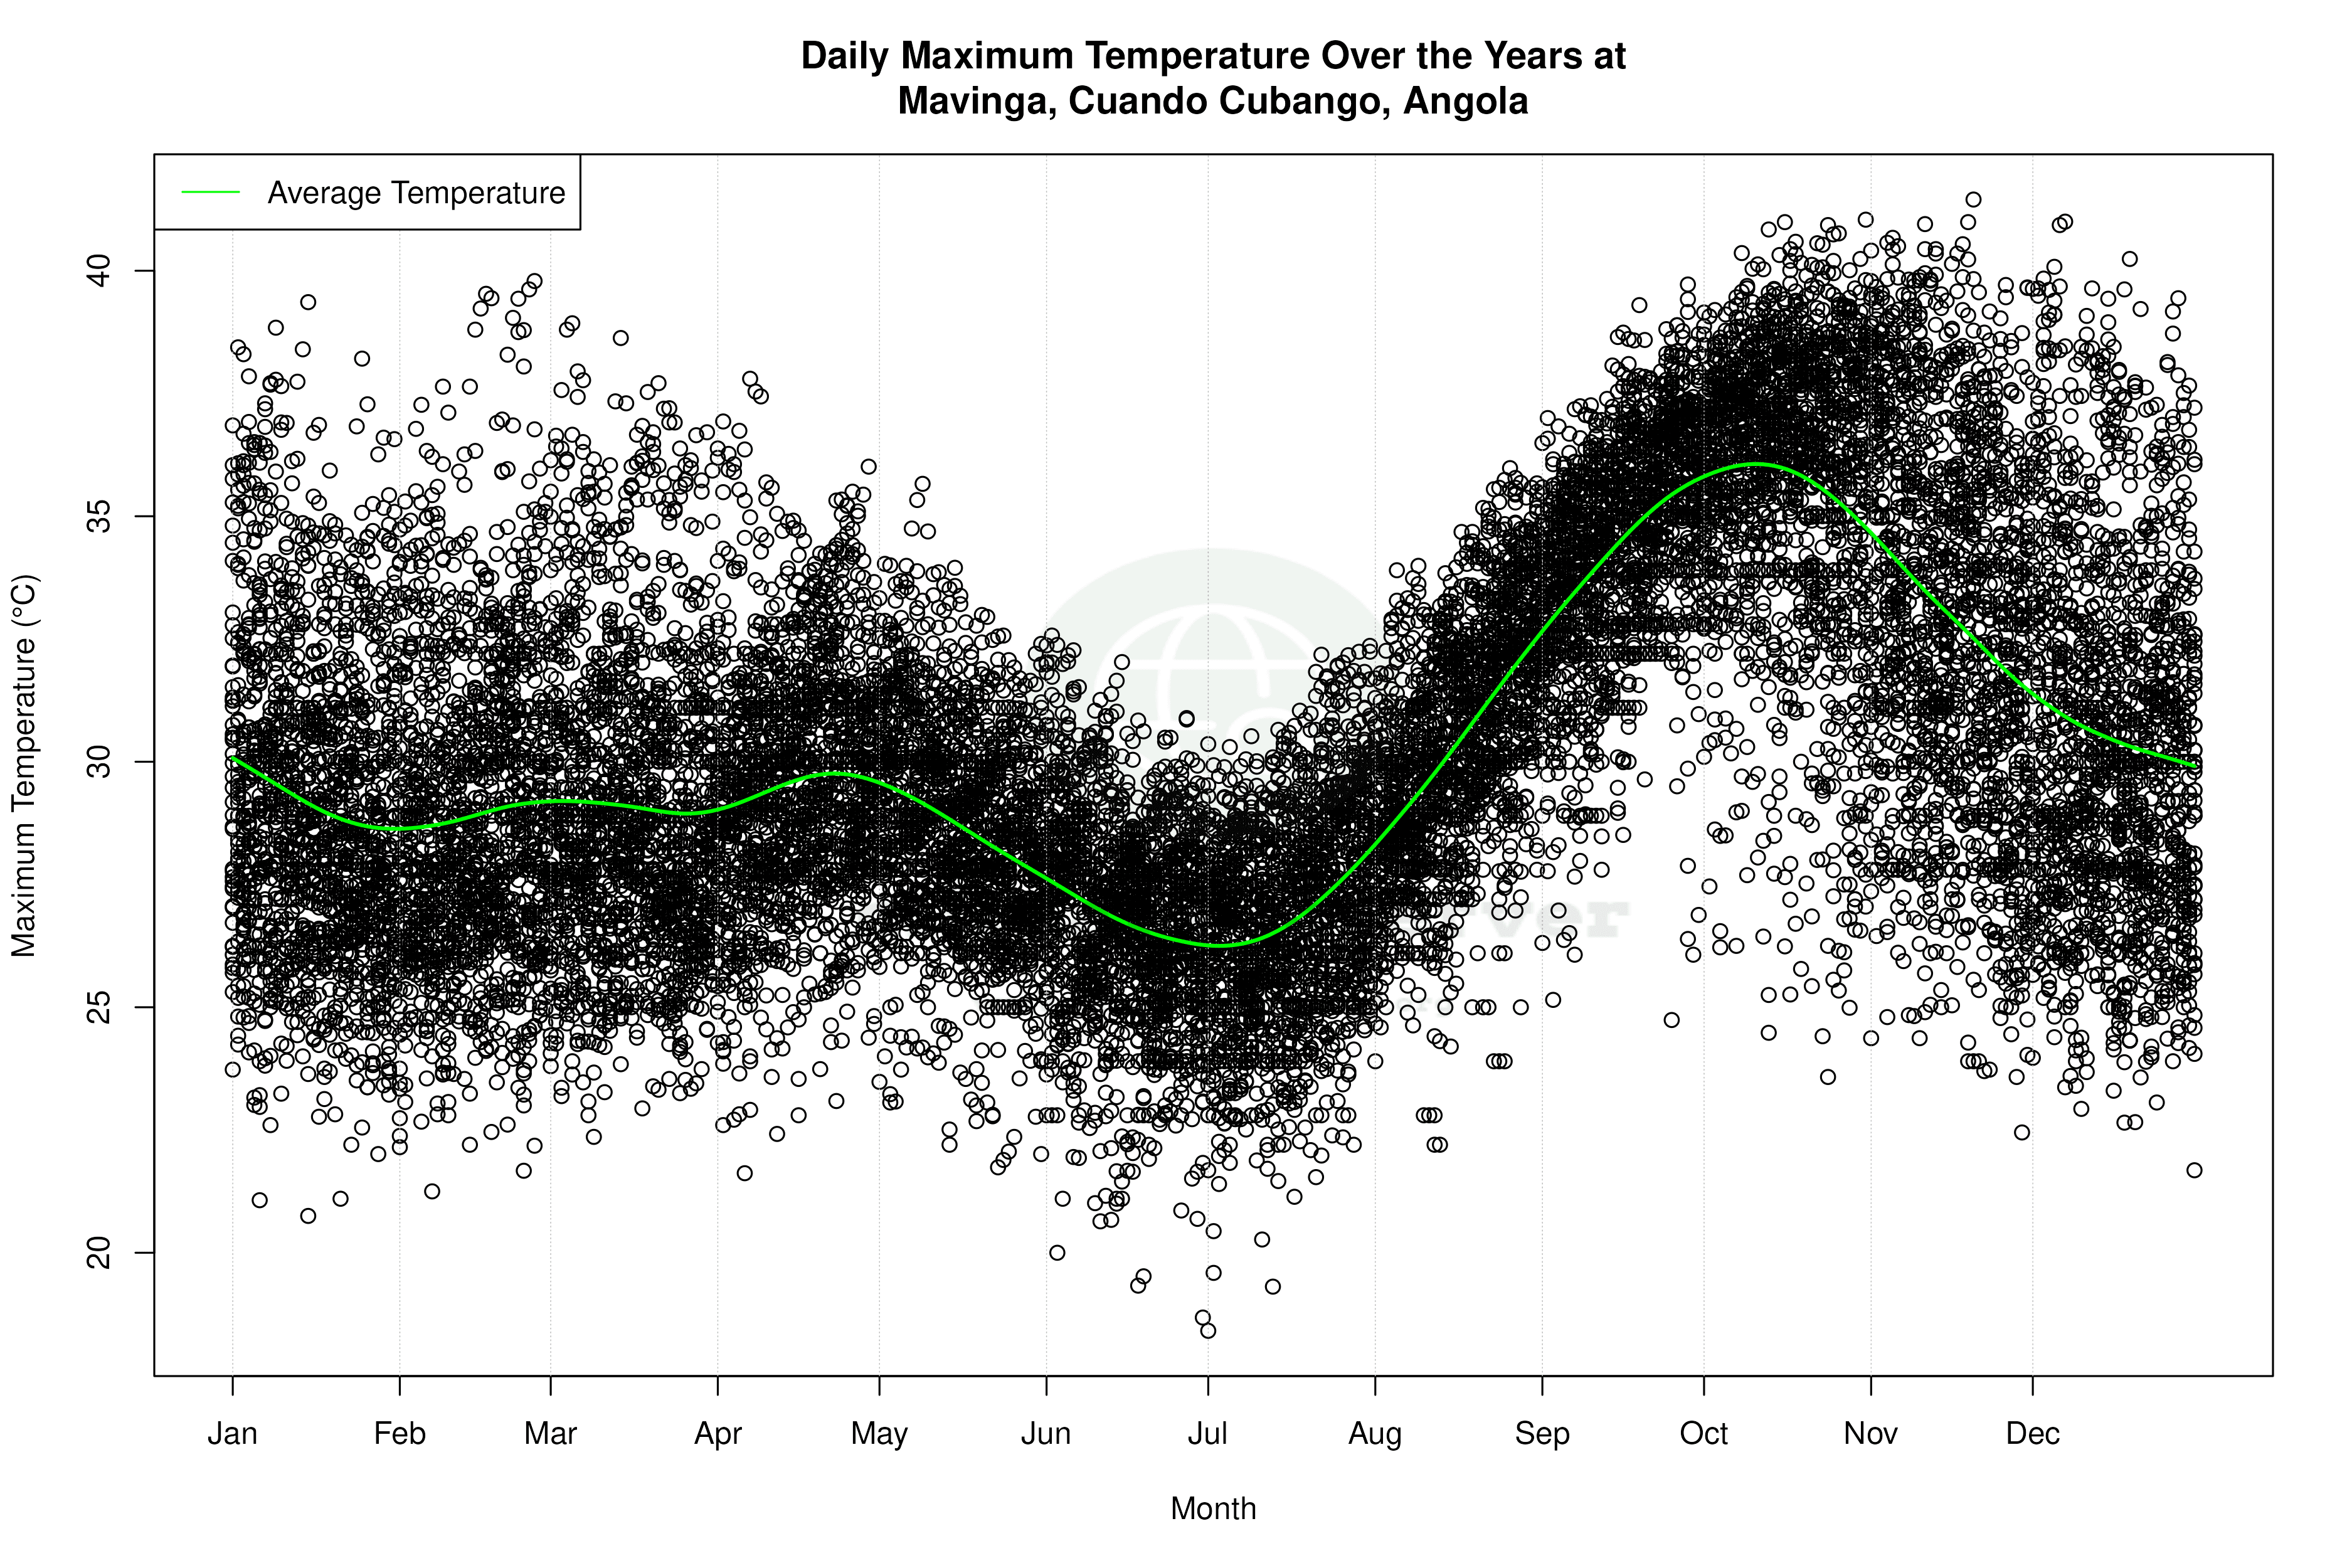
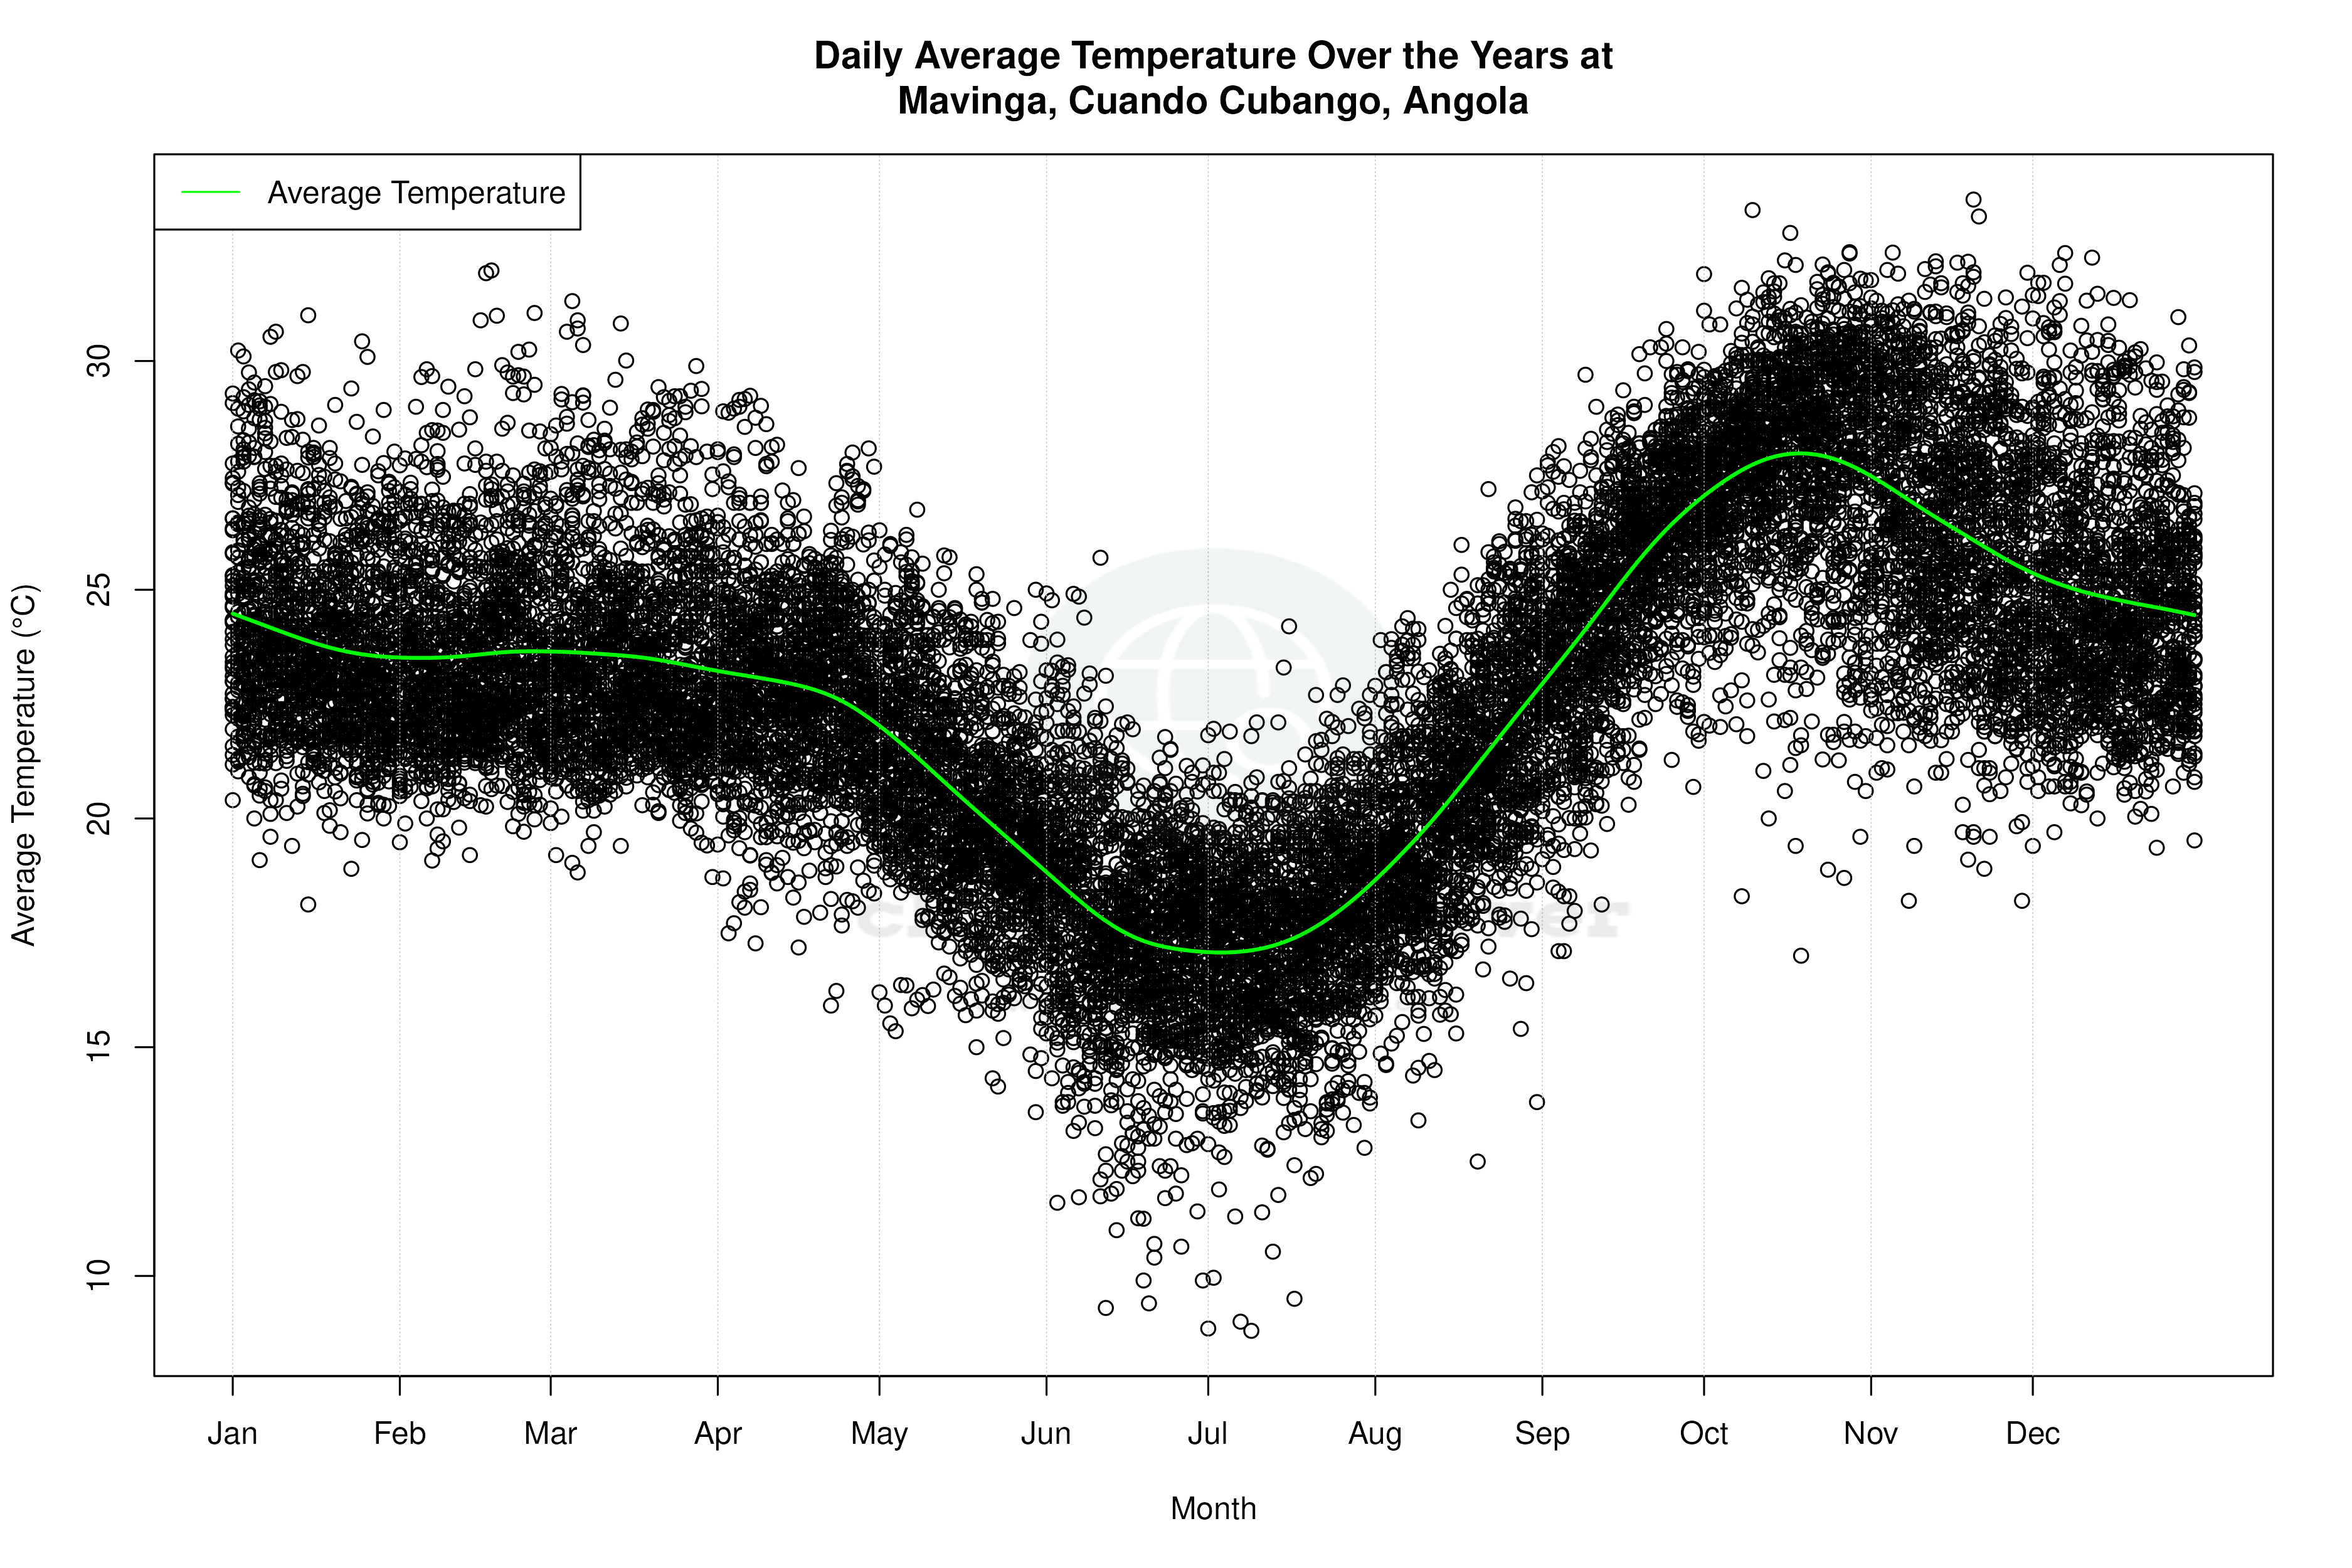
Over the past ten years, Mavinga has experienced a notable warming trend. High temperatures have risen by 1.39°C (2.50°F), and low temperatures have increased by 0.82°C (1.47°F). This recent trend is more pronounced compared to the historical all-time trends, where highs have risen by only 0.19°C (0.34°F) and lows by 0.16°C (0.29°F). The recent decade's accelerated warming may reflect broader regional climate shifts or localised environmental changes.
Precipitation Patterns: A Shift Toward Evenness
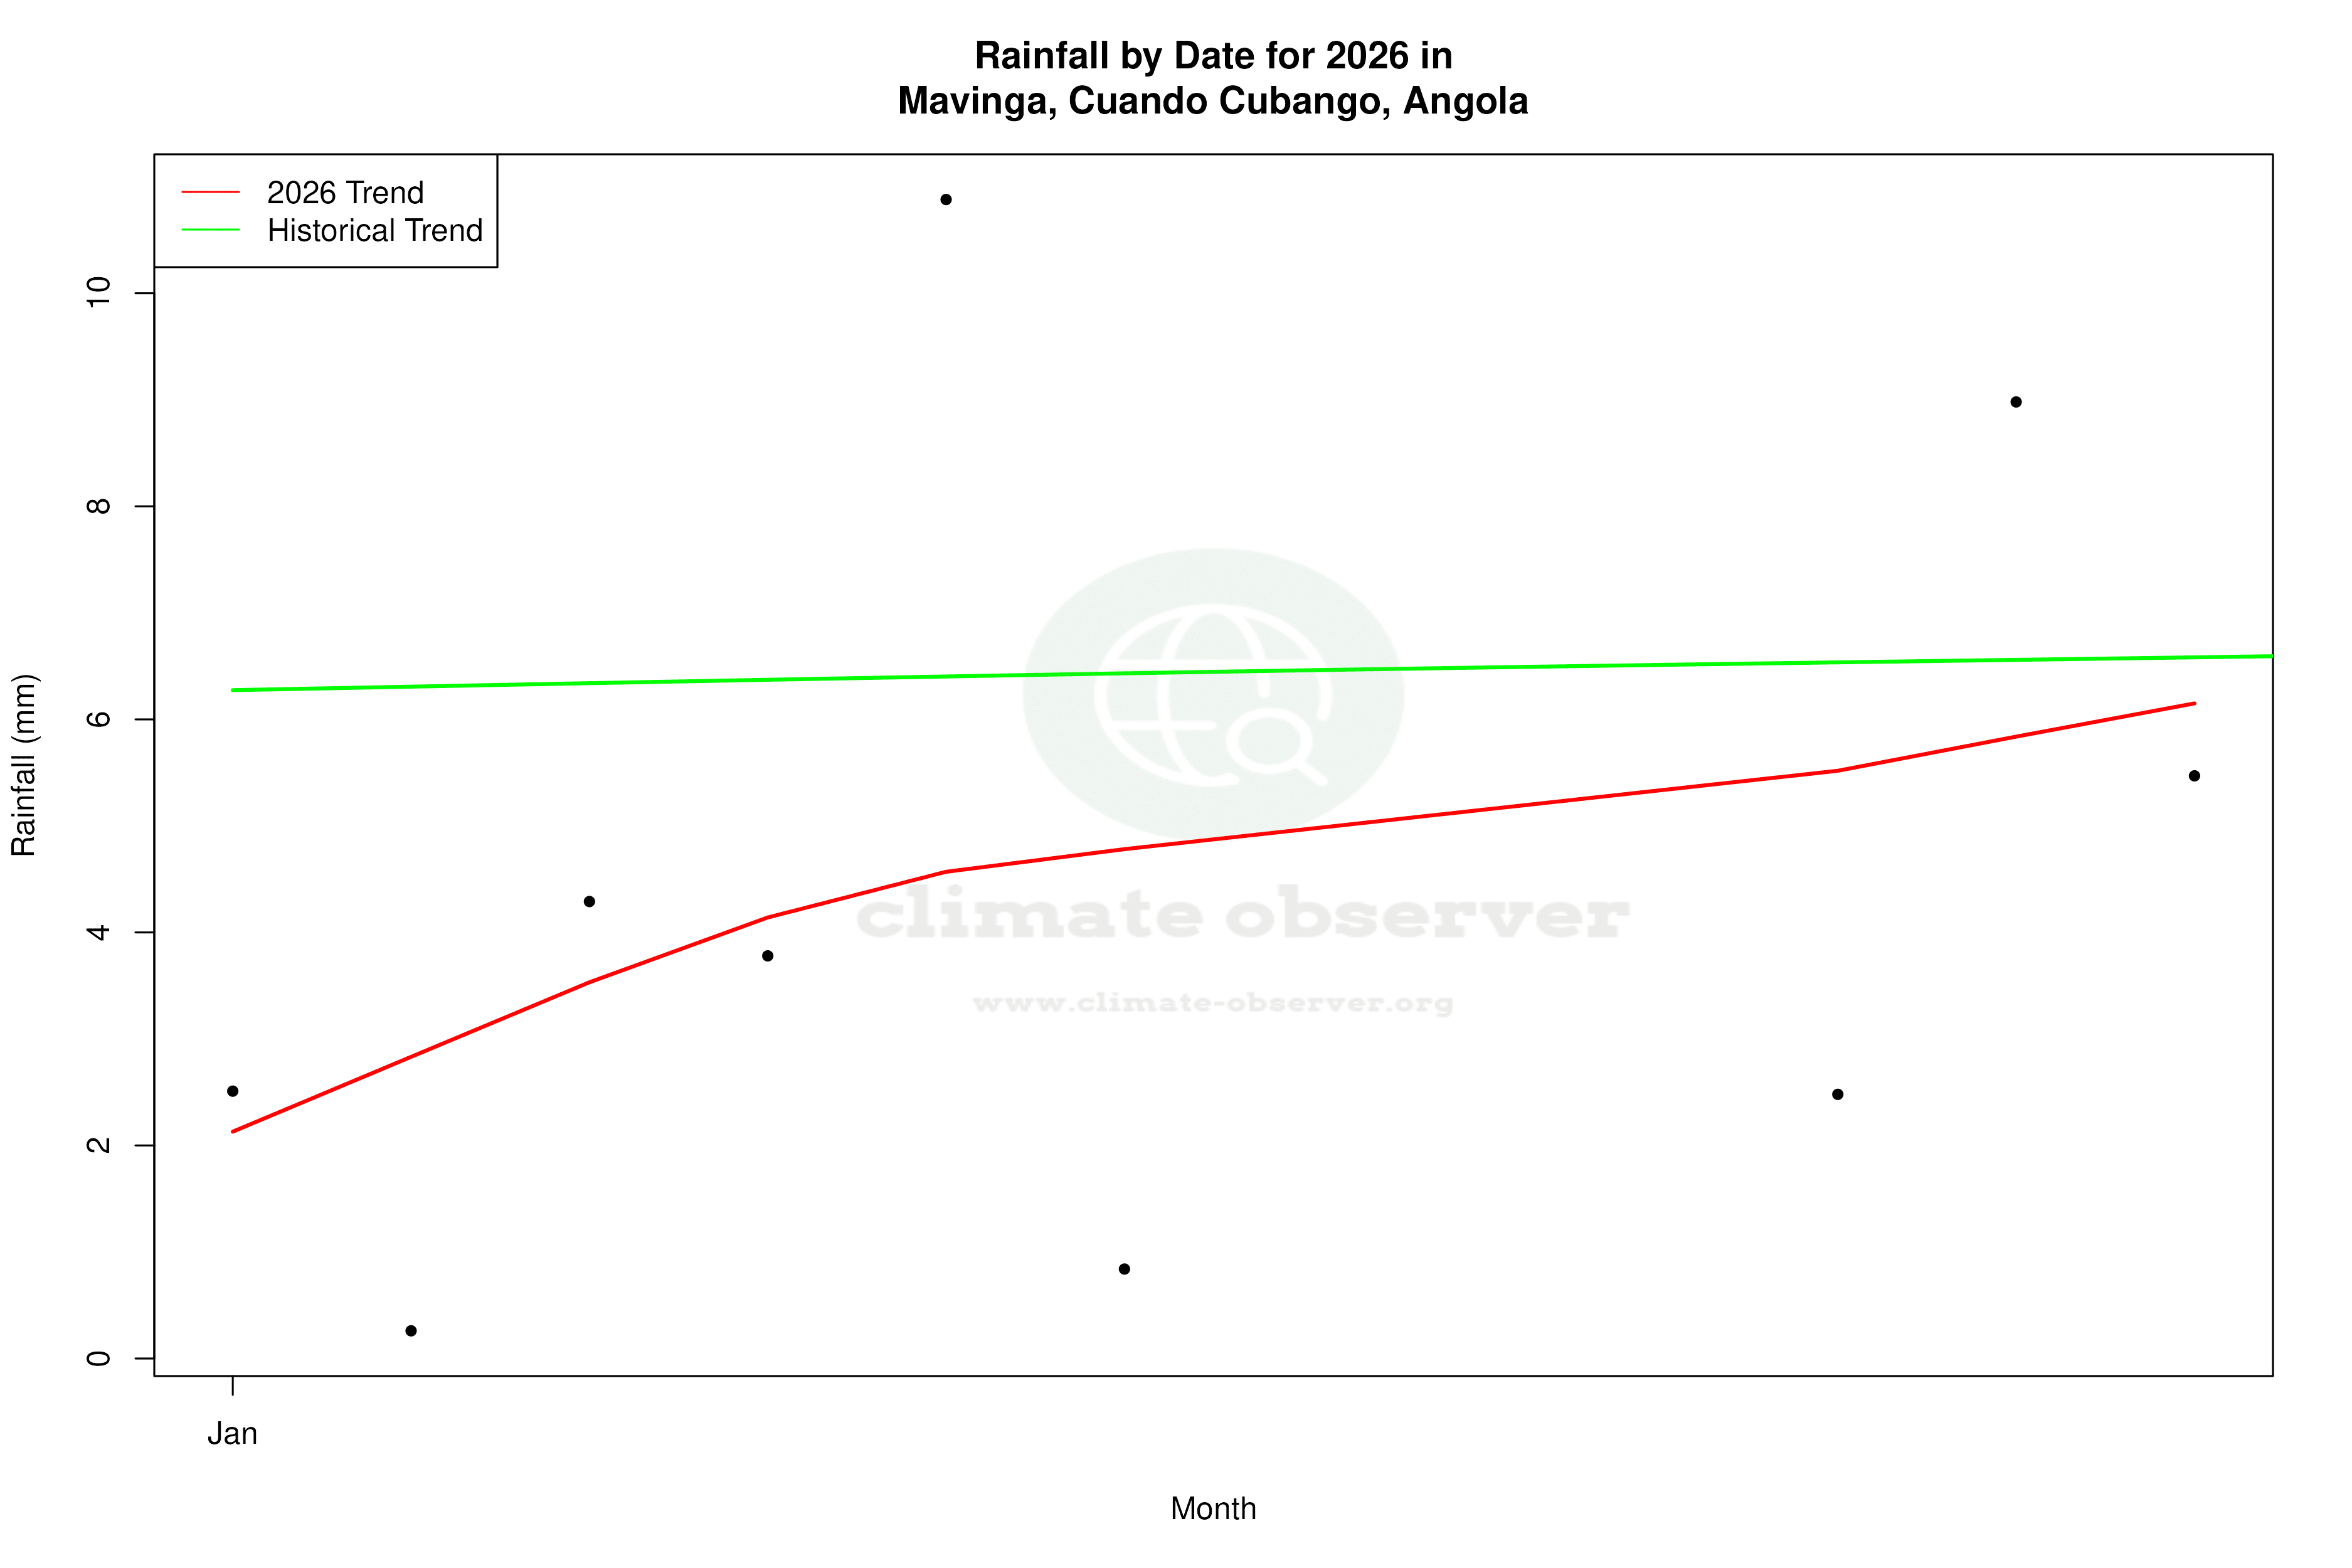
The Precipitation Concentration Index (PCI) for Mavinga has shown a significant decrease from a baseline of 22.7 to a current value of 18.4. This suggests that rainfall is becoming more evenly distributed throughout the year, a shift from previously concentrated rainfall events. A PCI value over 20 indicates highly concentrated precipitation, so this change could impact agricultural practices and water resource management, aligning with Angola's regional climate adaptation goals.
Record Extremes: Temperature Benchmarks
Mavinga's climate extremes are marked by a record high temperature of 41.45°C (106.61°F) and a record low of -3.9°C (25.0°F). These records highlight the potential for significant thermal oscillations in the region, which can pose challenges for infrastructure and health.
Regional Climate Implications
The observed warming trends and changes in precipitation distribution in Mavinga are reflective of broader climate dynamics in Angola. As the country aims to enhance its climate resilience, understanding these localised changes is crucial. Recent weather events, such as prolonged dry spells or intense rainfall, underscore the importance of adaptive strategies to mitigate climate impacts on agriculture and water resources.
Station Statistics
10-Year Trend
High: +1.49 °C/decade
Low: +0.91 °C/decade
Rain: -0.47 mm/decade
25-Year Trend
High: +0.31 °C/decade
Low: +0.34 °C/decade
Rain: -0.05 mm/decade
50-Year Trend
High: +0.19 °C/decade
Low: +0.17 °C/decade
Rain: -0.06 mm/decade
All-Time Trend
High: +0.19 °C/decade
Low: +0.17 °C/decade
Rain: -0.07 mm/decade
Percentage Above-Average Days
Last 12 Months: 46.0%
This Year: 65.8%
Precipitation Concentration Index (PCI) ℹ️
Last 12 Months: 19.1
Historical Average: 21.9
Percentile Rank of Last 12 Months ℹ️
High: 75th percentile
Low: 89th percentile
Rain: 40th percentile
Change in Variance ℹ️
High: +10.7%
Low: -7.7%
Intraday: -13.3%
Data Coverage
79.9%
First Year of Data
1957
Station Location
Historical Weather Records
| Max High | Avg High | Min High | Max Avg | Avg Avg | Min Avg | Max Low | Avg Low | Min Low | Max Precipitation | Avg Precipitation | Max Snow | Avg Snow | |
|---|---|---|---|---|---|---|---|---|---|---|---|---|---|
| Record | 41.5 °C | — | 18.4 °C | 33.5 °C | — | 8.8 °C | 26.5 °C | — | -3.9 °C | 89.9 mm | — | — | — |
| January | 39.4 °C | 29.2 °C | 20.8 °C | 31.0 °C | 23.9 °C | 18.1 °C | 23.5 °C | 18.9 °C | 15.0 °C | 89.9 mm | 6.8 mm | — | — |
| February | 39.8 °C | 28.9 °C | 21.3 °C | 32.0 °C | 23.6 °C | 19.1 °C | 26.1 °C | 18.6 °C | 12.8 °C | 89.9 mm | 5.8 mm | — | — |
| March | 38.9 °C | 29.1 °C | 22.4 °C | 31.3 °C | 23.5 °C | 18.7 °C | 24.6 °C | 18.3 °C | 11.1 °C | 70.1 mm | 4.2 mm | — | — |
| April | 37.8 °C | 29.6 °C | 21.6 °C | 29.2 °C | 22.9 °C | 15.9 °C | 23.4 °C | 16.2 °C | 7.2 °C | 80.0 mm | 1.1 mm | — | — |
| May | 35.7 °C | 28.7 °C | 21.7 °C | 26.8 °C | 20.5 °C | 13.6 °C | 21.1 °C | 12.7 °C | 1.0 °C | 19.1 mm | 0.1 mm | — | — |
| June | 32.6 °C | 26.9 °C | 18.7 °C | 25.7 °C | 17.7 °C | 9.3 °C | 19.4 °C | 9.7 °C | -3.9 °C | 8.1 mm | 0.0 mm | — | — |
| July | 32.4 °C | 26.9 °C | 18.4 °C | 24.2 °C | 17.5 °C | 8.8 °C | 16.3 °C | 8.8 °C | 1.1 °C | 0.5 mm | 0.0 mm | — | — |
| August | 36.0 °C | 30.4 °C | 22.2 °C | 27.5 °C | 20.7 °C | 12.5 °C | 20.4 °C | 11.6 °C | 1.1 °C | 7.9 mm | 0.0 mm | — | — |
| September | 39.7 °C | 34.4 °C | 24.7 °C | 30.7 °C | 25.1 °C | 17.1 °C | 24.5 °C | 15.9 °C | 7.2 °C | 19.0 mm | 0.1 mm | — | — |
| October | 41.0 °C | 35.7 °C | 23.6 °C | 33.3 °C | 27.7 °C | 17.0 °C | 26.0 °C | 19.9 °C | 12.2 °C | 28.1 mm | 0.6 mm | — | — |
| November | 41.5 °C | 33.0 °C | 22.4 °C | 33.5 °C | 26.4 °C | 18.2 °C | 26.5 °C | 20.2 °C | 11.1 °C | 70.1 mm | 2.7 mm | — | — |
| December | 41.0 °C | 30.6 °C | 21.7 °C | 32.4 °C | 24.9 °C | 19.4 °C | 25.6 °C | 19.5 °C | 14.8 °C | 80.0 mm | 5.3 mm | — | — |
Data Visualisations
Remove WatermarksCurrent Year Climate Trends vs Historical
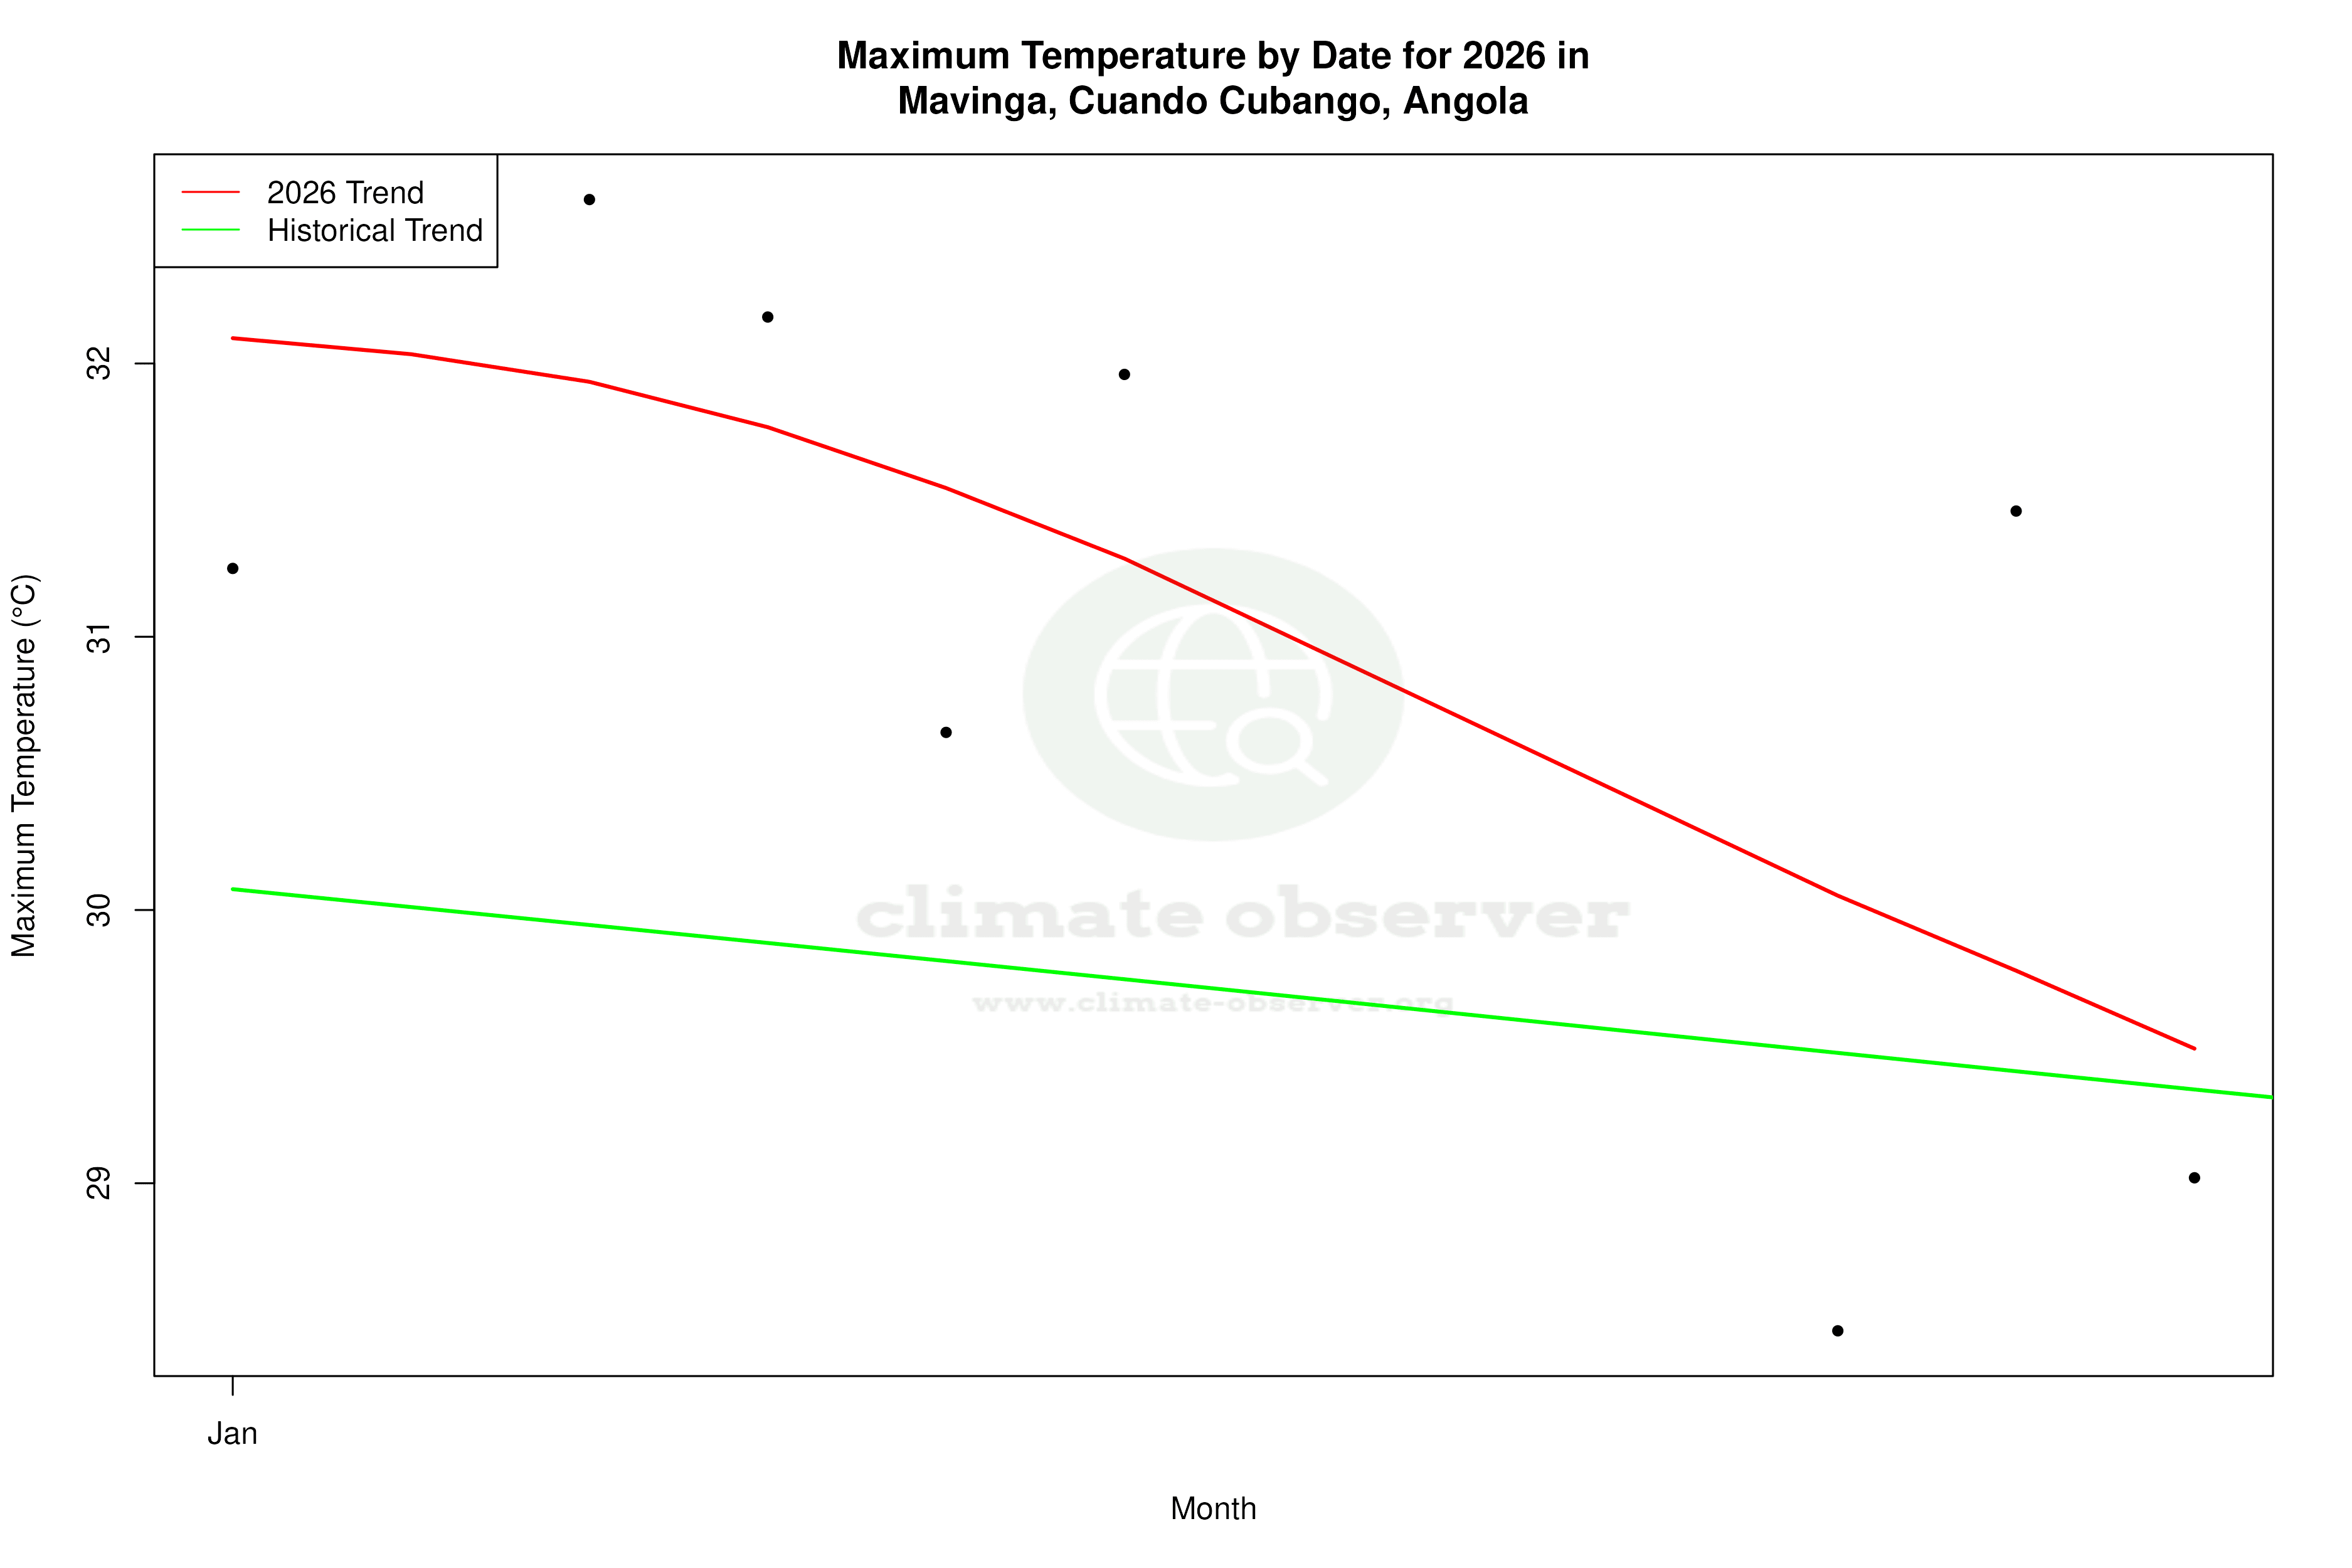
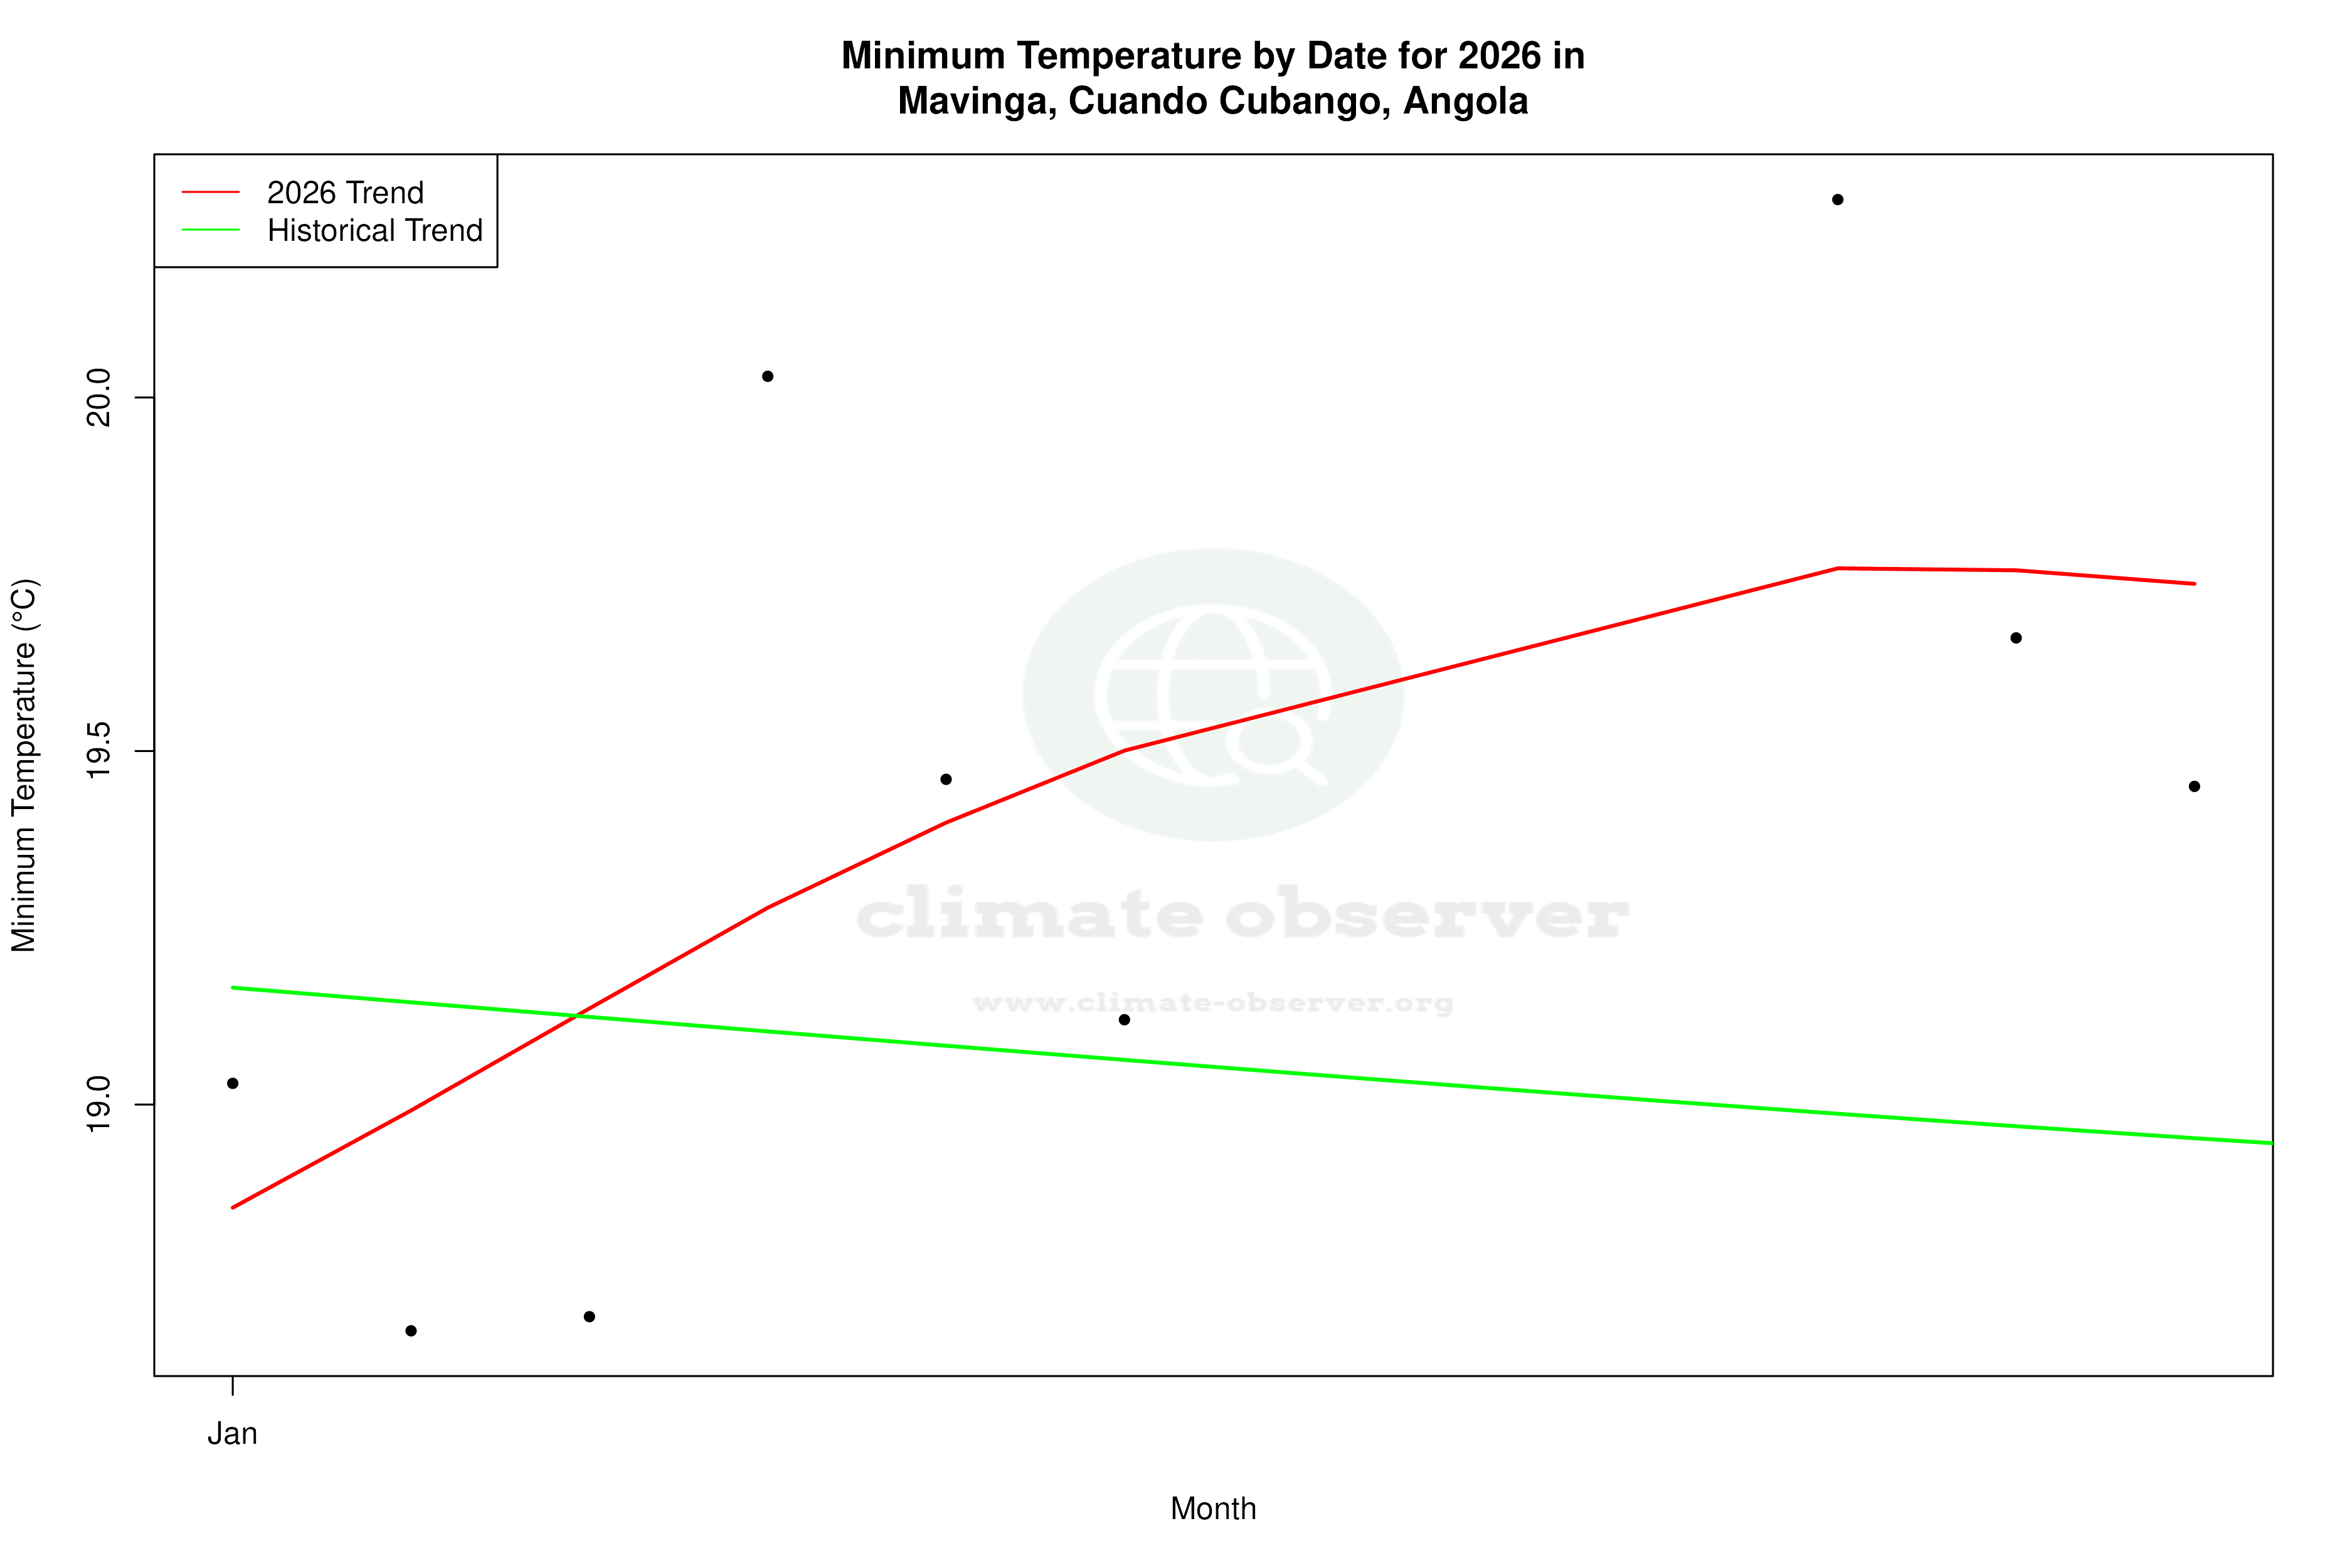


Max Temperature this Year | 1 of 6
Climate 12-Month Moving Averages


Max Temperature 12-Month MA | 1 of 6
Daily Data Points and Averages Throughout the Year


Average Max Temperature Throughout Year | 1 of 5
