Climate for Station: Santa Rosa Aero, La Pampa, Argentina
Loading live weather...
Climate Analysis & Overview
Santa Rosa Aero in La Pampa, Argentina, is experiencing a warming trend, with significant increases in both high and low temperatures over the past decade. The precipitation is becoming slightly more evenly distributed, which may influence local agricultural practices. The region's climate goals may need to adapt to these changes.
Warming Trends in La Pampa
Santa Rosa Aero, located at -36.567, -64.266, sits within the temperate climate zone of Argentina, classified under the Köppen system as Cfa—humid subtropical with hot summers. Over the past decade, the station has recorded a significant warming trend, with high temperatures increasing by 0.89°C (1.60°F) and low temperatures by 0.37°C (0.67°F). This is more pronounced than the all-time trends, which show a rise of 0.33°C (0.60°F) for highs and 0.20°C (0.36°F) for lows. These changes suggest an acceleration in warming, which could impact local ecosystems and agriculture, particularly in a region that relies heavily on its temperate climate for crop production.
Temperature Extremes and Records
Santa Rosa Aero has recorded extreme temperatures, with an all-time high of 45.7°C (114.3°F) and a low of -12.7°C (9.1°F). These extremes highlight the variability in the region's climate, which can challenge both infrastructure and agriculture. The warming trends noted may lead to more frequent occurrences of such extremes, necessitating adaptive measures in local planning and resource management.
Precipitation Patterns and Changes
The Precipitation Concentration Index (PCI) for Santa Rosa Aero has seen a slight decrease from a baseline of 14.56 to a current value of 13.90. The PCI measures how precipitation is distributed over time, with higher values indicating more concentrated rainfall in fewer events. This marginal decrease suggests that rainfall is becoming slightly more evenly distributed, which could benefit agricultural activities by reducing the risk of droughts and floods. However, the region must remain vigilant as even small changes in precipitation patterns can have significant impacts on water resources and soil health.
Implications for Regional Climate Goals
Argentina's regional climate goals, which focus on sustainable agriculture and water management, may need to be adjusted in light of these warming trends and changing precipitation patterns. The data from Santa Rosa Aero underscores the importance of integrating climate resilience into regional planning. As temperatures rise and precipitation patterns shift, local authorities and stakeholders must consider adaptive strategies to mitigate potential adverse effects on the environment and economy.
Station Statistics
10-Year Trend
High: +0.88 °C/decade
Low: +0.40 °C/decade
Rain: -0.99 mm/decade
25-Year Trend
High: +0.69 °C/decade
Low: +0.16 °C/decade
Rain: -0.06 mm/decade
50-Year Trend
High: +0.60 °C/decade
Low: +0.05 °C/decade
Rain: +0.02 mm/decade
All-Time Trend
High: +0.33 °C/decade
Low: +0.20 °C/decade
Rain: +0.03 mm/decade
Percentage Above-Average Days
Last 12 Months: 50.4%
This Year: 47.5%
Precipitation Concentration Index (PCI) ℹ️
Last 12 Months: 15.8
Historical Average: 15.1
Percentile Rank of Last 12 Months ℹ️
High: 85th percentile
Low: 94th percentile
Rain: 40th percentile
Change in Variance ℹ️
High: +4.8%
Low: +2.7%
Intraday: -27.3%
Data Coverage
84.0%
First Year of Data
1951
Station Location
Historical Weather Records
| Max High | Avg High | Min High | Max Avg | Avg Avg | Min Avg | Max Low | Avg Low | Min Low | Max Precipitation | Avg Precipitation | Max Snow | Avg Snow | |
|---|---|---|---|---|---|---|---|---|---|---|---|---|---|
| Record | 45.7 °C | — | 2.9 °C | 35.5 °C | — | -3.3 °C | 26.7 °C | — | -12.7 °C | 329.9 mm | — | — | — |
| January | 45.7 °C | 32.0 °C | 16.0 °C | 35.5 °C | 24.0 °C | 12.9 °C | 26.7 °C | 16.0 °C | 0.9 °C | 110.0 mm | 3.6 mm | — | — |
| February | 42.6 °C | 30.6 °C | 14.1 °C | 32.6 °C | 22.5 °C | 11.7 °C | 25.8 °C | 14.8 °C | 2.3 °C | 329.9 mm | 3.5 mm | — | — |
| March | 40.7 °C | 27.4 °C | 13.8 °C | 30.1 °C | 19.9 °C | 9.1 °C | 24.4 °C | 12.8 °C | -3.7 °C | 161.7 mm | 3.3 mm | — | — |
| April | 36.5 °C | 22.8 °C | 7.4 °C | 26.3 °C | 15.6 °C | 4.4 °C | 20.4 °C | 8.7 °C | -7.0 °C | 108.3 mm | 2.1 mm | — | — |
| May | 31.8 °C | 18.5 °C | 7.2 °C | 22.8 °C | 11.5 °C | -0.3 °C | 17.9 °C | 5.3 °C | -8.6 °C | 43.9 mm | 1.0 mm | — | — |
| June | 27.1 °C | 15.0 °C | 2.9 °C | 19.2 °C | 8.3 °C | -1.9 °C | 17.0 °C | 2.3 °C | -12.7 °C | 54.1 mm | 0.6 mm | — | — |
| July | 27.8 °C | 14.9 °C | 4.5 °C | 19.2 °C | 7.9 °C | -3.3 °C | 14.8 °C | 1.6 °C | -12.3 °C | 50.0 mm | 0.6 mm | — | — |
| August | 33.9 °C | 17.6 °C | 4.8 °C | 24.3 °C | 10.0 °C | -0.2 °C | 17.6 °C | 2.8 °C | -9.2 °C | 41.9 mm | 0.9 mm | — | — |
| September | 35.2 °C | 20.4 °C | 5.8 °C | 24.0 °C | 12.8 °C | 1.9 °C | 18.0 °C | 5.3 °C | -8.8 °C | 277.7 mm | 1.8 mm | — | — |
| October | 38.8 °C | 23.5 °C | 8.4 °C | 28.4 °C | 16.1 °C | 4.9 °C | 20.3 °C | 8.7 °C | -4.3 °C | 87.9 mm | 3.1 mm | — | — |
| November | 39.9 °C | 27.4 °C | 11.8 °C | 29.2 °C | 19.6 °C | 8.1 °C | 22.0 °C | 12.0 °C | -1.2 °C | 150.1 mm | 3.2 mm | — | — |
| December | 42.8 °C | 30.7 °C | 15.3 °C | 33.1 °C | 22.7 °C | 12.7 °C | 26.4 °C | 14.8 °C | 2.0 °C | 99.1 mm | 3.7 mm | — | — |
Data Visualisations
Remove WatermarksCurrent Year Climate Trends vs Historical


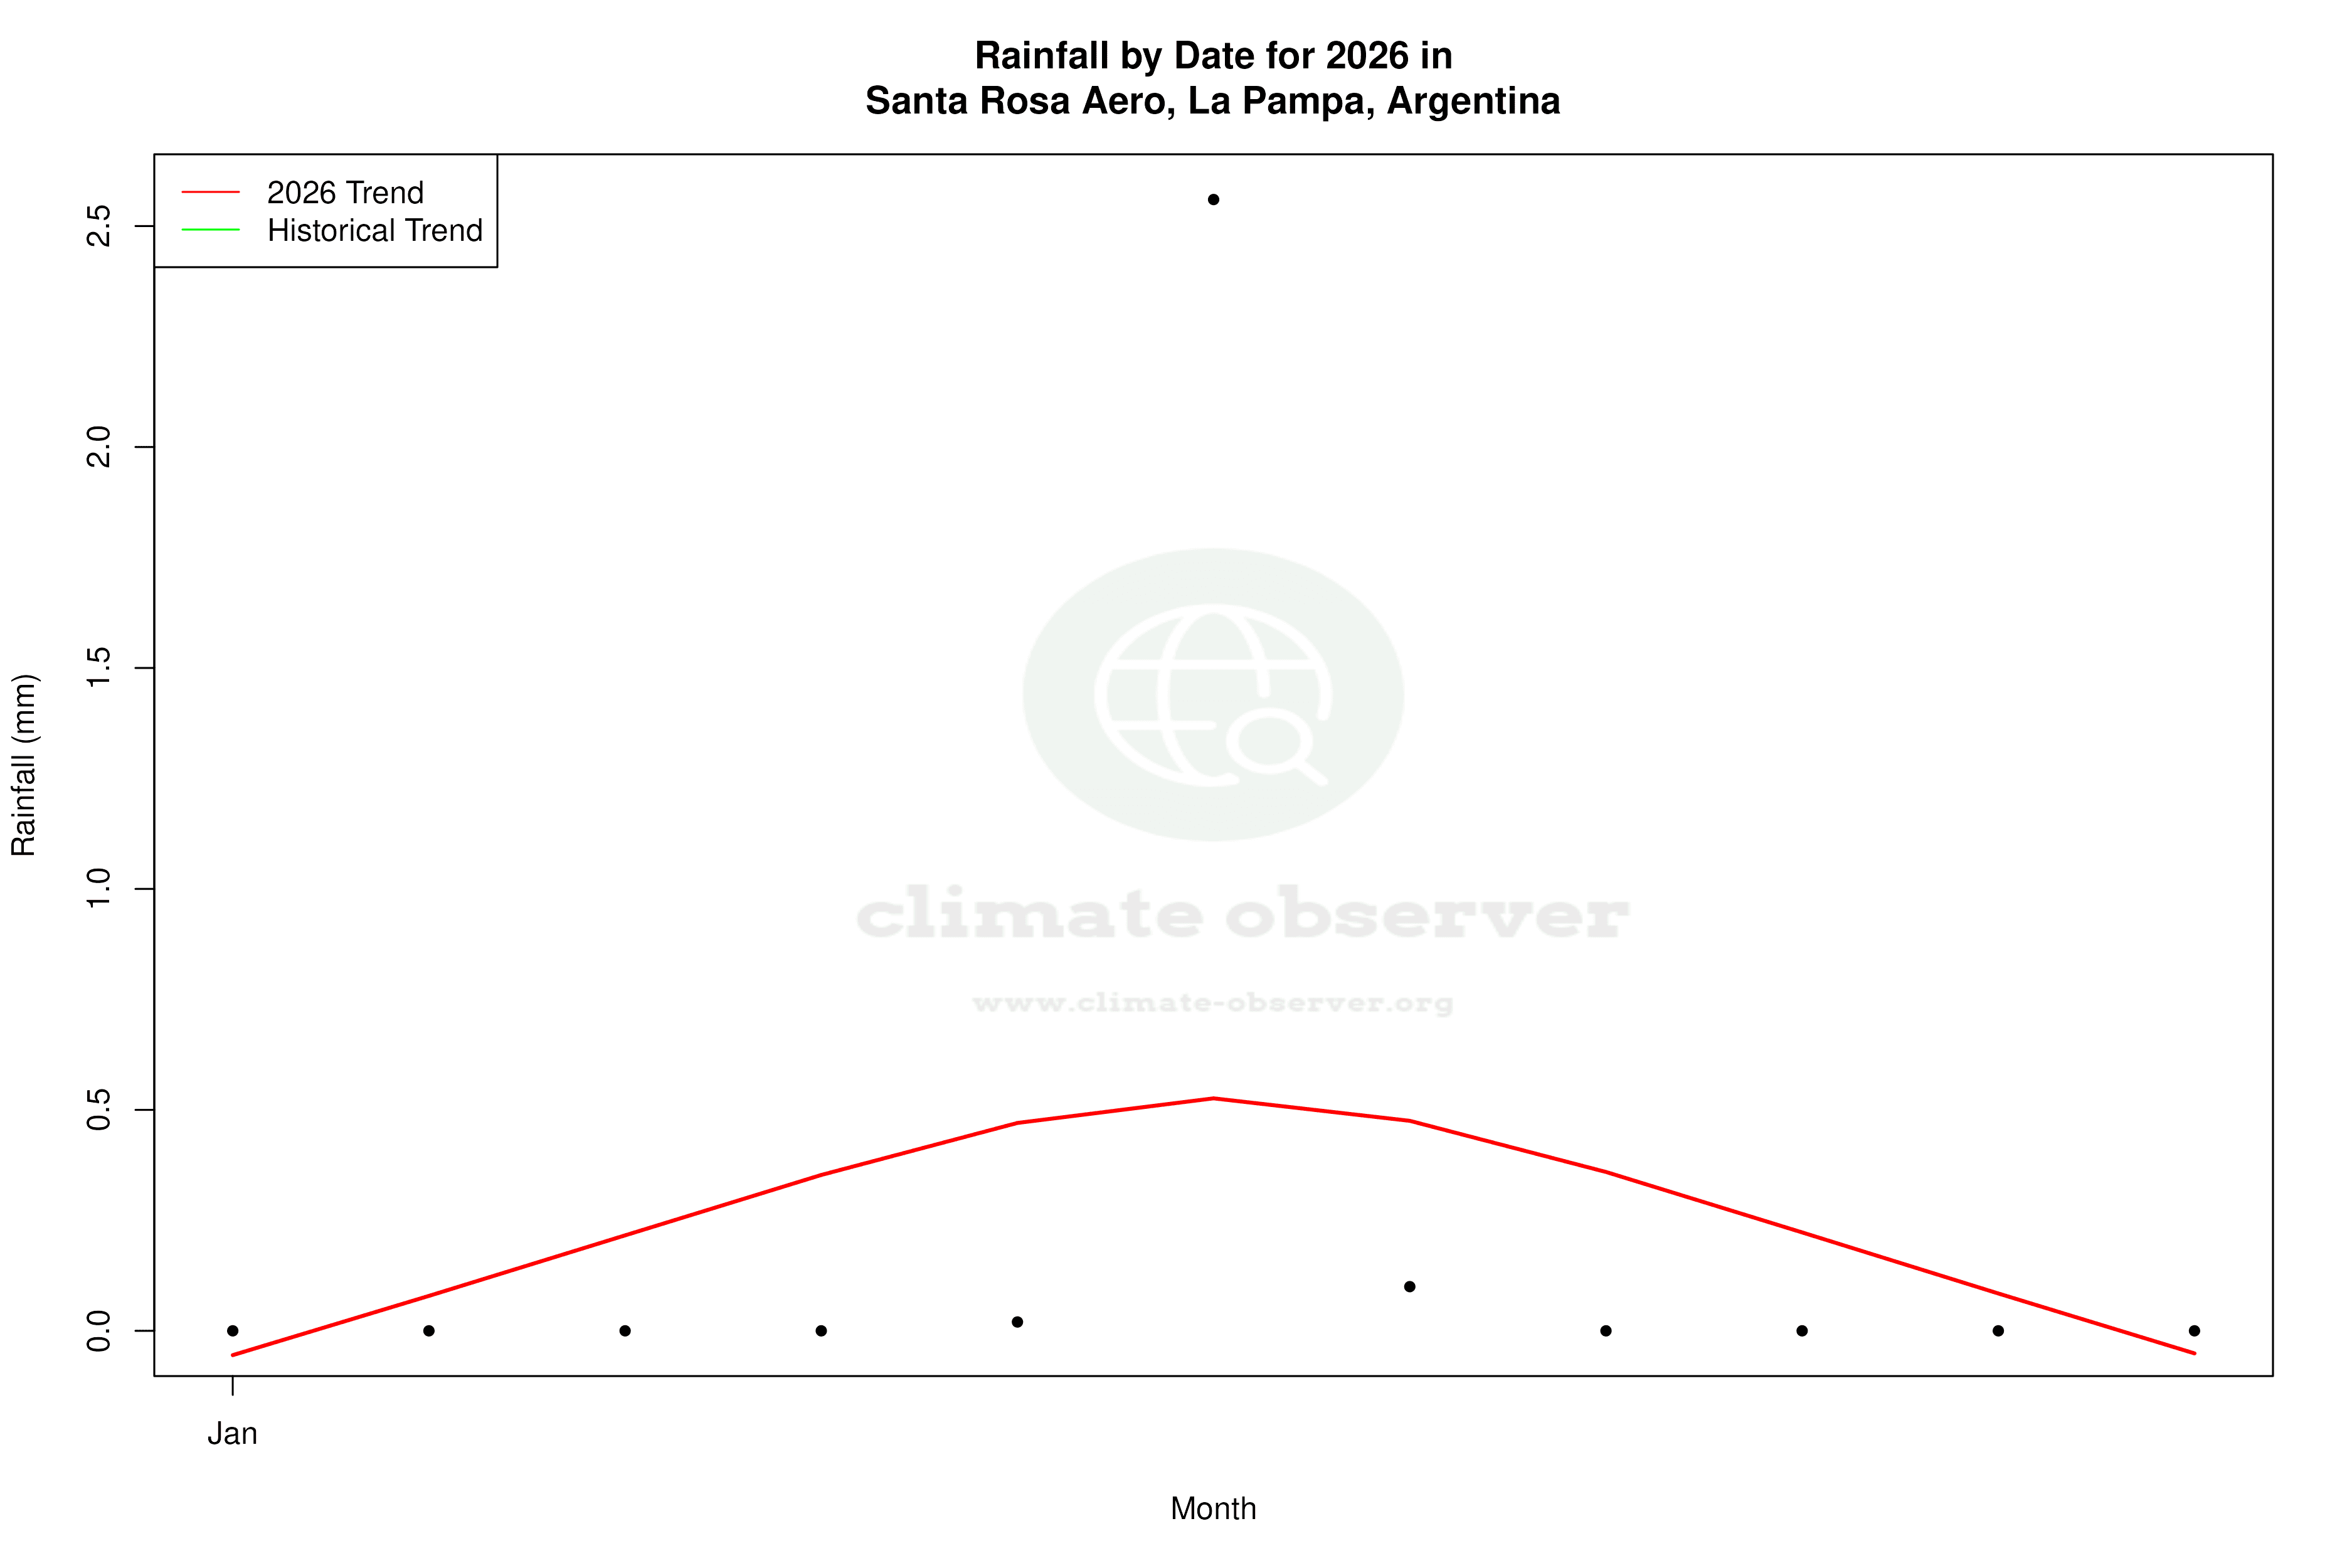


Max Temperature this Year | 1 of 6
Climate 12-Month Moving Averages
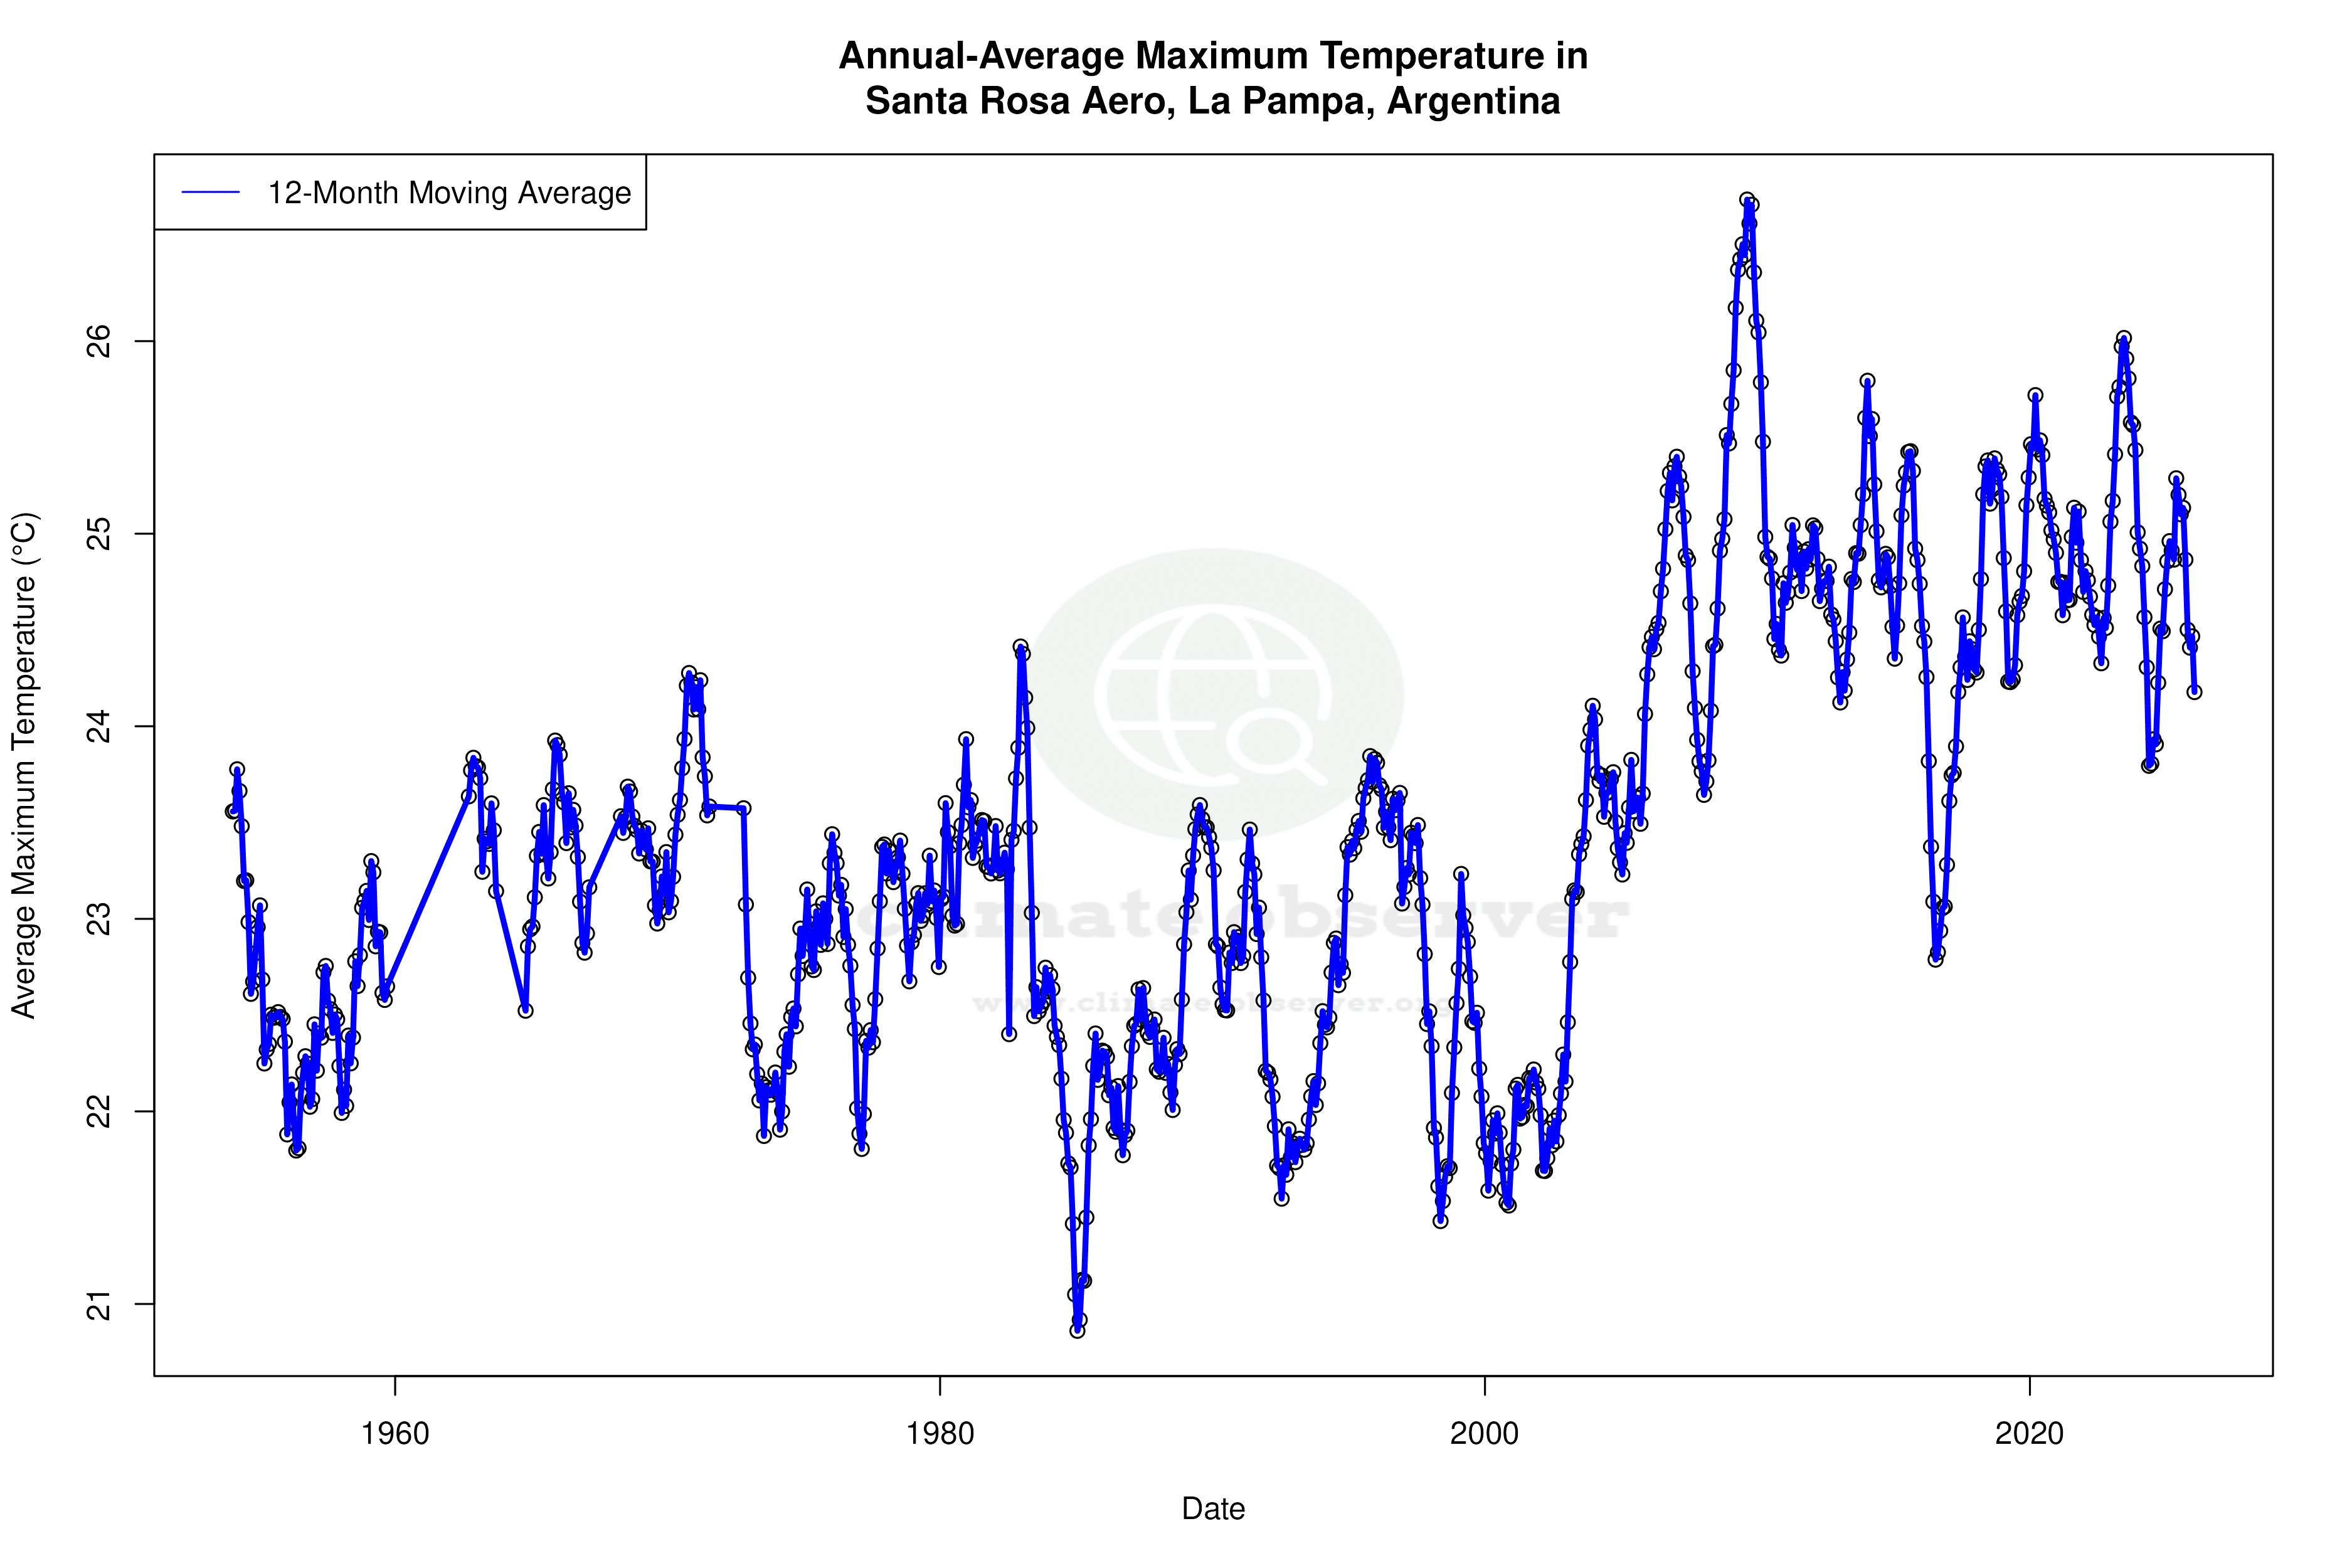
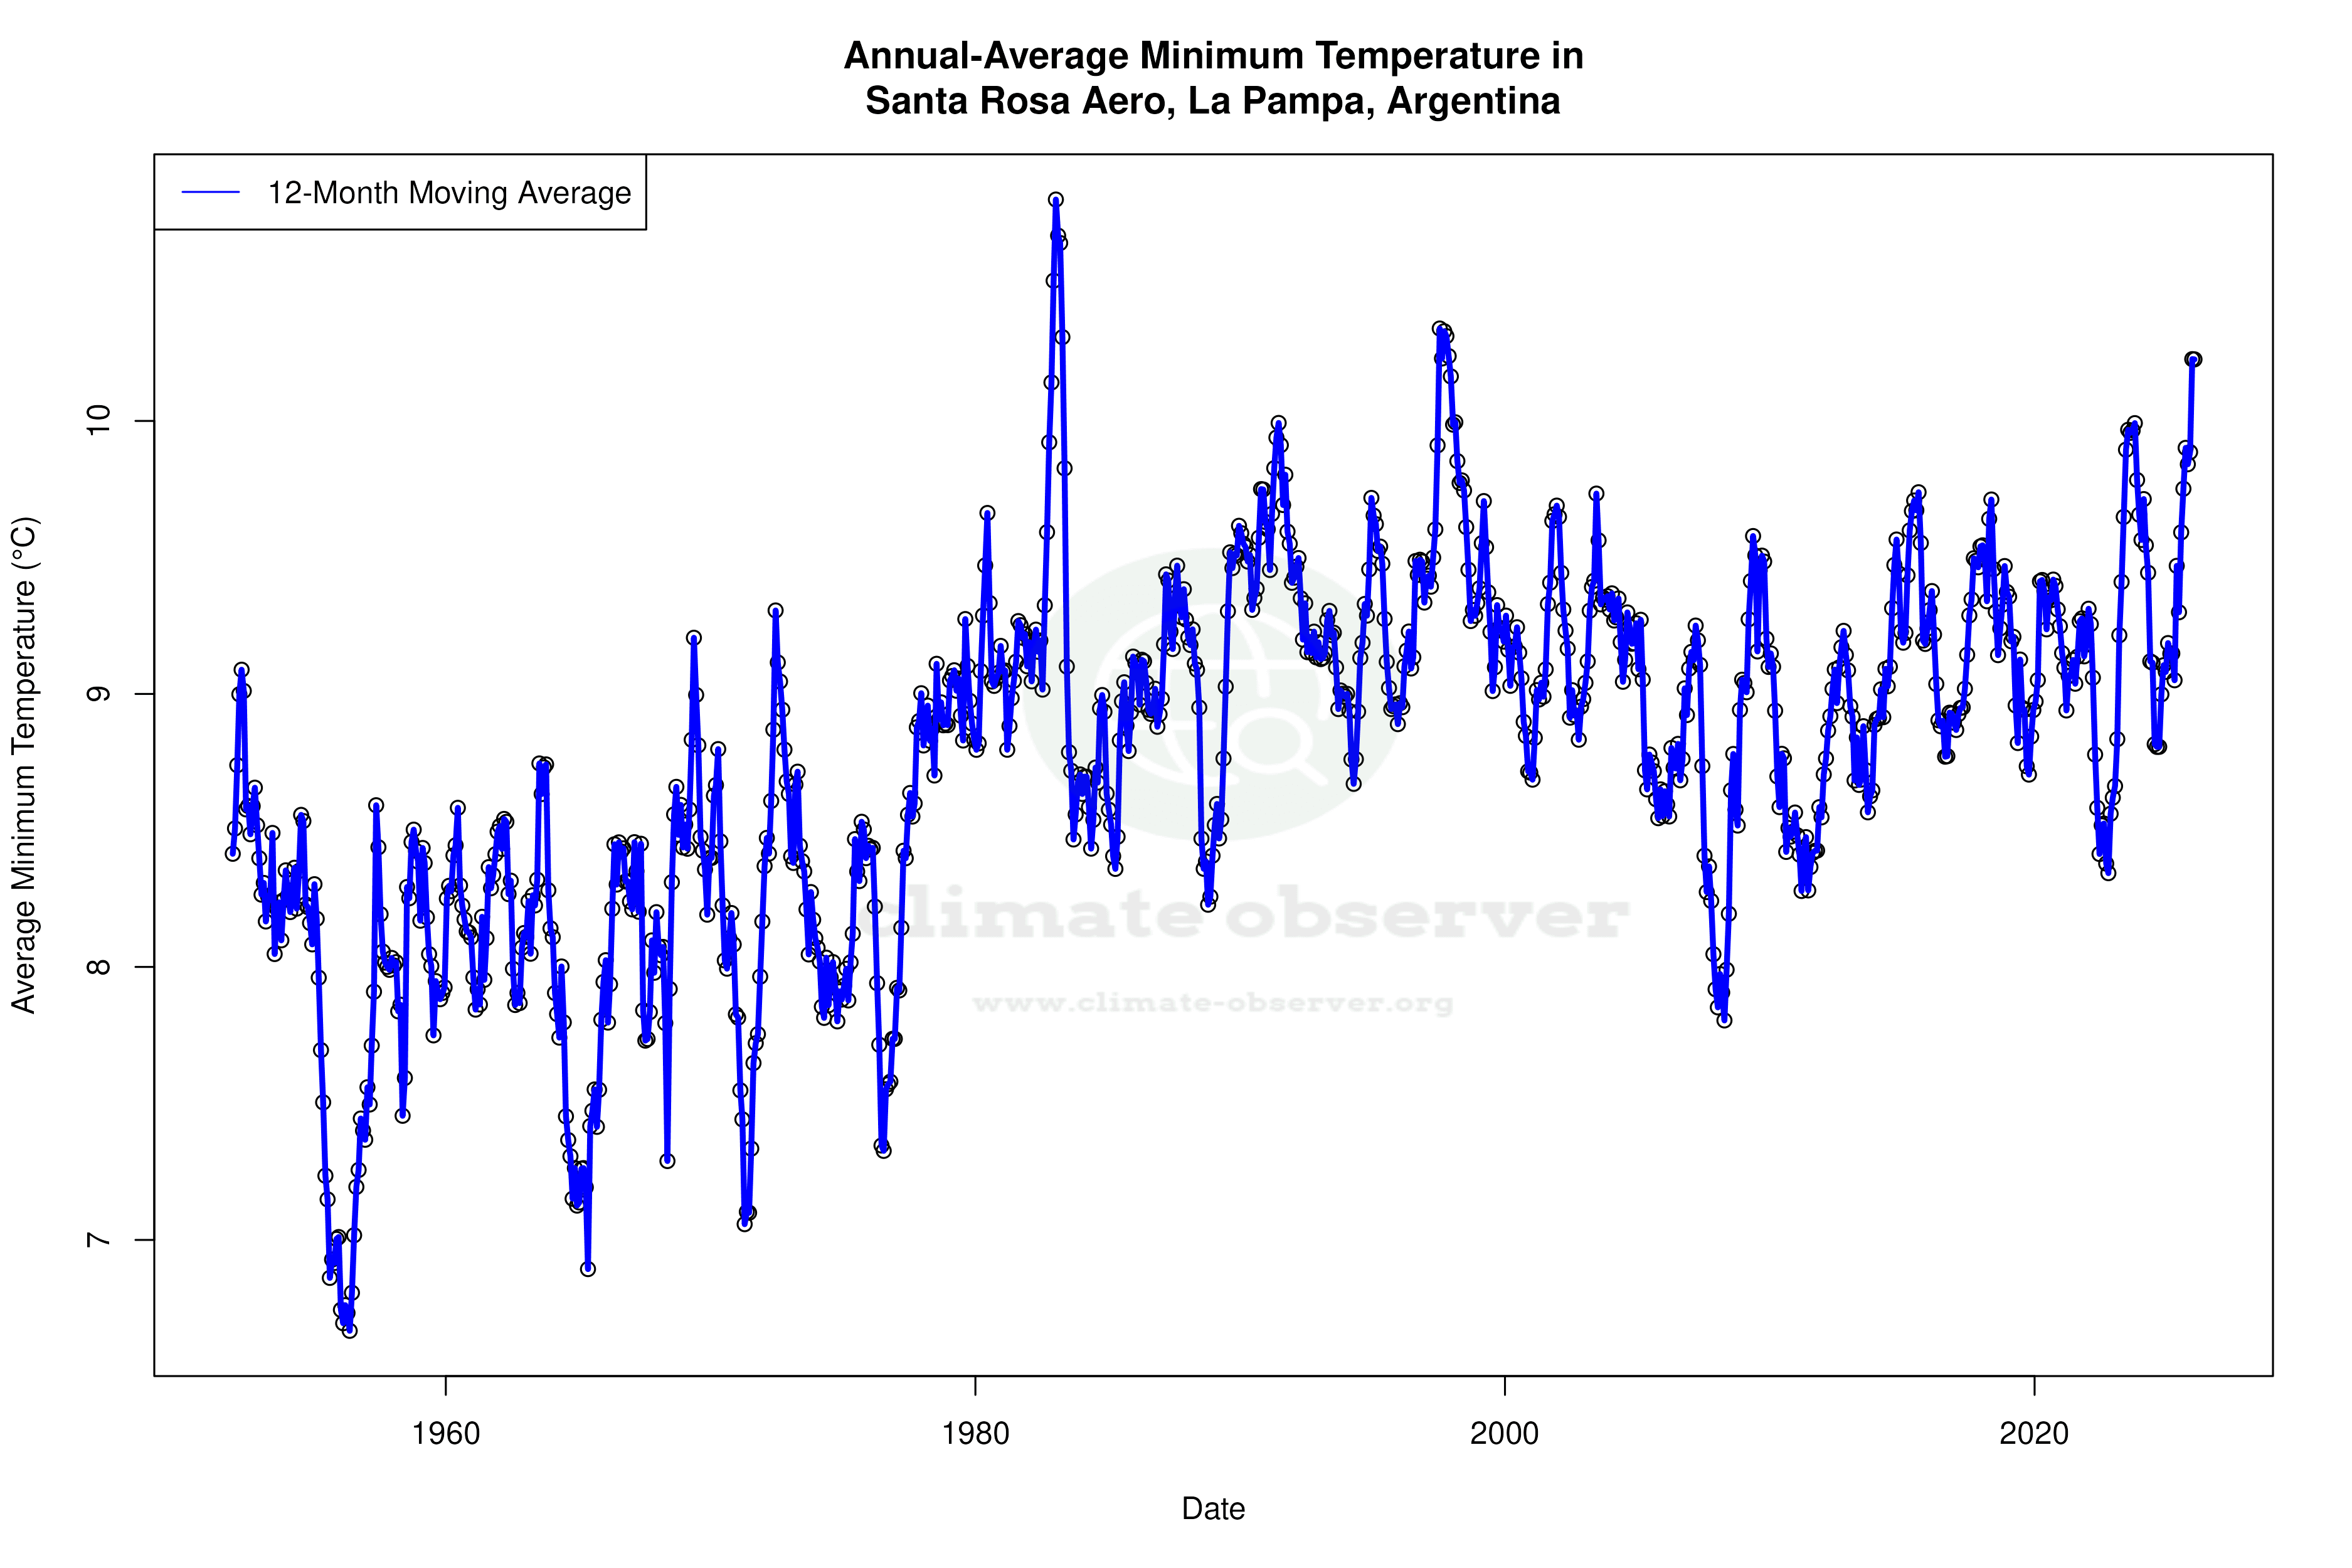


Max Temperature 12-Month MA | 1 of 6
Daily Data Points and Averages Throughout the Year


Average Max Temperature Throughout Year | 1 of 5
