Climate for Station: Mar Del Plata Aero, Buenos Aires, Argentina
Loading live weather...
Climate Analysis & Overview
Mar del Plata Aero is experiencing a nuanced shift in its climate profile, with a notable divergence between short-term and long-term temperature trends. While recent years indicate a warming of highs and a cooling of lows, the all-time data suggests a more modest warming trend. Precipitation patterns have become slightly more even, enhancing the region's climate stability.
Coastal Climate Dynamics
Mar del Plata Aero, situated on the southeastern coast of Argentina, falls under the Köppen climate classification of Cfb, indicating a temperate oceanic climate. The proximity to the Atlantic Ocean moderates temperatures, preventing extreme variations. This coastal influence is evident in the station's all-time temperature trends, which show a warming of highs by 0.29°C (0.52°F) and lows by a modest 0.05°C (0.09°F). These figures suggest a gradual rise in temperatures over the long term, reflecting the broader regional trend towards warming.
Short-Term Temperature Fluctuations
The past decade has introduced more pronounced changes, with highs increasing by 0.84°C (1.51°F) and lows decreasing by 0.78°C (1.40°F). This divergence indicates a complex interplay of factors, possibly including regional weather patterns and oceanic currents. The warming of highs could be attributed to increased solar radiation or changes in atmospheric circulation, while the cooling of lows might be influenced by nighttime radiative cooling enhanced by clearer skies.
Precipitation Patterns and Distribution
The Precipitation Concentration Index (PCI) for Mar del Plata Aero has decreased from a baseline of 11.26 to a current value of 10.10. This slight reduction in PCI suggests that precipitation is now more evenly distributed throughout the year, rather than being concentrated in fewer intense events. Such a shift can enhance water resource management and reduce the risk of flooding, aligning with Argentina's climate adaptation strategies.
Record Temperatures: A Balancing Act
The station's historical temperature records reveal a maximum of 42.0°C (107.6°F) and a minimum of -9.3°C (15.3°F). These extremes underscore the potential for variability within the region's climate system. While the oceanic influence generally tempers extremes, occasional weather anomalies can still lead to significant temperature spikes or drops, challenging local infrastructure and agriculture.
Regional Climate Goals and Implications
Argentina is actively pursuing climate goals that include reducing greenhouse gas emissions and enhancing climate resilience. The observed trends at Mar del Plata Aero, particularly the more even distribution of precipitation, support these objectives by potentially reducing the frequency and severity of extreme weather events. As the region continues to adapt to its evolving climate, understanding these localised changes remains critical for effective policy-making and community preparedness.
Station Statistics
10-Year Trend
High: +0.35 °C/decade
Low: -0.48 °C/decade
Rain: -1.95 mm/decade
25-Year Trend
High: +0.78 °C/decade
Low: +0.17 °C/decade
Rain: -0.20 mm/decade
50-Year Trend
High: +0.34 °C/decade
Low: -0.03 °C/decade
Rain: +0.16 mm/decade
All-Time Trend
High: +0.28 °C/decade
Low: +0.06 °C/decade
Rain: +0.17 mm/decade
Percentage Above-Average Days
Last 12 Months: 46.8%
This Year: 30.6%
Precipitation Concentration Index (PCI) ℹ️
Last 12 Months: 9.2
Historical Average: 11.3
Percentile Rank of Last 12 Months ℹ️
High: 77th percentile
Low: 91st percentile
Rain: 39th percentile
Change in Variance ℹ️
High: +4.1%
Low: +4.6%
Intraday: -7.1%
Data Coverage
86.8%
First Year of Data
1956
Station Location
Historical Weather Records
| Max High | Avg High | Min High | Max Avg | Avg Avg | Min Avg | Max Low | Avg Low | Min Low | Max Precipitation | Avg Precipitation | Max Snow | Avg Snow | |
|---|---|---|---|---|---|---|---|---|---|---|---|---|---|
| Record | 42.0 °C | — | 3.7 °C | 31.1 °C | — | 0.0 °C | 28.2 °C | — | -9.3 °C | 199.9 mm | — | — | — |
| January | 42.0 °C | 26.8 °C | 15.8 °C | 30.4 °C | 20.5 °C | 11.1 °C | 28.2 °C | 14.4 °C | 3.0 °C | 106.9 mm | 3.6 mm | — | — |
| February | 39.0 °C | 25.9 °C | 15.6 °C | 28.5 °C | 20.0 °C | 11.4 °C | 22.8 °C | 14.2 °C | 1.2 °C | 107.1 mm | 3.9 mm | — | — |
| March | 36.3 °C | 24.1 °C | 13.3 °C | 29.2 °C | 18.4 °C | 6.8 °C | 24.0 °C | 12.8 °C | -0.2 °C | 103.9 mm | 3.9 mm | — | — |
| April | 33.0 °C | 20.7 °C | 11.5 °C | 24.5 °C | 15.0 °C | 4.7 °C | 20.2 °C | 9.4 °C | -3.6 °C | 78.0 mm | 3.2 mm | — | — |
| May | 29.0 °C | 17.1 °C | 8.5 °C | 21.9 °C | 11.6 °C | 2.3 °C | 19.1 °C | 6.4 °C | -3.7 °C | 69.1 mm | 2.4 mm | — | — |
| June | 25.5 °C | 13.9 °C | 5.4 °C | 18.8 °C | 8.8 °C | 0.8 °C | 19.2 °C | 3.9 °C | -5.6 °C | 63.0 mm | 1.8 mm | — | — |
| July | 27.7 °C | 13.2 °C | 5.7 °C | 18.8 °C | 8.1 °C | 0.0 °C | 15.2 °C | 3.3 °C | -9.3 °C | 74.9 mm | 2.0 mm | — | — |
| August | 29.9 °C | 14.7 °C | 3.7 °C | 21.8 °C | 9.2 °C | 0.5 °C | 17.4 °C | 3.9 °C | -6.4 °C | 81.0 mm | 2.2 mm | — | — |
| September | 30.1 °C | 16.3 °C | 7.0 °C | 23.3 °C | 10.6 °C | 2.3 °C | 16.2 °C | 5.4 °C | -6.3 °C | 70.1 mm | 2.2 mm | — | — |
| October | 34.5 °C | 19.0 °C | 9.0 °C | 23.4 °C | 13.3 °C | 4.0 °C | 17.8 °C | 7.8 °C | -3.0 °C | 71.9 mm | 2.9 mm | — | — |
| November | 35.7 °C | 22.1 °C | 10.9 °C | 28.9 °C | 16.1 °C | 7.9 °C | 19.6 °C | 10.2 °C | -2.0 °C | 63.0 mm | 3.0 mm | — | — |
| December | 39.4 °C | 25.2 °C | 13.0 °C | 31.1 °C | 18.7 °C | 10.1 °C | 21.6 °C | 12.6 °C | -0.2 °C | 199.9 mm | 3.8 mm | — | — |
Data Visualisations
Remove WatermarksCurrent Year Climate Trends vs Historical


Max Temperature this Year | 1 of 6
Climate 12-Month Moving Averages


Max Temperature 12-Month MA | 1 of 6
Daily Data Points and Averages Throughout the Year


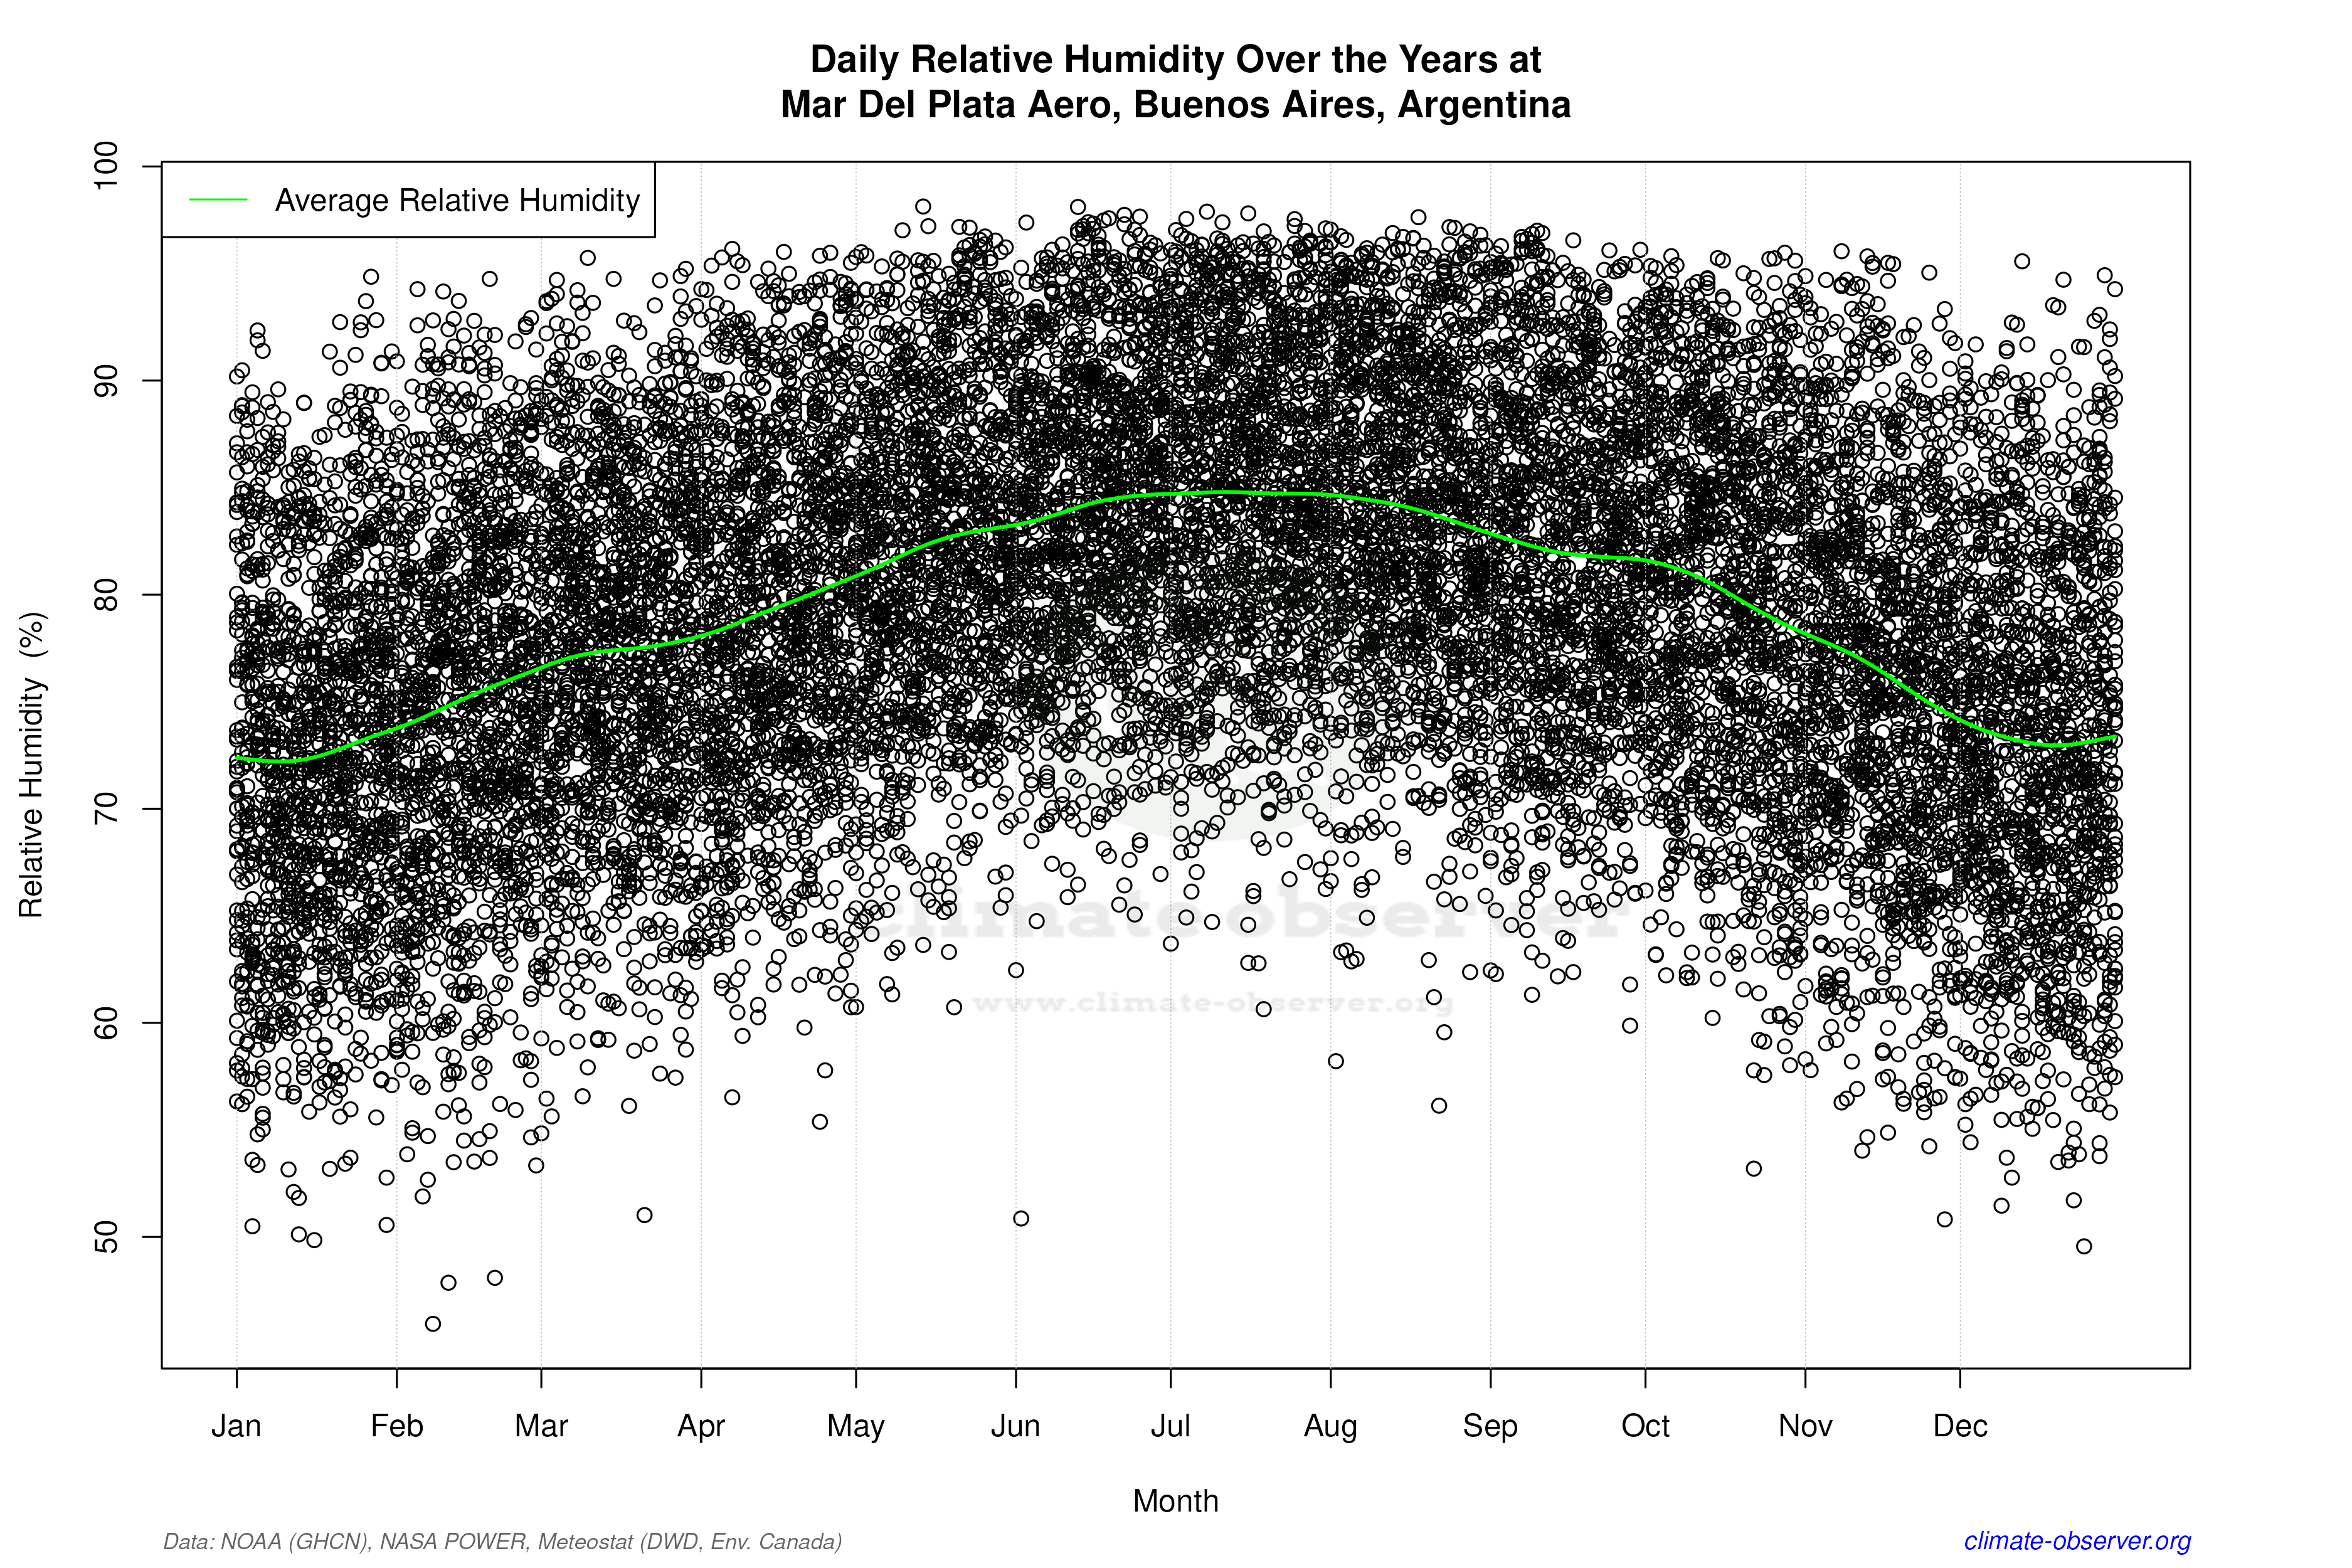

Average Max Temperature Throughout Year | 1 of 5
