Climate for Station: Salta Aero, Salta, Argentina
Loading live weather...
Climate Analysis & Overview
The climate profile of Salta Aero reveals a warming trend, with significant increases in both high and low temperatures over the past decade. Precipitation patterns are becoming more concentrated, indicating potential challenges for water management and agriculture in the region.
Warming Trends in Salta Aero
Located at -24.85, -65.483, Salta Aero is situated in the subtropical highland climate zone, characterised by dry winters and wet summers. Over the past decade, the area has experienced a notable warming trend, with high temperatures rising by 1.44°C (2.59°F) and low temperatures increasing by 0.38°C (0.68°F). This recent warming is more pronounced than the all-time trends, where highs have risen by 0.23°C (0.41°F) and lows by 0.08°C (0.14°F). These changes suggest a shift towards a warmer climate, potentially impacting the local ecosystems and agriculture.
Temperature Extremes and Records
The station's historical temperature records highlight the region's climatic extremes, with maximum temperatures reaching 39.9°C (103.8°F) and minimum temperatures dropping to -9.4°C (15.1°F). These extremes underscore the variability inherent in Salta's climate, influenced by its geographical position near the Andes, which can lead to rapid temperature changes.
Precipitation Concentration and Implications
The Precipitation Concentration Index (PCI) at Salta Aero has increased from a baseline of 19.9 to a current value of 24.8, indicating a more concentrated precipitation pattern. A PCI over 20 suggests that rainfall events are becoming more intense but less frequent, which could lead to challenges such as flooding during heavy rains and drought conditions during dry spells. This shift necessitates adaptive strategies for water resource management to mitigate potential impacts on agriculture and infrastructure.
Regional Climate Goals and Challenges
Argentina's regional climate goals aim to address the challenges posed by climate change, focusing on sustainable water management and agricultural resilience. The observed trends at Salta Aero highlight the need for targeted interventions to adapt to the increasing temperature and changing precipitation patterns. This includes investing in infrastructure to manage water resources effectively and developing agricultural practices that can withstand the changing climate.
Geographical Influences on Climate
Salta Aero's climate is heavily influenced by its proximity to the Andes Mountains, which act as a barrier to moisture-laden winds, contributing to the region's dry winters. The elevation and topography play a crucial role in the local climate dynamics, affecting temperature variations and precipitation distribution. Understanding these geographical influences is essential for developing accurate climate models and effective adaptation strategies.
Station Statistics
10-Year Trend
High: +1.37 °C/decade
Low: +0.34 °C/decade
Rain: +0.26 mm/decade
25-Year Trend
High: +0.64 °C/decade
Low: +0.14 °C/decade
Rain: +0.25 mm/decade
50-Year Trend
High: +0.39 °C/decade
Low: +0.06 °C/decade
Rain: -0.05 mm/decade
All-Time Trend
High: +0.23 °C/decade
Low: +0.08 °C/decade
Rain: -0.05 mm/decade
Percentage Above-Average Days
Last 12 Months: 46.8%
This Year: 18.4%
Precipitation Concentration Index (PCI) ℹ️
Last 12 Months: 22.5
Historical Average: 20.7
Percentile Rank of Last 12 Months ℹ️
High: 91st percentile
Low: 96th percentile
Rain: 87th percentile
Change in Variance ℹ️
High: -1.6%
Low: +6.9%
Intraday: -6.9%
Data Coverage
91.0%
First Year of Data
1956
Station Location
Historical Weather Records
| Max High | Avg High | Min High | Max Avg | Avg Avg | Min Avg | Max Low | Avg Low | Min Low | Max Precipitation | Avg Precipitation | Max Snow | Avg Snow | |
|---|---|---|---|---|---|---|---|---|---|---|---|---|---|
| Record | 39.9 °C | — | 1.0 °C | 31.9 °C | — | -1.5 °C | 22.5 °C | — | -9.4 °C | 414.0 mm | — | — | — |
| January | 36.4 °C | 27.6 °C | 14.9 °C | 31.9 °C | 21.1 °C | 10.6 °C | 22.5 °C | 16.2 °C | 6.1 °C | 119.9 mm | 6.8 mm | — | — |
| February | 35.1 °C | 26.4 °C | 12.4 °C | 26.6 °C | 20.3 °C | 10.7 °C | 21.1 °C | 15.7 °C | 4.8 °C | 380.0 mm | 6.8 mm | — | — |
| March | 34.0 °C | 25.1 °C | 12.4 °C | 26.7 °C | 19.1 °C | 8.9 °C | 21.7 °C | 14.7 °C | 2.2 °C | 350.0 mm | 4.7 mm | — | — |
| April | 34.3 °C | 22.9 °C | 8.9 °C | 25.5 °C | 16.5 °C | 6.1 °C | 19.7 °C | 11.6 °C | -1.5 °C | 185.9 mm | 1.7 mm | — | — |
| May | 34.2 °C | 20.8 °C | 4.0 °C | 22.2 °C | 13.2 °C | 0.6 °C | 18.6 °C | 7.5 °C | -5.0 °C | 129.0 mm | 0.6 mm | — | — |
| June | 34.0 °C | 19.8 °C | 3.2 °C | 25.0 °C | 10.7 °C | -1.1 °C | 16.0 °C | 3.8 °C | -7.5 °C | 21.1 mm | 0.2 mm | — | — |
| July | 37.2 °C | 20.4 °C | 1.0 °C | 29.3 °C | 10.4 °C | -1.5 °C | 19.0 °C | 2.8 °C | -8.7 °C | 127.0 mm | 0.2 mm | — | — |
| August | 37.0 °C | 22.5 °C | 4.2 °C | 27.4 °C | 12.6 °C | -0.8 °C | 22.1 °C | 4.4 °C | -9.4 °C | 8.7 mm | 0.1 mm | — | — |
| September | 37.8 °C | 24.4 °C | 4.5 °C | 25.7 °C | 15.2 °C | 2.1 °C | 20.6 °C | 7.4 °C | -4.5 °C | 33.0 mm | 0.3 mm | — | — |
| October | 39.3 °C | 26.8 °C | 8.0 °C | 31.1 °C | 18.7 °C | 6.3 °C | 21.3 °C | 11.6 °C | -1.3 °C | 42.0 mm | 1.1 mm | — | — |
| November | 39.9 °C | 27.6 °C | 11.2 °C | 28.8 °C | 20.1 °C | 8.9 °C | 21.5 °C | 13.8 °C | 1.5 °C | 159.0 mm | 2.5 mm | — | — |
| December | 39.6 °C | 28.2 °C | 12.4 °C | 28.8 °C | 21.1 °C | 9.9 °C | 22.0 °C | 15.6 °C | 6.0 °C | 414.0 mm | 5.7 mm | — | — |
Data Visualisations
Remove WatermarksCurrent Year Climate Trends vs Historical


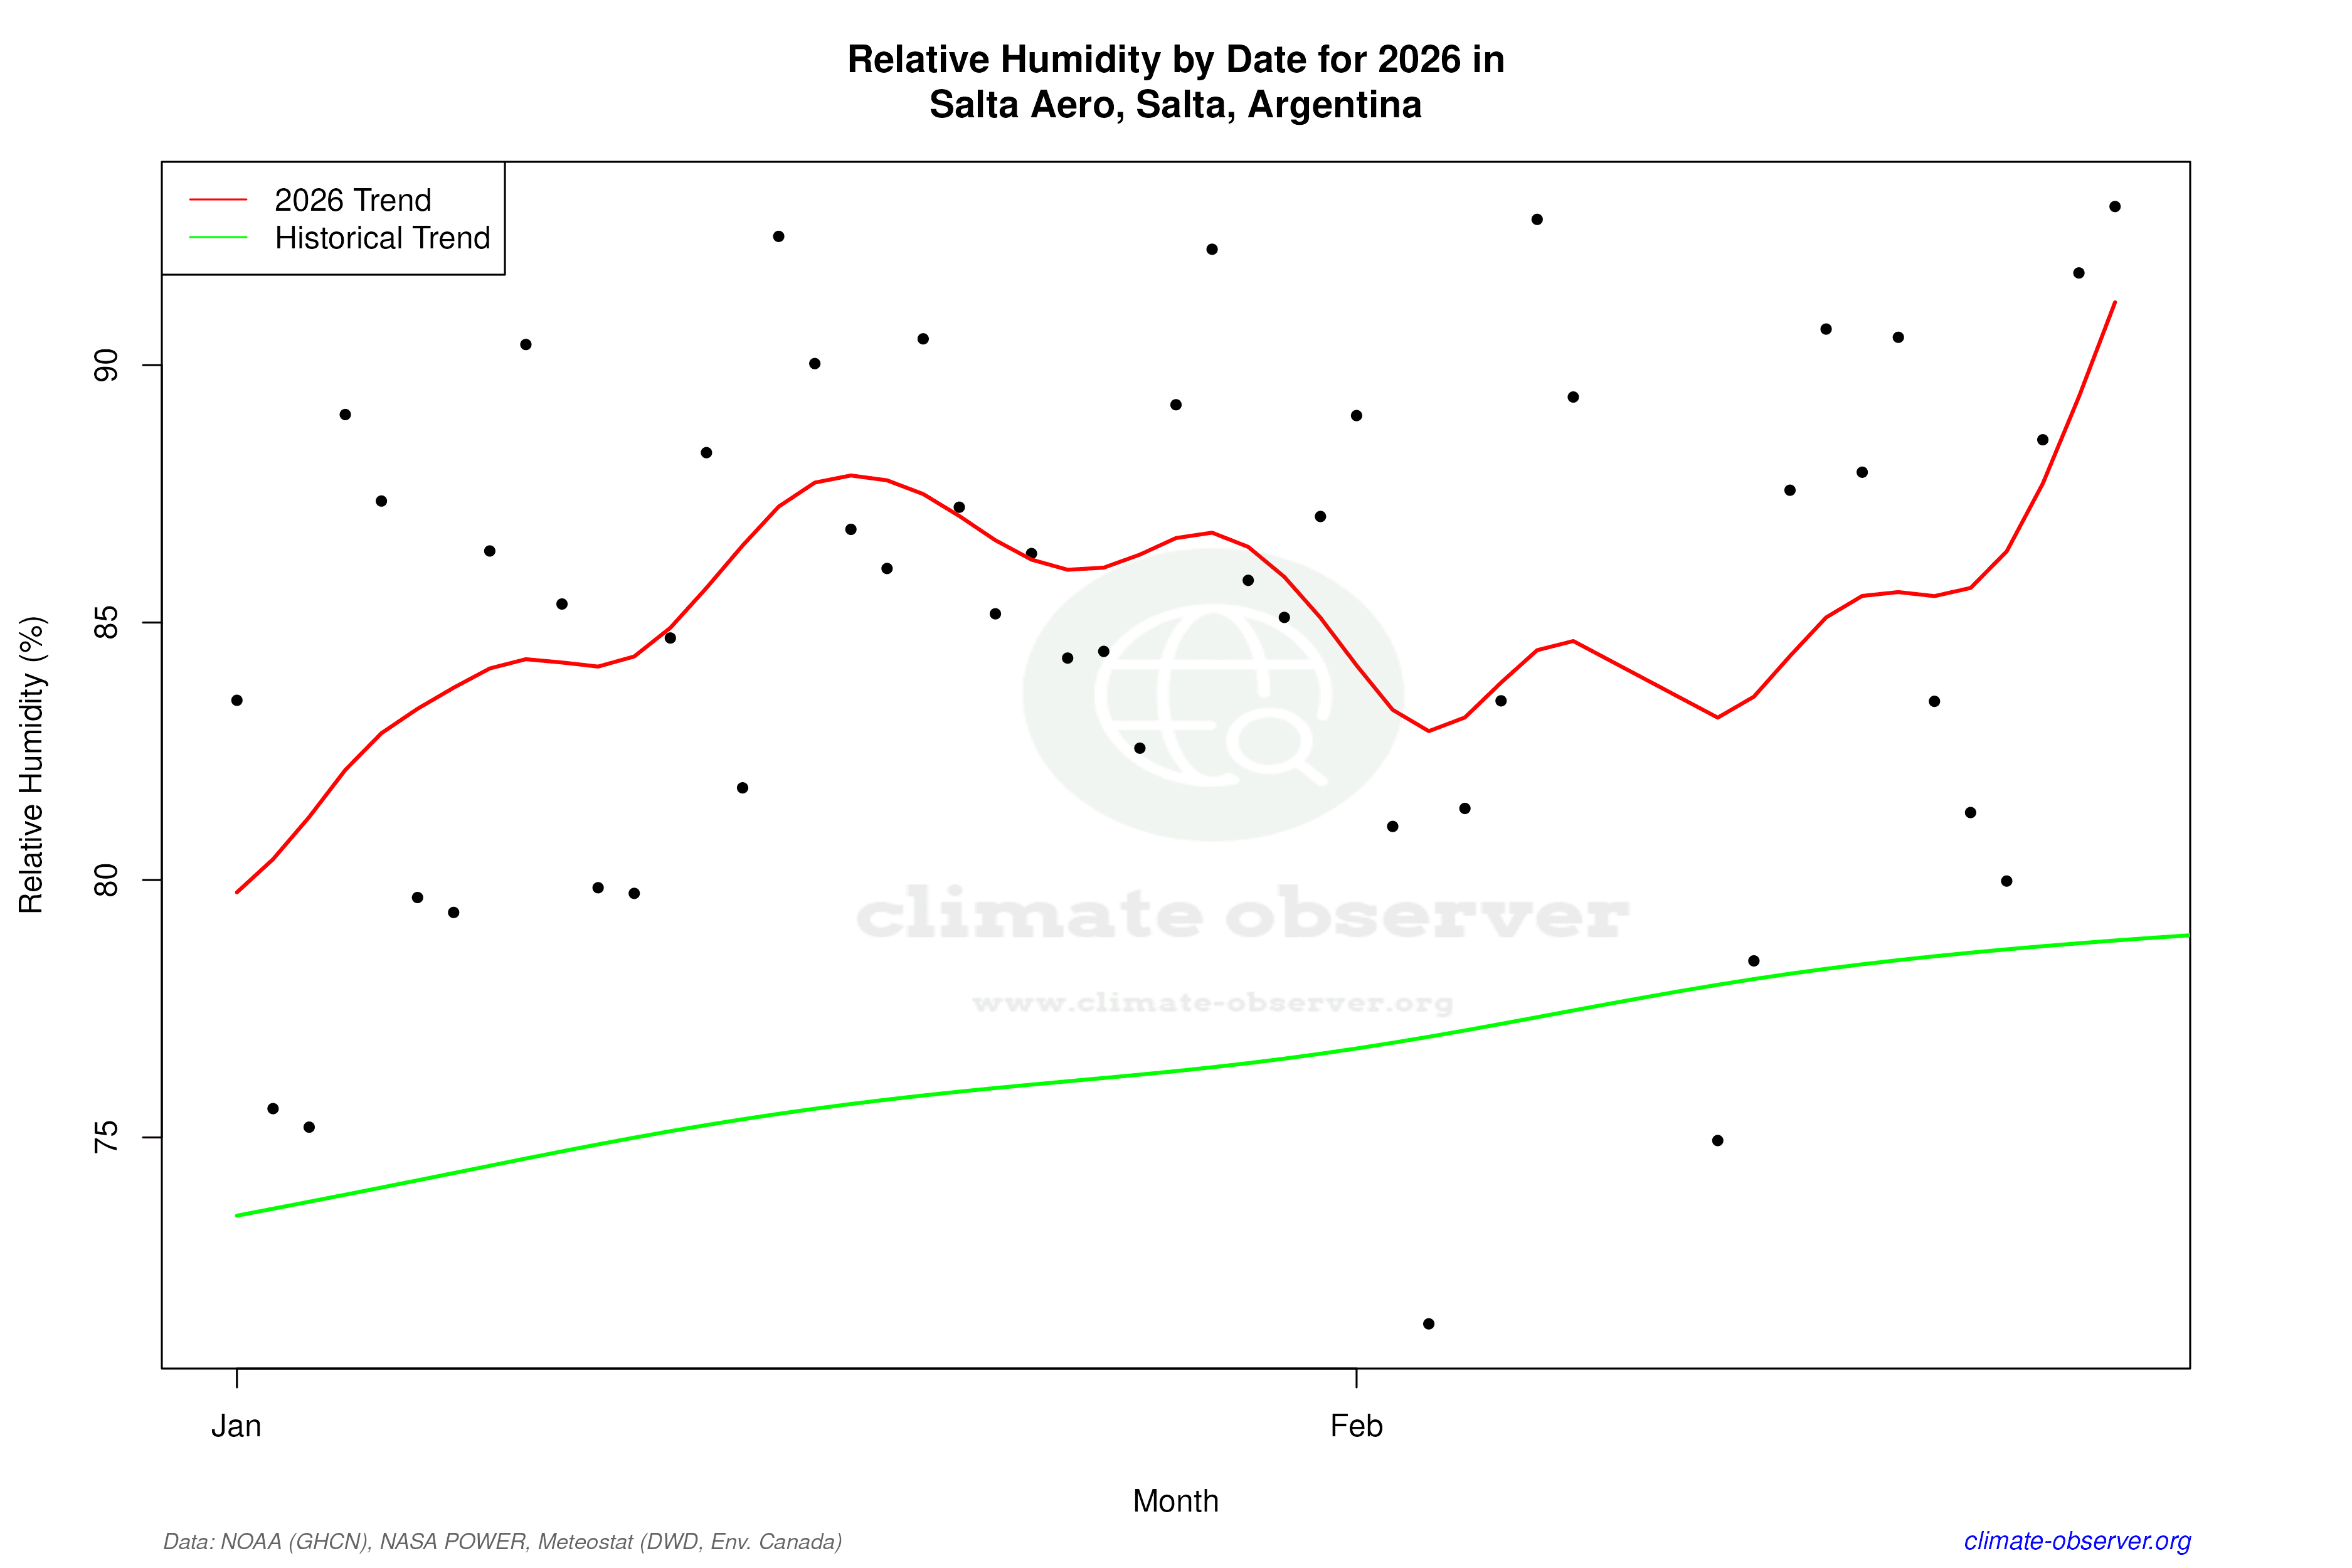

Max Temperature this Year | 1 of 6
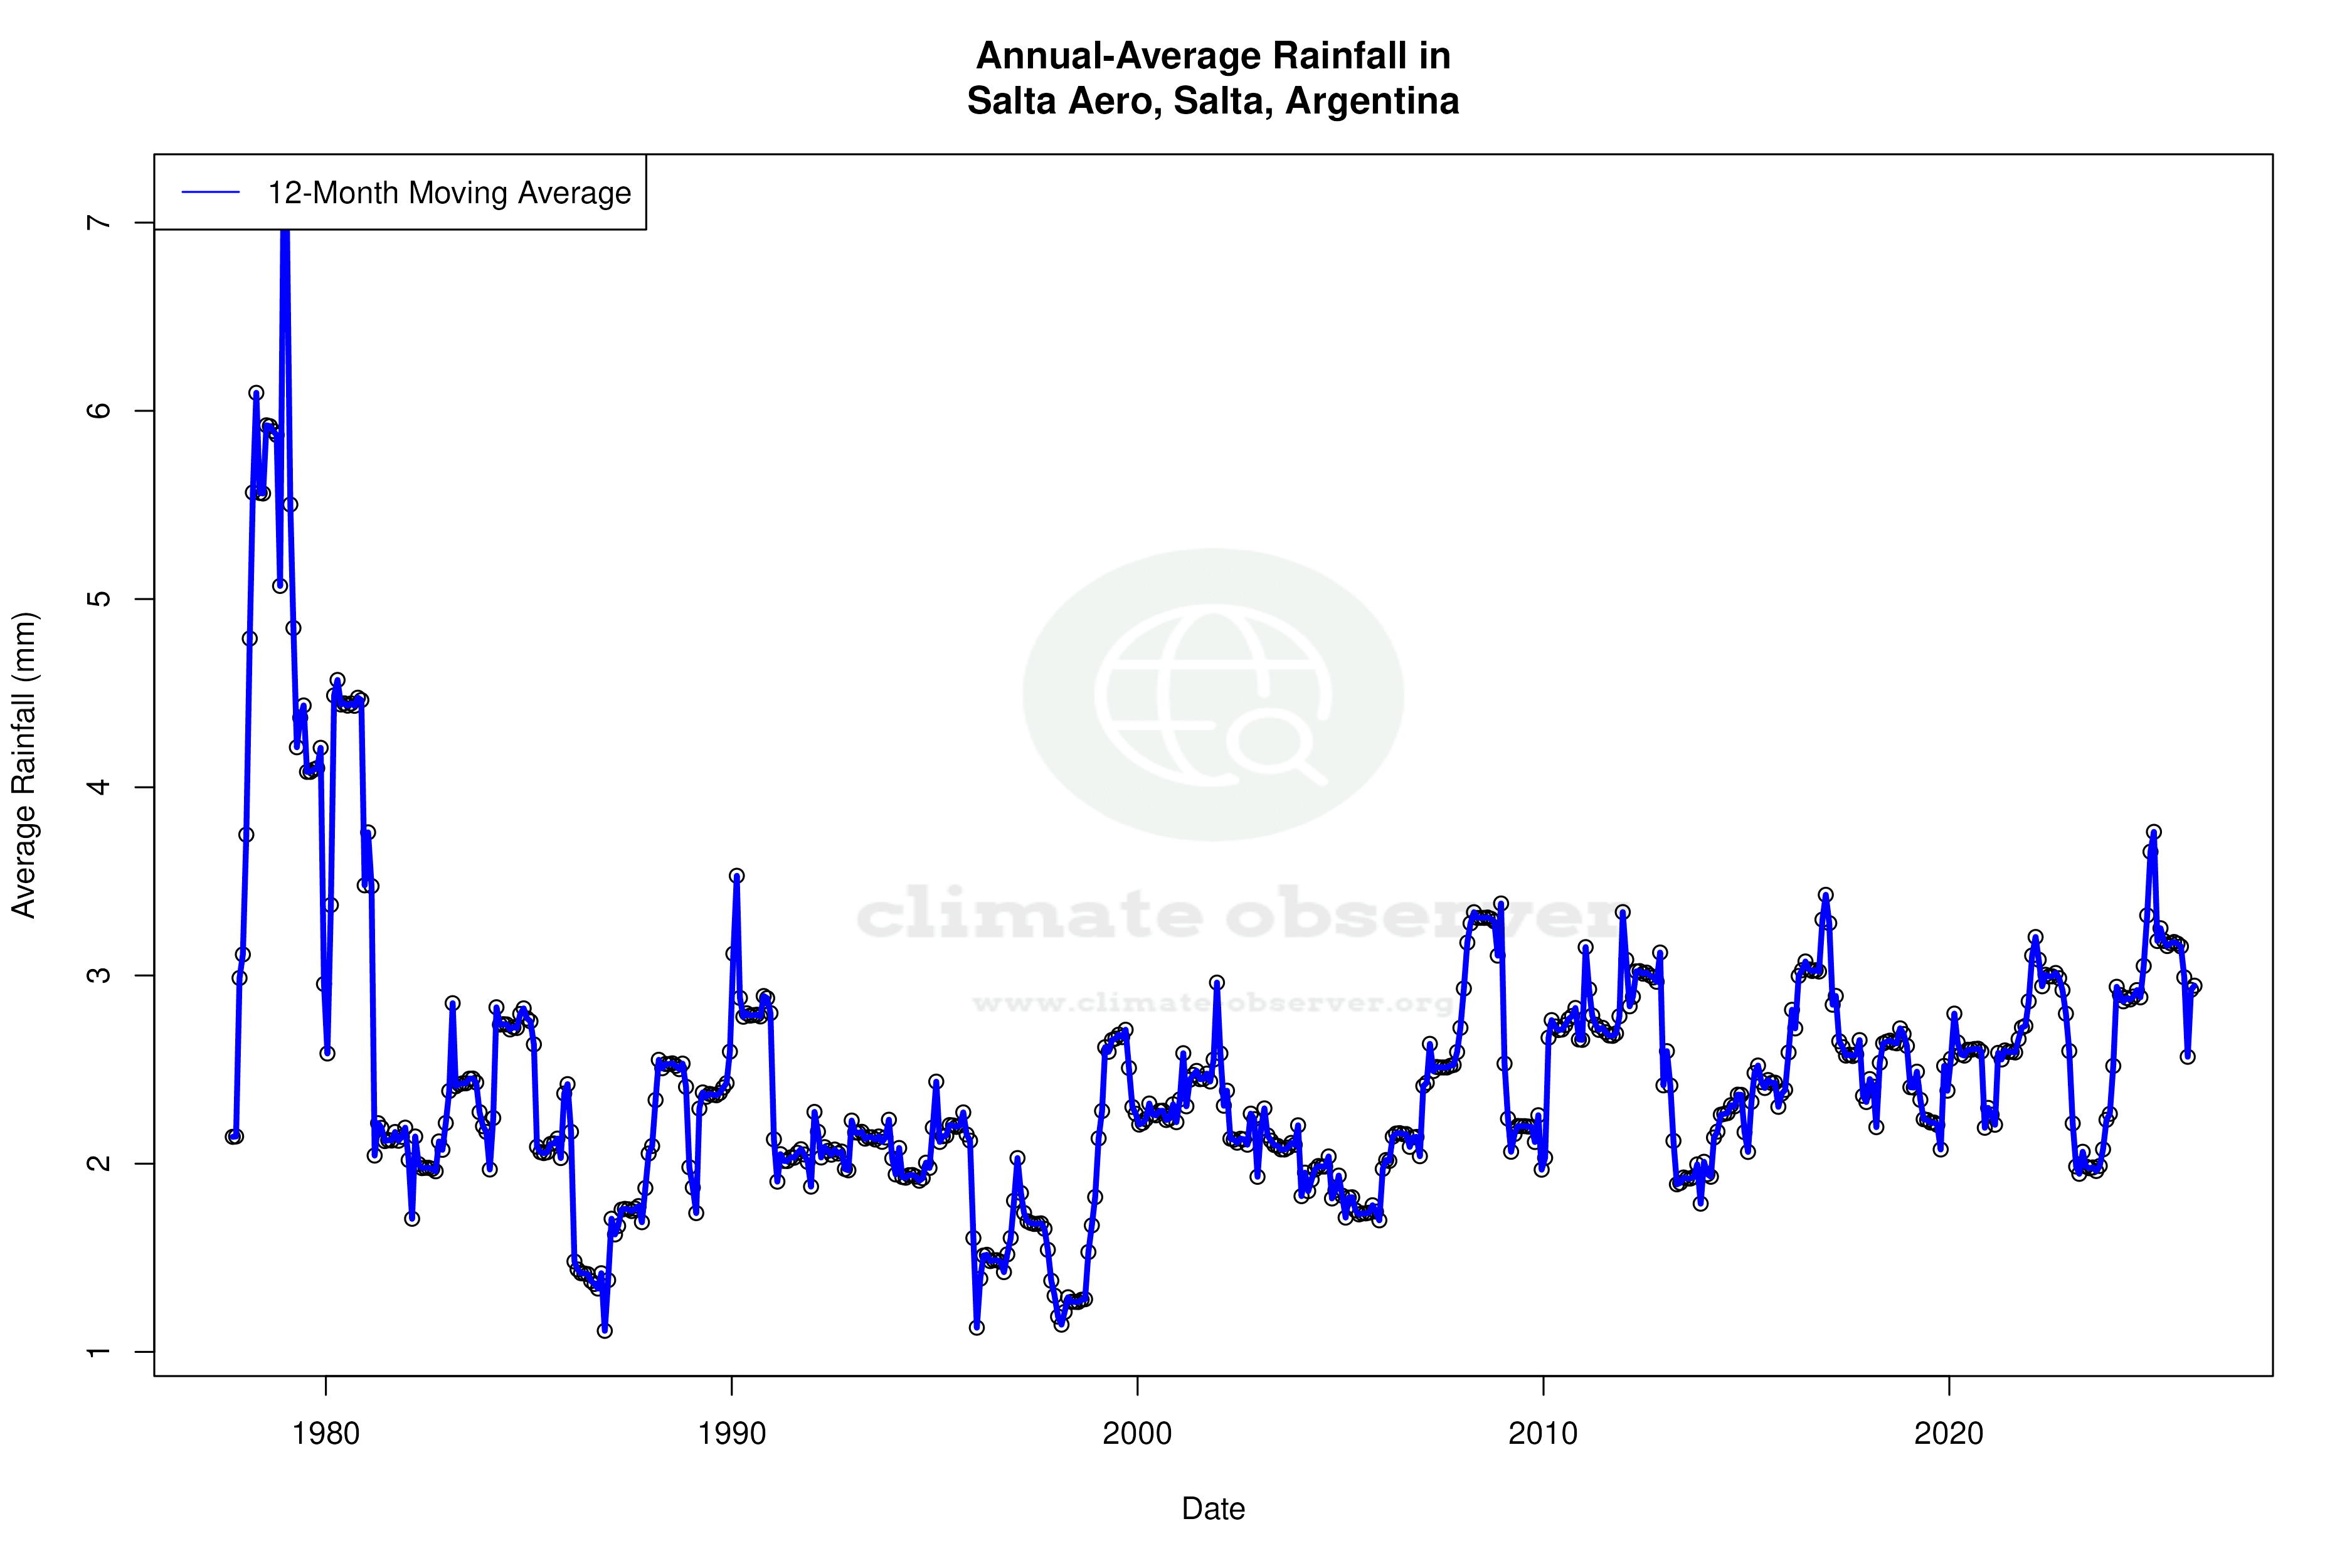
Climate 12-Month Moving Averages

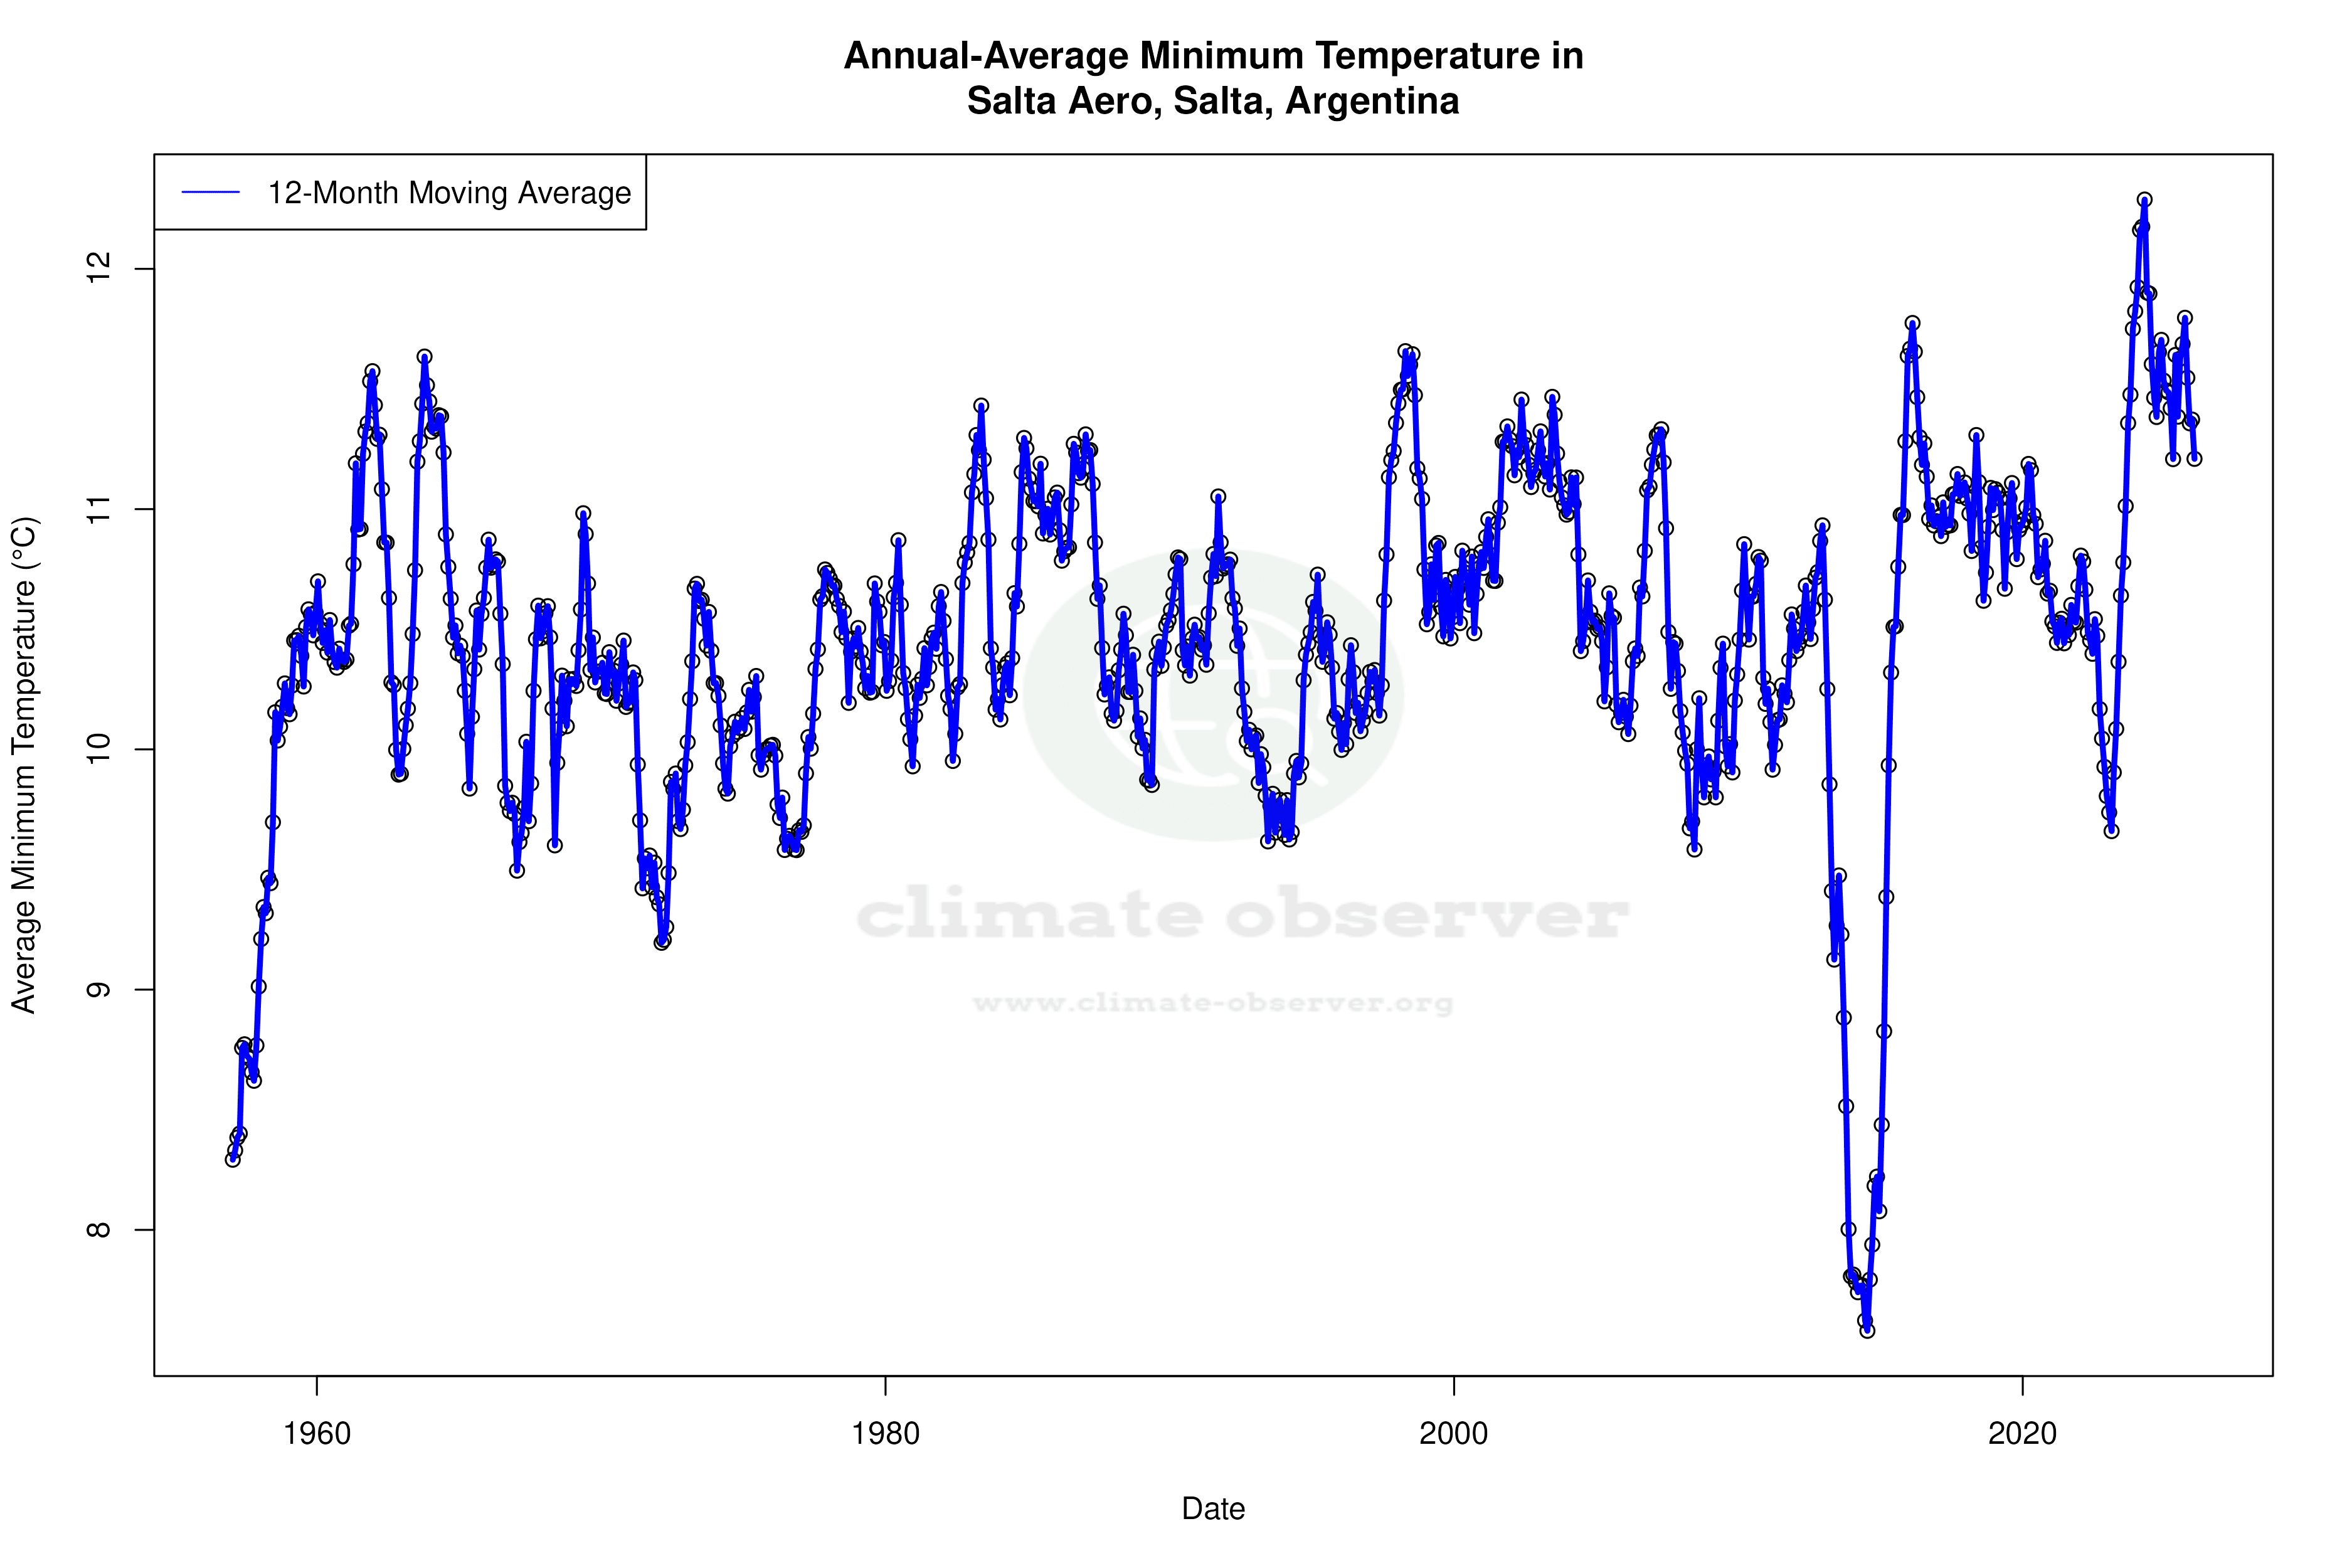


Max Temperature 12-Month MA | 1 of 6
Daily Data Points and Averages Throughout the Year


Average Max Temperature Throughout Year | 1 of 5
