Climate for Station: Kalgoorlie-Boulder Airport, Western Australia, Australia
Loading live weather...
Climate Analysis & Overview
Kalgoorlie-Boulder Airport is experiencing a warming trend, with significant changes in temperature highs and lows over the past decade. The Precipitation Concentration Index indicates a more even distribution of rainfall, aligning with regional climate goals for stability in precipitation patterns.
Desert Climate Dynamics
Kalgoorlie-Boulder Airport, located in the semi-arid region of Western Australia, falls under the Köppen climate classification of BSh, indicative of a hot semi-arid climate. This classification is characterised by hot summers and mild winters, with limited and irregular precipitation. The local geography, dominated by flat landscapes and sparse vegetation, contributes to these climatic conditions, allowing for significant temperature fluctuations.
Warming Trends and Temperature Extremes
The station data reveals a noticeable warming trend. Over the last decade, the average high temperatures have increased by 1.06°C (1.91°F), while the lows have risen by 0.64°C (1.15°F). This recent trend is more pronounced than the all-time trend, which shows a rise of 0.14°C (0.25°F) for highs and 0.19°C (0.34°F) for lows. These figures suggest an accelerated warming in recent years. The record temperatures at this location have reached a maximum of 46.5°C (115.7°F) and a minimum of -3.4°C (25.9°F), highlighting the extreme conditions that can occur in this region.
Precipitation Patterns: A Shift Towards Evenness
The Precipitation Concentration Index (PCI) at Kalgoorlie-Boulder Airport has decreased from a baseline of 16.37 to a current value of 12.59. This indicates a more even distribution of rainfall events, moving away from highly concentrated precipitation occurrences. Such a shift can be beneficial for agriculture and water management, as it reduces the risk of drought and flooding, aligning with Australia's regional climate goals for more stable and predictable weather patterns.
Regional Climate Implications
The warming trends observed at Kalgoorlie-Boulder Airport are consistent with broader climatic changes across Australia, where increasing temperatures are a growing concern. These trends are critical for understanding regional climate dynamics and planning for future adaptations. The more evenly distributed precipitation, as indicated by the PCI, suggests a positive development in managing water resources, crucial for sustaining the semi-arid environment.
Temperature and Precipitation: A Balancing Act
The interplay between rising temperatures and changes in precipitation patterns at Kalgoorlie-Boulder Airport underscores the complexity of climate dynamics in semi-arid regions. While the warming trend presents challenges, the shift towards more evenly distributed rainfall offers a counterbalance, potentially mitigating some adverse effects of increased temperatures. This delicate balance is essential for maintaining the ecological and economic stability of the region.
Station Statistics
10-Year Trend
High: +0.97 °C/decade
Low: +0.70 °C/decade
Rain: +0.01 mm/decade
25-Year Trend
High: +0.23 °C/decade
Low: +0.25 °C/decade
Rain: +0.06 mm/decade
50-Year Trend
High: +0.20 °C/decade
Low: +0.20 °C/decade
Rain: +0.01 mm/decade
All-Time Trend
High: +0.14 °C/decade
Low: +0.19 °C/decade
Rain: -0.01 mm/decade
Percentage Above-Average Days
Last 12 Months: 52.9%
This Year: 52.4%
Precipitation Concentration Index (PCI) ℹ️
Last 12 Months: 12.0
Historical Average: 15.4
Percentile Rank of Last 12 Months ℹ️
High: 95th percentile
Low: 95th percentile
Rain: 66th percentile
Change in Variance ℹ️
High: +0.8%
Low: -1.2%
Intraday: -4.4%
Data Coverage
96.7%
First Year of Data
1939
Station Location
Historical Weather Records
| Max High | Avg High | Min High | Max Avg | Avg Avg | Min Avg | Max Low | Avg Low | Min Low | Max Precipitation | Avg Precipitation | Max Snow | Avg Snow | |
|---|---|---|---|---|---|---|---|---|---|---|---|---|---|
| Record | 46.5 °C | — | 7.2 °C | 39.7 °C | — | 3.9 °C | 30.4 °C | — | -3.4 °C | 177.8 mm | — | — | — |
| January | 46.5 °C | 33.8 °C | 15.9 °C | 39.7 °C | 26.2 °C | 14.2 °C | 30.4 °C | 18.4 °C | 8.8 °C | 154.4 mm | 0.7 mm | — | — |
| February | 46.5 °C | 32.2 °C | 15.0 °C | 36.0 °C | 25.1 °C | 14.0 °C | 29.8 °C | 18.0 °C | 8.5 °C | 177.8 mm | 0.9 mm | — | — |
| March | 44.5 °C | 29.5 °C | 15.6 °C | 34.3 °C | 22.8 °C | 13.1 °C | 27.6 °C | 16.2 °C | 5.7 °C | 74.1 mm | 0.7 mm | — | — |
| April | 40.1 °C | 25.4 °C | 12.8 °C | 31.4 °C | 19.1 °C | 8.9 °C | 24.7 °C | 12.7 °C | 1.7 °C | 49.8 mm | 0.6 mm | — | — |
| May | 33.4 °C | 20.8 °C | 10.5 °C | 25.4 °C | 14.7 °C | 6.0 °C | 22.8 °C | 8.6 °C | -1.8 °C | 45.2 mm | 0.7 mm | — | — |
| June | 27.6 °C | 17.6 °C | 8.9 °C | 22.1 °C | 11.9 °C | 4.7 °C | 16.3 °C | 6.2 °C | -3.0 °C | 57.2 mm | 0.9 mm | — | — |
| July | 28.7 °C | 16.9 °C | 7.2 °C | 20.3 °C | 11.0 °C | 3.9 °C | 15.8 °C | 5.0 °C | -3.4 °C | 27.7 mm | 0.7 mm | — | — |
| August | 32.0 °C | 18.8 °C | 8.9 °C | 23.6 °C | 12.4 °C | 4.6 °C | 17.4 °C | 5.7 °C | -2.4 °C | 39.9 mm | 0.7 mm | — | — |
| September | 37.9 °C | 22.5 °C | 10.2 °C | 29.2 °C | 15.5 °C | 6.6 °C | 22.8 °C | 8.1 °C | -0.6 °C | 44.2 mm | 0.4 mm | — | — |
| October | 40.9 °C | 26.1 °C | 11.6 °C | 31.7 °C | 18.9 °C | 7.5 °C | 24.1 °C | 11.3 °C | -1.0 °C | 25.8 mm | 0.5 mm | — | — |
| November | 44.7 °C | 29.1 °C | 13.5 °C | 34.8 °C | 21.9 °C | 8.7 °C | 26.6 °C | 14.2 °C | 3.1 °C | 64.5 mm | 0.6 mm | — | — |
| December | 45.0 °C | 32.2 °C | 14.3 °C | 36.6 °C | 24.6 °C | 12.3 °C | 29.4 °C | 16.7 °C | 5.5 °C | 24.6 mm | 0.4 mm | — | — |
Data Visualisations
Remove WatermarksCurrent Year Climate Trends vs Historical
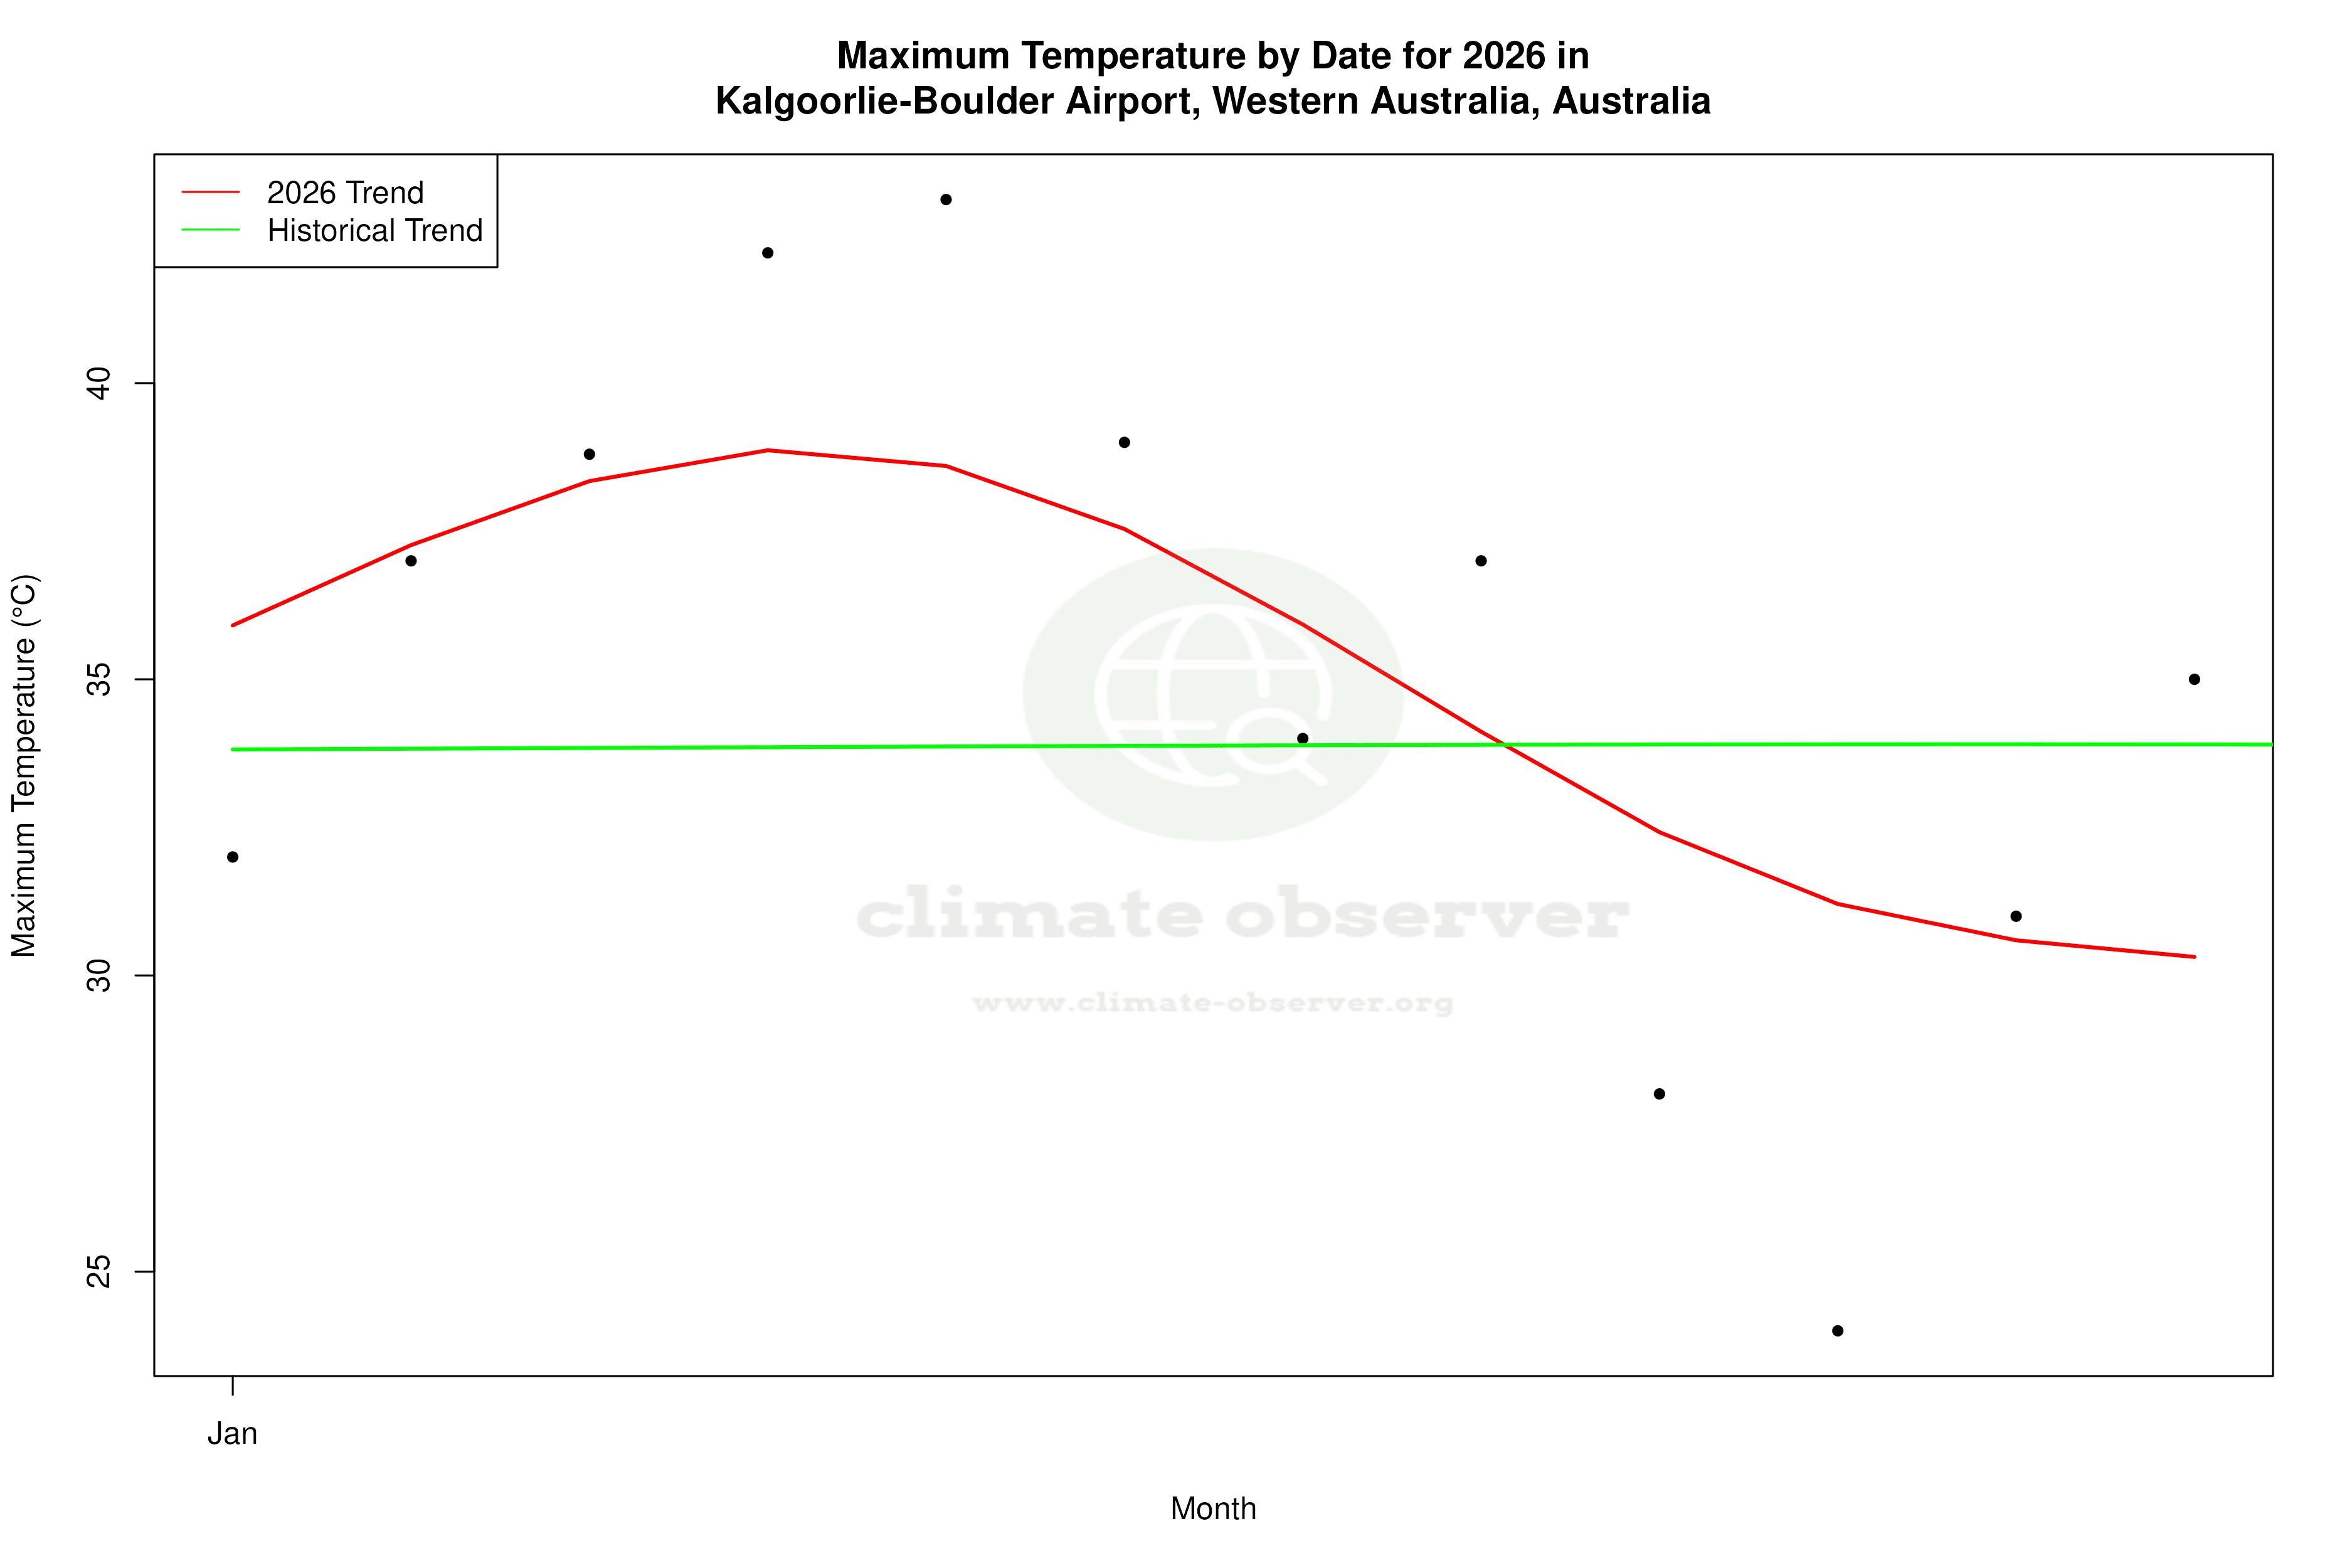


Max Temperature this Year | 1 of 6
Climate 12-Month Moving Averages


Max Temperature 12-Month MA | 1 of 6
Daily Data Points and Averages Throughout the Year


Average Max Temperature Throughout Year | 1 of 5
