Climate for Station: Robe Comparison, South Australia, Australia
Loading live weather...
Climate Analysis & Overview
The climate in Robe, South Australia, is experiencing a nuanced shift. While long-term warming trends are evident, recent data suggests a cooling in high temperatures over the past decade. Precipitation patterns have become more evenly distributed, reflecting a slight change in the region's hydrological cycle.
Coastal Climate Dynamics
Robe, located on the southern coast of Australia, falls under the Köppen climate classification of Csb, indicating a temperate climate with dry and warm summers. This coastal town is influenced by the Southern Ocean, which moderates its temperature extremes. The all-time temperature trends reveal a warming of 0.06°C (0.11°F) for both highs and lows, suggesting an overall rise in ambient temperatures over the decades. However, the past decade has shown a divergence, with high temperatures experiencing a cooling of 0.07°C (0.13°F), while low temperatures have slightly risen by 0.02°C (0.03°F). This indicates a complex interplay between oceanic influences and atmospheric conditions.
Temperature Extremes and Records
Robe's temperature records highlight the extremes that can occur even in a moderated climate. The highest recorded temperature is 39.6°C (103.3°F), while the lowest dips to -2.8°C (27.0°F). These records underscore the variability inherent in the region's climate, influenced by both local and broader climatic factors. The recent cooling trend in high temperatures over the last decade may reflect changes in atmospheric circulation patterns or increased oceanic cooling effects.
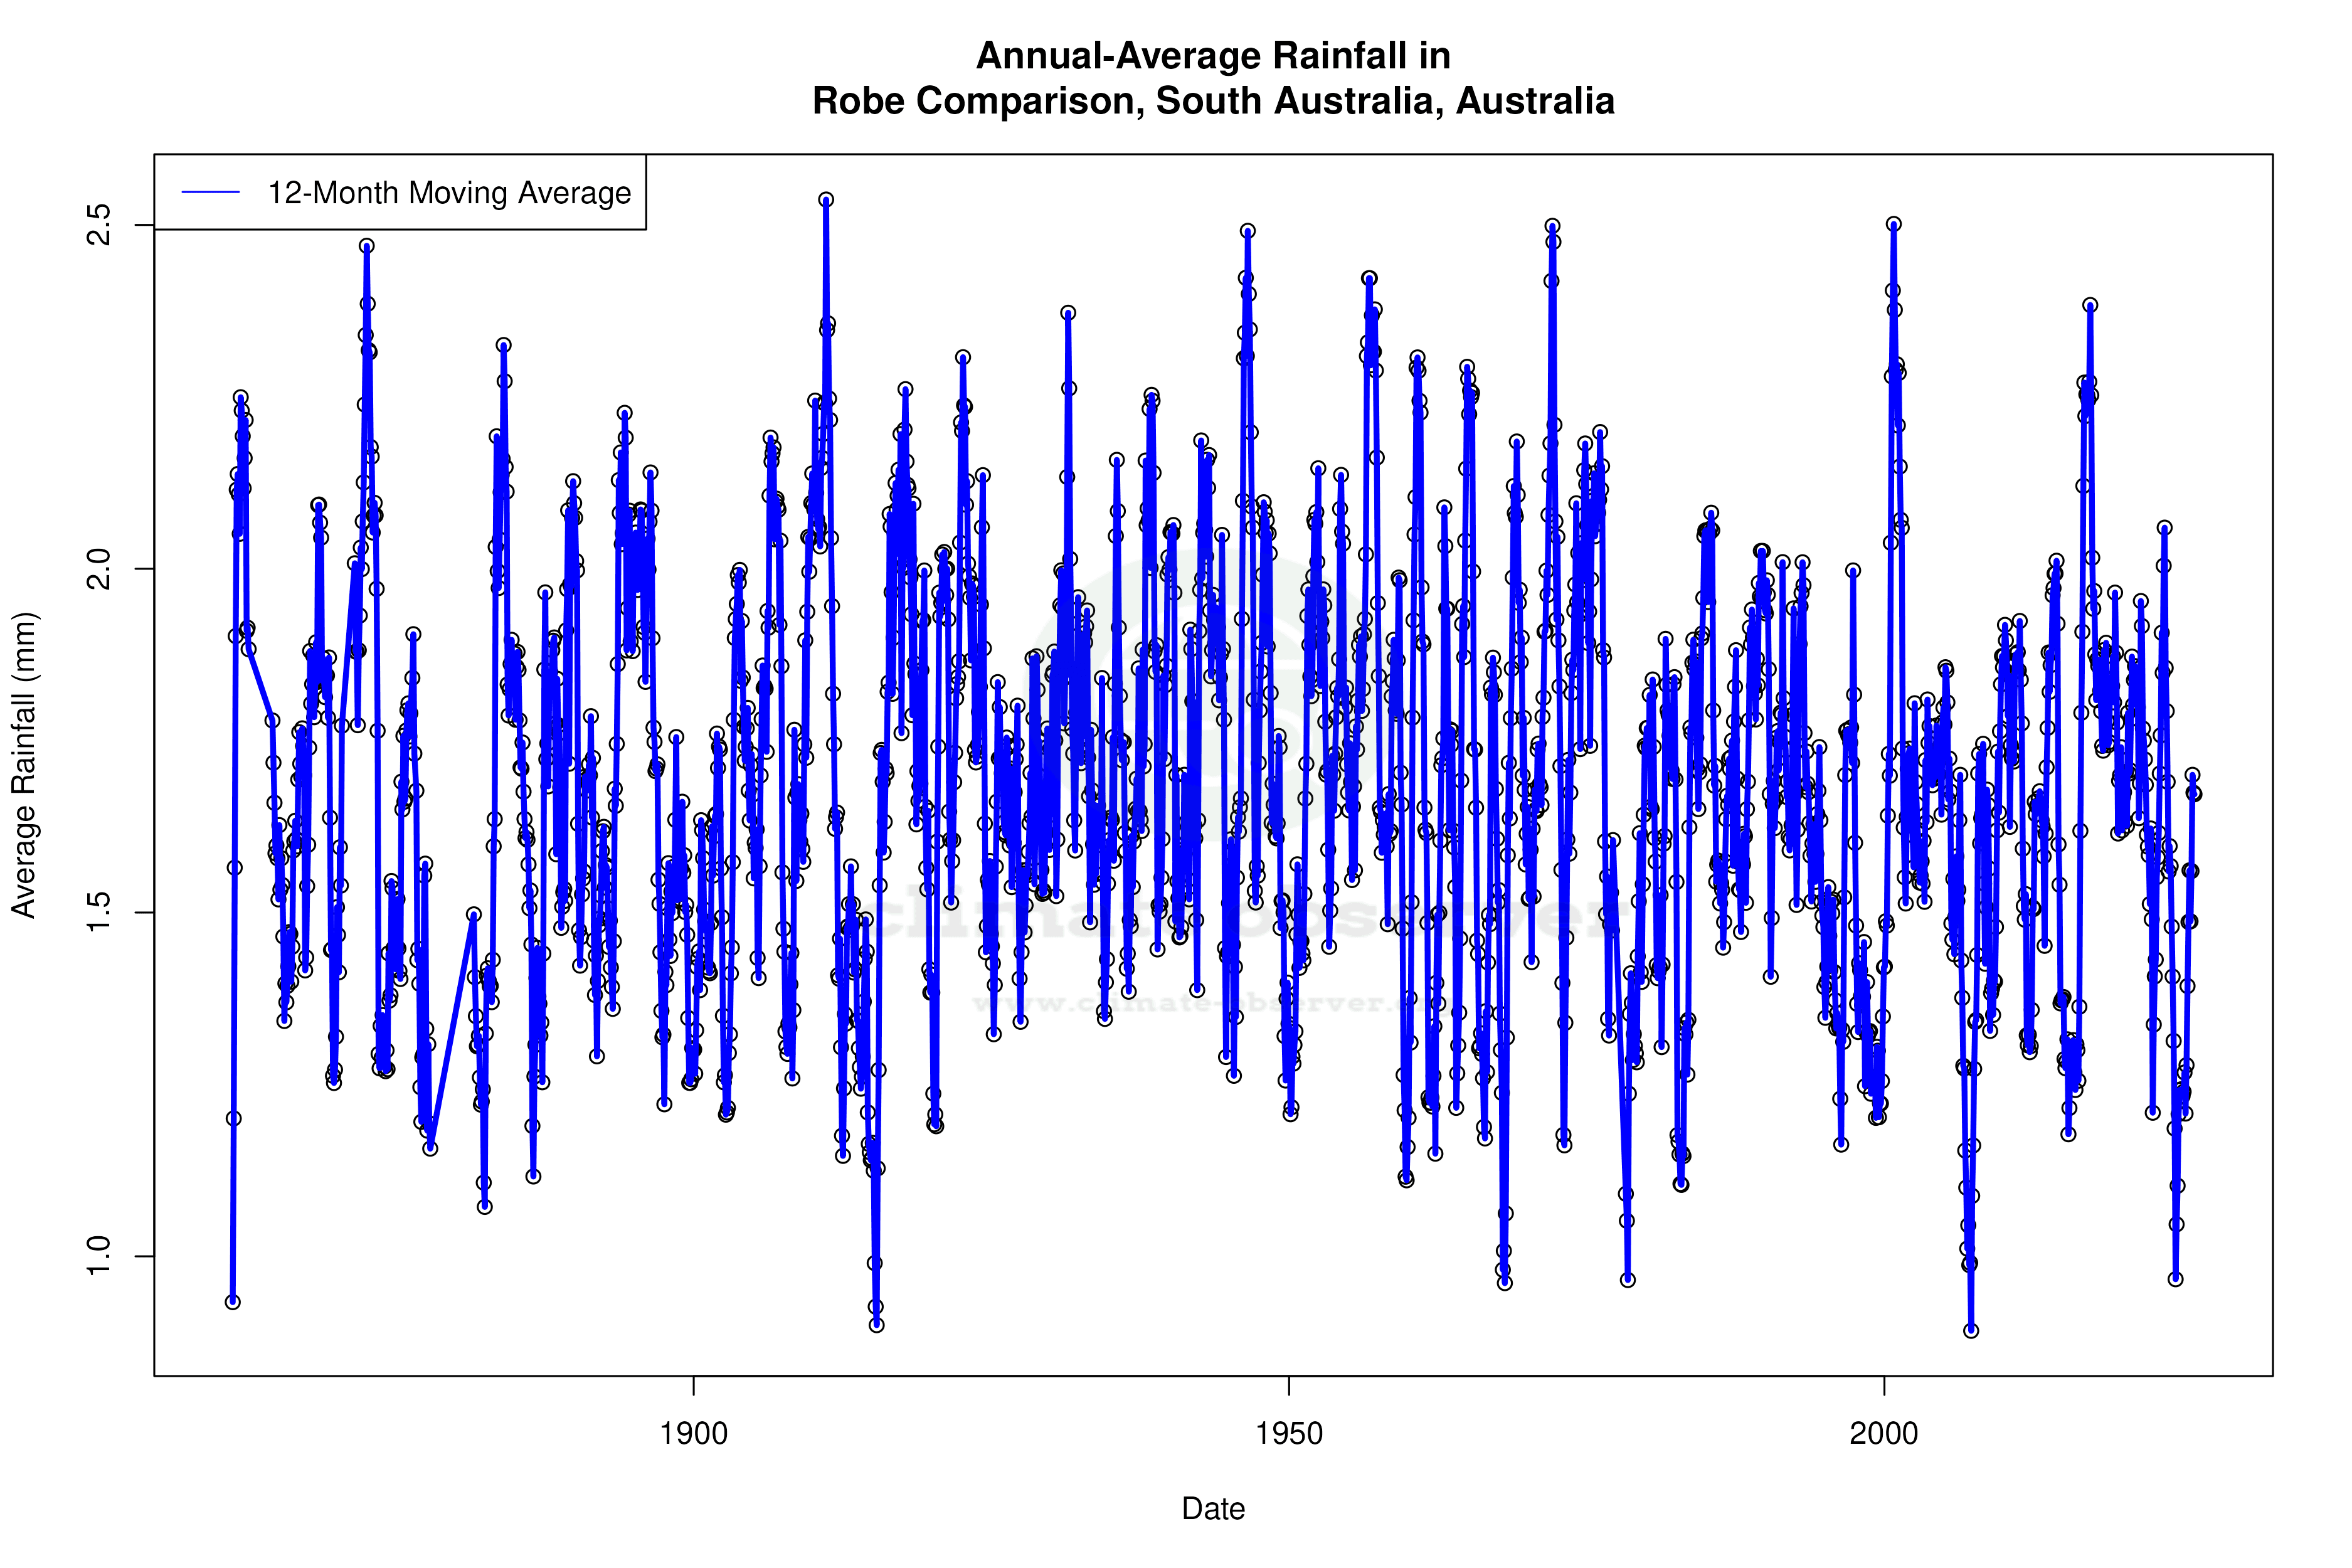
Precipitation Patterns and Changes
The Precipitation Concentration Index (PCI) for Robe has decreased from a baseline of 13.6 to a current value of 12.2. This indicates that precipitation is now more evenly distributed throughout the year, rather than being concentrated in fewer, more intense events. Such a shift could be beneficial for agriculture and water management, reducing the risk of flooding and drought. The change in PCI is slight but meaningful, reflecting a subtle shift in the region's precipitation dynamics.
Regional Climate Goals and Context
Australia's regional climate goals focus on adapting to and mitigating the impacts of climate change. In this context, Robe's climate trends offer both challenges and opportunities. The cooling trend in high temperatures over the past decade may provide temporary relief from heat stress, while the more even precipitation distribution could aid in water conservation efforts. However, the long-term warming trend remains a concern, aligning with broader national and global climate patterns.
Implications for Future Climate Adaptation
The data from Robe suggests that while immediate changes in temperature and precipitation patterns are occurring, the overarching trend remains one of warming. This necessitates continued monitoring and adaptation strategies to mitigate potential impacts on the local ecosystem and economy. The nuanced shifts in Robe's climate underscore the importance of tailored, region-specific climate action plans.
Station Statistics
10-Year Trend
High: -0.20 °C/decade
Low: -0.04 °C/decade
Rain: -0.61 mm/decade
25-Year Trend
High: +0.09 °C/decade
Low: -0.05 °C/decade
Rain: -0.01 mm/decade
50-Year Trend
High: +0.05 °C/decade
Low: +0.05 °C/decade
Rain: -0.00 mm/decade
All-Time Trend
High: +0.06 °C/decade
Low: +0.06 °C/decade
Rain: -0.00 mm/decade
Percentage Above-Average Days
Last 12 Months: 43.6%
This Year: 52.5%
Precipitation Concentration Index (PCI) ℹ️
Last 12 Months: 13.6
Historical Average: 14.6
Percentile Rank of Last 12 Months ℹ️
High: 92nd percentile
Low: 87th percentile
Rain: 25th percentile
Change in Variance ℹ️
High: +7.2%
Low: -1.5%
Intraday: -7.5%
Data Coverage
73.3%
First Year of Data
1870
Station Location
Historical Weather Records
| Max High | Avg High | Min High | Max Avg | Avg Avg | Min Avg | Max Low | Avg Low | Min Low | Max Precipitation | Avg Precipitation | Max Snow | Avg Snow | |
|---|---|---|---|---|---|---|---|---|---|---|---|---|---|
| Record | 39.6 °C | — | 6.5 °C | 32.8 °C | — | 5.3 °C | 26.0 °C | — | -2.8 °C | 93.2 mm | — | — | — |
| January | 39.3 °C | 22.6 °C | 13.6 °C | 32.8 °C | 19.8 °C | 13.1 °C | 26.0 °C | 13.7 °C | 4.1 °C | 68.1 mm | 0.6 mm | — | — |
| February | 39.6 °C | 22.6 °C | 12.7 °C | 31.5 °C | 19.8 °C | 12.8 °C | 25.0 °C | 13.7 °C | 2.7 °C | 74.4 mm | 0.6 mm | — | — |
| March | 35.8 °C | 21.2 °C | 14.2 °C | 29.1 °C | 18.2 °C | 12.1 °C | 22.8 °C | 12.8 °C | 3.3 °C | 56.1 mm | 0.8 mm | — | — |
| April | 31.7 °C | 18.9 °C | 11.7 °C | 25.4 °C | 15.7 °C | 10.4 °C | 20.8 °C | 11.6 °C | 2.2 °C | 50.8 mm | 1.5 mm | — | — |
| May | 26.5 °C | 16.4 °C | 9.4 °C | 21.0 °C | 13.3 °C | 7.8 °C | 17.8 °C | 10.2 °C | 0.8 °C | 67.6 mm | 2.3 mm | — | — |
| June | 20.4 °C | 14.3 °C | 8.5 °C | 17.0 °C | 11.2 °C | 6.3 °C | 15.0 °C | 8.7 °C | -2.8 °C | 49.3 mm | 3.2 mm | — | — |
| July | 19.5 °C | 13.6 °C | 8.3 °C | 15.8 °C | 10.5 °C | 5.3 °C | 14.4 °C | 8.2 °C | -2.6 °C | 63.5 mm | 3.4 mm | — | — |
| August | 22.1 °C | 14.3 °C | 6.5 °C | 16.0 °C | 11.0 °C | 6.0 °C | 15.0 °C | 8.5 °C | 0.2 °C | 41.0 mm | 2.7 mm | — | — |
| September | 26.6 °C | 15.7 °C | 7.1 °C | 20.6 °C | 12.3 °C | 7.4 °C | 17.9 °C | 9.3 °C | 0.8 °C | 49.5 mm | 2.0 mm | — | — |
| October | 32.2 °C | 17.6 °C | 10.6 °C | 24.8 °C | 13.9 °C | 8.8 °C | 19.2 °C | 10.3 °C | 2.1 °C | 33.8 mm | 1.4 mm | — | — |
| November | 36.3 °C | 19.6 °C | 11.6 °C | 29.1 °C | 16.2 °C | 9.6 °C | 21.7 °C | 11.5 °C | 3.3 °C | 46.6 mm | 1.0 mm | — | — |
| December | 37.1 °C | 21.3 °C | 13.2 °C | 29.5 °C | 18.0 °C | 11.4 °C | 23.0 °C | 12.7 °C | 3.9 °C | 93.2 mm | 0.9 mm | — | — |
Data Visualisations
Remove WatermarksCurrent Year Climate Trends vs Historical


Max Temperature this Year | 1 of 6
Climate 12-Month Moving Averages


Max Temperature 12-Month MA | 1 of 6
Daily Data Points and Averages Throughout the Year


Average Max Temperature Throughout Year | 1 of 5
