Climate for Station: Richmond Post Office, Queensland, Australia
Loading live weather...
Climate Analysis & Overview
Richmond, Queensland, experiences a unique climatic tapestry characterised by a long-term warming trend in low temperatures and a cooling trend in highs over the past decade. Precipitation has become slightly more evenly distributed, suggesting shifts in rainfall patterns.
Tropical Climate Dynamics
Richmond, located in Queensland, Australia, falls under the Köppen climate classification of BSh, indicating a hot semi-arid climate. This region, situated inland, is influenced by its distance from the coast and the absence of significant geographical barriers like mountains, which allows for more extreme temperature variations. The all-time temperature trends reveal a warming of 0.20°C (0.36°F) in low temperatures, while high temperatures have shown a marginal rise of 0.03°C (0.05°F). This suggests a gradual increase in baseline warmth, particularly during cooler periods.
Decadal Cooling and Warming Patterns
Over the past decade, Richmond has experienced contrasting temperature trends. High temperatures have shown a cooling of 2.78°C (5.00°F). Conversely, low temperatures have risen by 2.77°C (4.99°F). This divergence may indicate increased nocturnal warming, possibly due to changes in atmospheric conditions or land use. Such trends highlight the complexity of local climate dynamics, where short-term patterns may not always align with long-term trends.
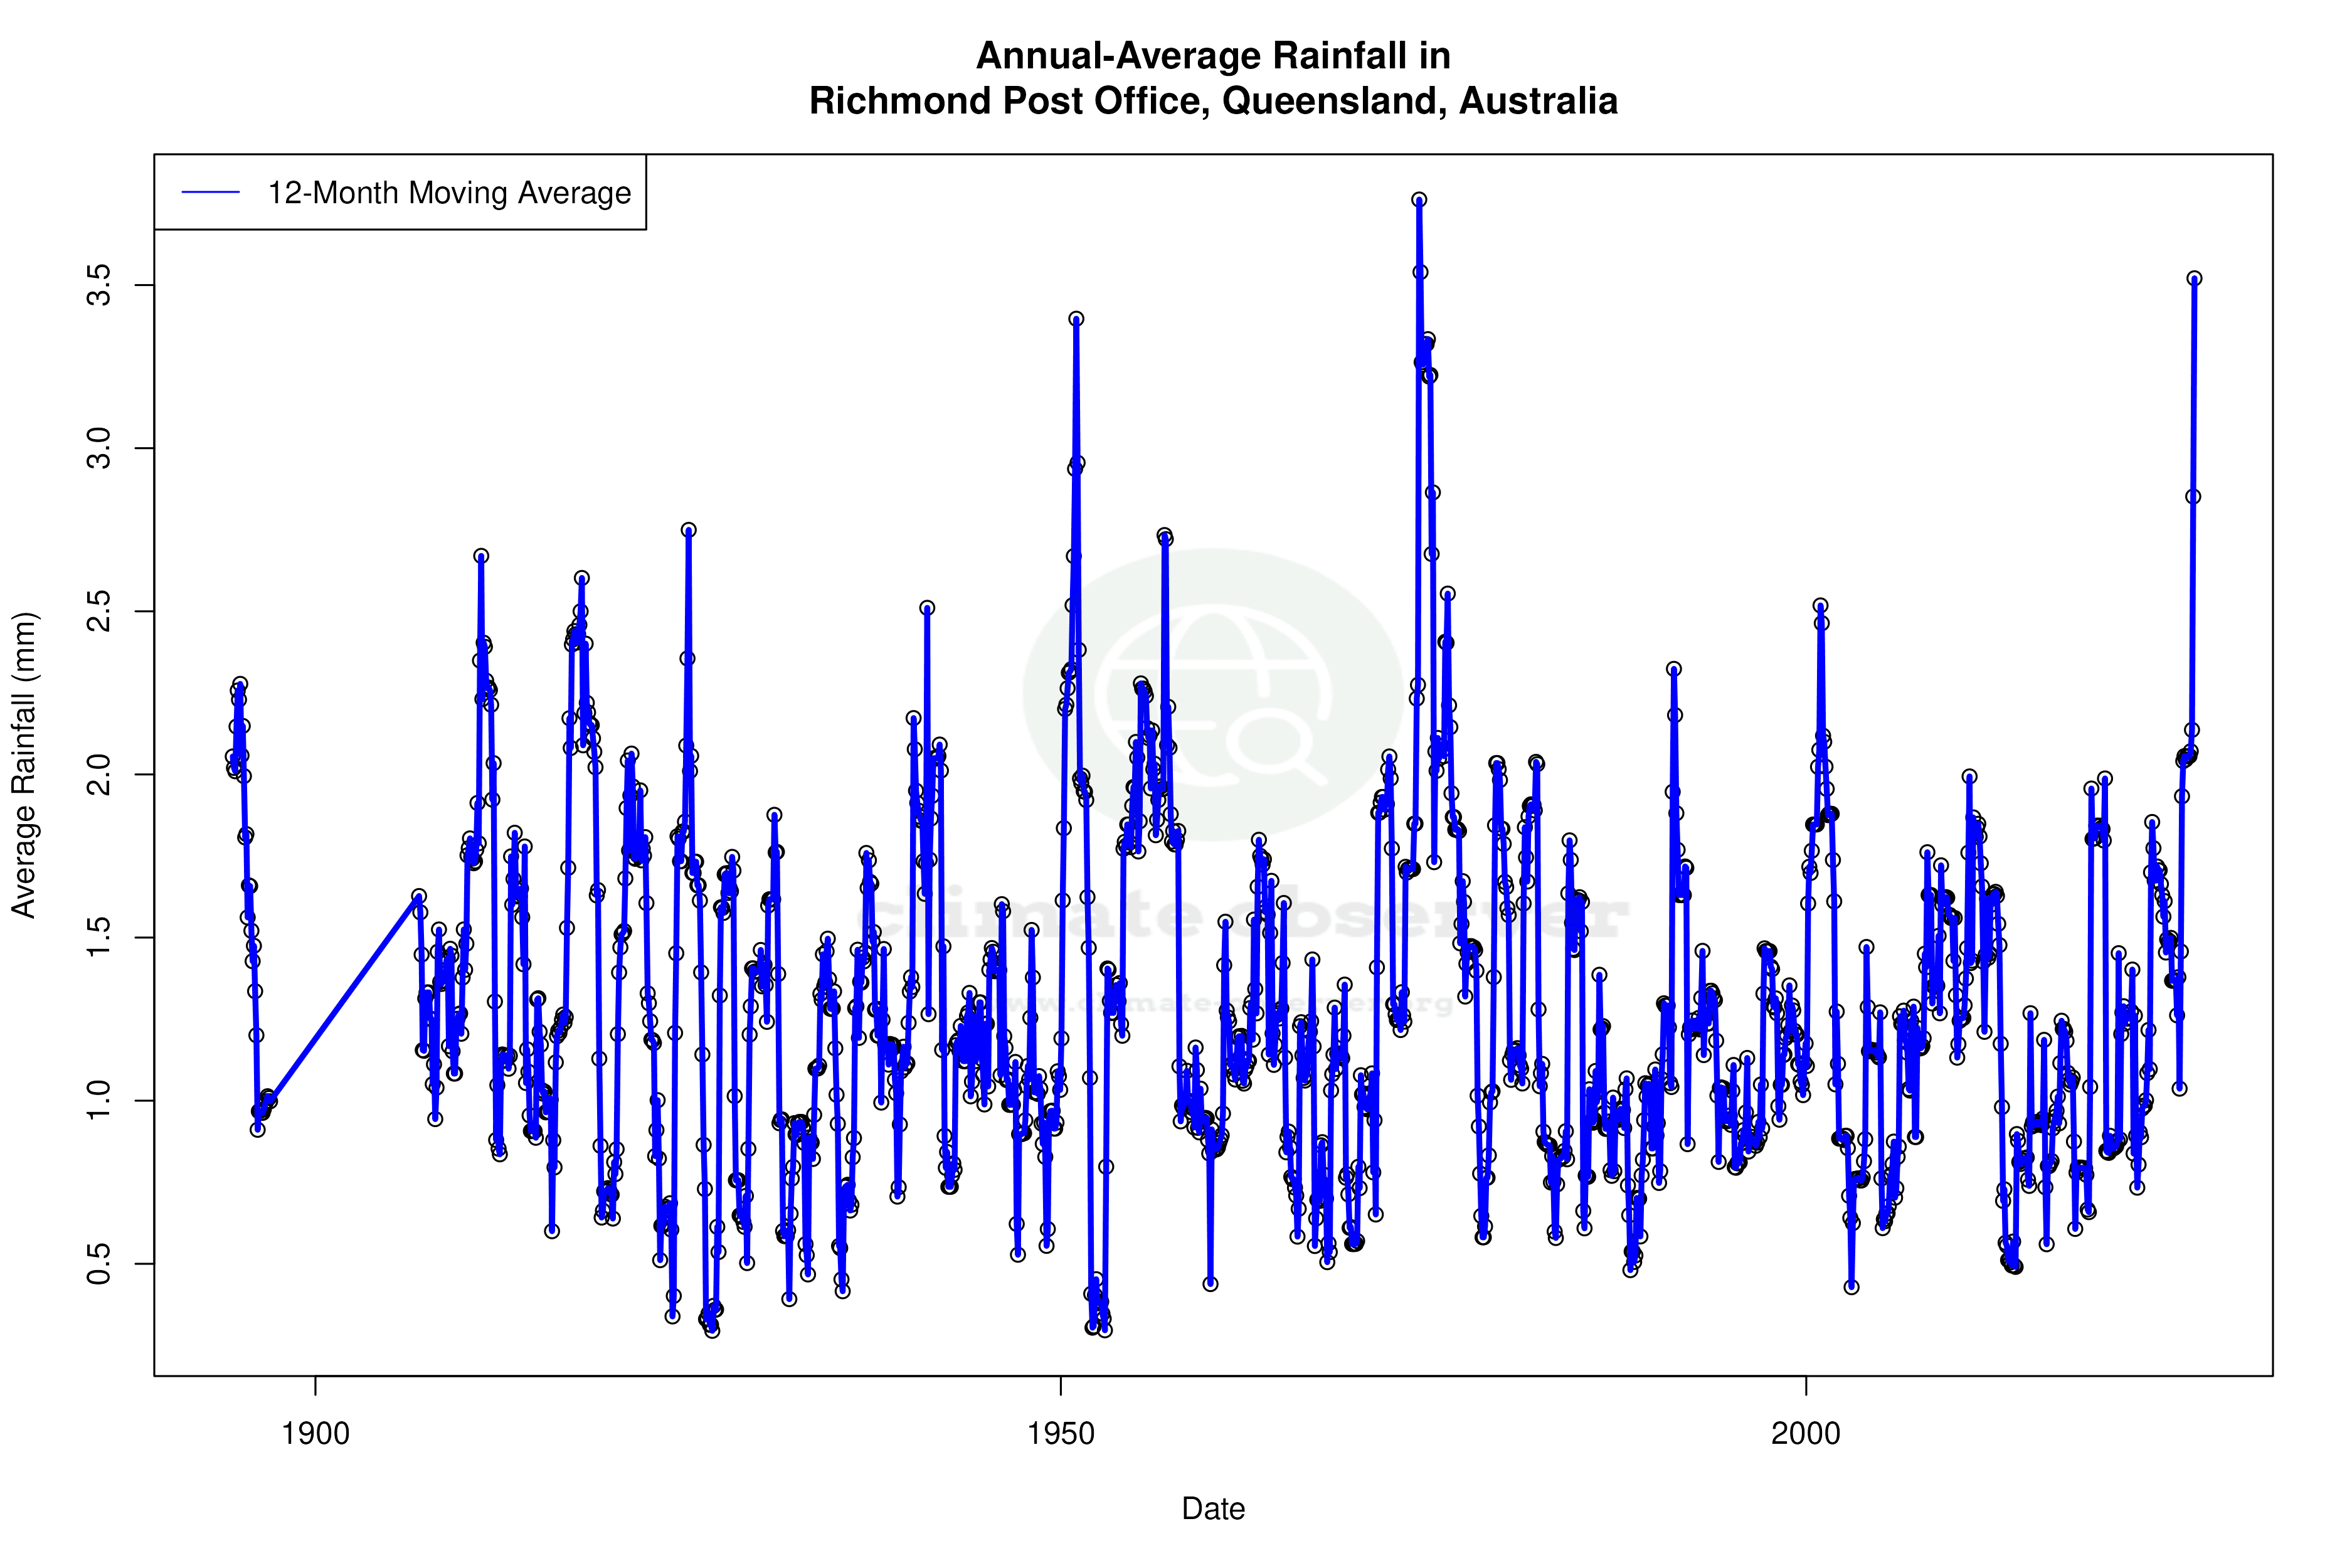
Precipitation Patterns and Distribution
The Precipitation Concentration Index (PCI) for Richmond has decreased from a baseline of 25.08 to 21.79, indicating a slightly more even distribution of rainfall events. A PCI above 20 suggests that precipitation is still highly concentrated, but the decrease points to a shift towards more frequent, less intense rainfall events. This change could have implications for agriculture and water management in the region, as more evenly distributed rainfall may benefit crop growth and reduce the risk of flooding.
Temperature Extremes and Records
Richmond's climate is marked by significant temperature extremes, with recorded highs reaching 46.0°C (114.8°F) and lows dropping to -2.5°C (27.5°F). These extremes underscore the region's vulnerability to both intense heat and unexpected cold snaps. Such variability is typical of semi-arid climates and requires adaptive strategies to mitigate the impacts on both human and ecological systems.
Regional Climate Considerations
Australia's broader climate goals, aimed at reducing carbon emissions and enhancing resilience to climate change, provide a backdrop to Richmond's local climate story. Recent weather events, including prolonged droughts and heatwaves, have underscored the urgency of these goals. Richmond's evolving climate patterns, with their mix of warming lows and cooling highs, reflect the broader challenges faced by the region in adapting to a changing climate landscape.
Station Statistics
10-Year Trend
High: -2.78 °C/decade
Low: +2.77 °C/decade
Rain: +1.04 mm/decade
25-Year Trend
High: -0.20 °C/decade
Low: +1.20 °C/decade
Rain: +0.14 mm/decade
50-Year Trend
High: -0.04 °C/decade
Low: +0.59 °C/decade
Rain: +0.02 mm/decade
All-Time Trend
High: +0.03 °C/decade
Low: +0.20 °C/decade
Rain: -0.01 mm/decade
Percentage Above-Average Days
Last 12 Months: 34.8%
This Year: 0.0%
Precipitation Concentration Index (PCI) ℹ️
Last 12 Months: 25.5
Historical Average: 29.4
Percentile Rank of Last 12 Months ℹ️
High: 12th percentile
Low: 98th percentile
Rain: 95th percentile
Change in Variance ℹ️
High: -5.0%
Low: -16.5%
Intraday: -8.4%
Data Coverage
80.4%
First Year of Data
1900
Station Location
Historical Weather Records
| Max High | Avg High | Min High | Max Avg | Avg Avg | Min Avg | Max Low | Avg Low | Min Low | Max Precipitation | Avg Precipitation | Max Snow | Avg Snow | |
|---|---|---|---|---|---|---|---|---|---|---|---|---|---|
| Record | 46.0 °C | — | 10.0 °C | 39.2 °C | — | 8.7 °C | 32.5 °C | — | -2.5 °C | 162.8 mm | — | — | — |
| January | 46.0 °C | 36.8 °C | 22.6 °C | 38.3 °C | 30.2 °C | 21.6 °C | 32.5 °C | 23.2 °C | 13.3 °C | 134.1 mm | 3.9 mm | — | — |
| February | 44.0 °C | 35.6 °C | 20.6 °C | 39.1 °C | 29.2 °C | 21.6 °C | 30.1 °C | 22.6 °C | 12.5 °C | 162.8 mm | 3.9 mm | — | — |
| March | 42.4 °C | 34.9 °C | 21.1 °C | 35.4 °C | 28.4 °C | 18.8 °C | 30.0 °C | 20.9 °C | 10.6 °C | 152.4 mm | 2.0 mm | — | — |
| April | 40.6 °C | 32.8 °C | 18.2 °C | 34.2 °C | 26.1 °C | 14.5 °C | 26.6 °C | 17.3 °C | 3.6 °C | 97.3 mm | 0.6 mm | — | — |
| May | 37.8 °C | 29.1 °C | 13.5 °C | 29.5 °C | 22.3 °C | 11.2 °C | 24.6 °C | 13.3 °C | 1.1 °C | 95.0 mm | 0.4 mm | — | — |
| June | 35.3 °C | 26.2 °C | 11.2 °C | 27.3 °C | 18.9 °C | 8.7 °C | 22.2 °C | 10.1 °C | -2.4 °C | 70.7 mm | 0.4 mm | — | — |
| July | 36.1 °C | 26.0 °C | 10.0 °C | 27.0 °C | 18.5 °C | 9.7 °C | 20.8 °C | 8.9 °C | -2.5 °C | 48.6 mm | 0.3 mm | — | — |
| August | 37.4 °C | 28.6 °C | 13.5 °C | 30.0 °C | 20.7 °C | 10.8 °C | 22.2 °C | 10.3 °C | -1.1 °C | 51.3 mm | 0.1 mm | — | — |
| September | 40.3 °C | 32.4 °C | 16.0 °C | 35.0 °C | 24.9 °C | 14.1 °C | 26.3 °C | 14.2 °C | 2.2 °C | 41.7 mm | 0.2 mm | — | — |
| October | 43.3 °C | 35.9 °C | 22.0 °C | 36.3 °C | 28.6 °C | 15.9 °C | 29.9 °C | 18.3 °C | 4.4 °C | 66.0 mm | 0.4 mm | — | — |
| November | 45.5 °C | 37.6 °C | 23.3 °C | 39.2 °C | 30.2 °C | 20.5 °C | 31.4 °C | 21.1 °C | 7.3 °C | 87.6 mm | 1.1 mm | — | — |
| December | 45.6 °C | 38.1 °C | 22.3 °C | 38.6 °C | 31.0 °C | 22.3 °C | 32.2 °C | 22.7 °C | 10.2 °C | 149.4 mm | 2.4 mm | — | — |
Data Visualisations
Remove WatermarksCurrent Year Climate Trends vs Historical


Max Temperature this Year | 1 of 6
Climate 12-Month Moving Averages


Max Temperature 12-Month MA | 1 of 6
Daily Data Points and Averages Throughout the Year


Average Max Temperature Throughout Year | 1 of 5
