Climate for Station: Camooweal Township, Queensland, Australia
Loading live weather...
Climate Analysis & Overview
Camooweal Township, located in the arid expanse of Queensland, Australia, exhibits a complex climate narrative characterised by long-term warming trends despite recent cooling. The region's precipitation patterns are becoming slightly more even, which may influence local water resource management strategies.
Arid Climate Dynamics
Camooweal is situated within the Köppen climate classification of BWh, indicating a hot desert climate. This classification is reflective of its geographic position in the interior of Queensland, far from moderating coastal influences. The local climate is shaped by its expansive flatlands, which allow for significant temperature fluctuations. Over the all-time record, Camooweal has experienced a warming trend with highs rising by 0.18°C (0.32°F) and lows by 0.12°C (0.22°F). However, the past decade has seen a reversal, with a cooling trend of -0.68°C (-1.22°F) for highs and -0.81°C (-1.46°F) for lows. These contrasting trends highlight the region's dynamic thermal oscillations.
Temperature Extremes and Records
The township's temperature records underscore its extreme climate. The highest recorded temperature is an intense 46.6°C (115.9°F), while the lowest dips to a chilly -2.2°C (28.0°F). Such extremes are typical of desert climates where daytime heating and nighttime cooling are pronounced due to the lack of moisture in the air. These records are critical for understanding the potential stress on local ecosystems and infrastructure.
Precipitation Patterns and Distribution
The Precipitation Concentration Index (PCI) for Camooweal provides insight into rainfall distribution. A PCI value over 20 indicates highly concentrated rainfall events. The baseline PCI was 24.7, whereas the current PCI is 23.7, indicating a slight decrease. This suggests that rainfall is becoming marginally more evenly distributed, which could have implications for water management and agricultural practices in the region. Even small shifts in precipitation patterns can significantly impact the local environment, especially in arid zones.
Regional Climate Implications
Australia's commitment to addressing climate change includes managing its diverse and often extreme climate zones. Camooweal's climate profile, with its recent cooling trend and slightly more even rainfall distribution, may offer insights into broader regional climate shifts. These changes could inform adaptation strategies, particularly in water conservation and land use planning, aligning with national goals for sustainable development.
Localised Thermal Trends
Despite the overarching warming trend over the long term, the recent decade's cooling in Camooweal is noteworthy. This cooling could be attributed to natural variability or regional climatic influences, such as changes in vegetation cover or atmospheric circulation patterns. Understanding these localised trends is essential for developing targeted climate adaptation measures that consider both historical and recent climate data.
Station Statistics
10-Year Trend
High: -0.74 °C/decade
Low: -0.80 °C/decade
Rain: +0.69 mm/decade
25-Year Trend
High: +0.15 °C/decade
Low: +0.31 °C/decade
Rain: +0.15 mm/decade
50-Year Trend
High: +0.12 °C/decade
Low: -0.01 °C/decade
Rain: +0.08 mm/decade
All-Time Trend
High: +0.18 °C/decade
Low: +0.12 °C/decade
Rain: +0.00 mm/decade
Percentage Above-Average Days
Last 12 Months: 46.8%
This Year: 12.5%
Precipitation Concentration Index (PCI) ℹ️
Last 12 Months: 23.3
Historical Average: 27.3
Percentile Rank of Last 12 Months ℹ️
High: 89th percentile
Low: 65th percentile
Rain: 63rd percentile
Change in Variance ℹ️
High: -2.5%
Low: +5.3%
Intraday: +21.7%
Data Coverage
65.2%
First Year of Data
1892
Station Location
Historical Weather Records
| Max High | Avg High | Min High | Max Avg | Avg Avg | Min Avg | Max Low | Avg Low | Min Low | Max Precipitation | Avg Precipitation | Max Snow | Avg Snow | |
|---|---|---|---|---|---|---|---|---|---|---|---|---|---|
| Record | 46.6 °C | — | 9.8 °C | 38.6 °C | — | 8.8 °C | 33.3 °C | — | -2.2 °C | 226.1 mm | — | — | — |
| January | 46.0 °C | 37.5 °C | 24.0 °C | 38.5 °C | 30.8 °C | 22.8 °C | 33.3 °C | 24.5 °C | 13.5 °C | 226.1 mm | 3.0 mm | — | — |
| February | 45.5 °C | 36.4 °C | 18.9 °C | 36.7 °C | 29.8 °C | 19.2 °C | 30.0 °C | 23.8 °C | 12.0 °C | 109.4 mm | 3.2 mm | — | — |
| March | 43.2 °C | 35.5 °C | 20.7 °C | 35.9 °C | 28.5 °C | 20.1 °C | 30.5 °C | 22.0 °C | 10.0 °C | 191.3 mm | 1.9 mm | — | — |
| April | 40.1 °C | 33.4 °C | 18.7 °C | 33.8 °C | 26.2 °C | 15.2 °C | 27.5 °C | 18.3 °C | 4.4 °C | 68.3 mm | 0.4 mm | — | — |
| May | 38.4 °C | 29.3 °C | 13.3 °C | 31.1 °C | 22.1 °C | 12.3 °C | 23.9 °C | 13.6 °C | 1.7 °C | 70.4 mm | 0.3 mm | — | — |
| June | 35.6 °C | 26.2 °C | 9.8 °C | 26.4 °C | 18.4 °C | 8.8 °C | 22.0 °C | 9.8 °C | -2.2 °C | 56.6 mm | 0.3 mm | — | — |
| July | 35.7 °C | 26.1 °C | 10.7 °C | 27.3 °C | 17.9 °C | 10.2 °C | 21.8 °C | 8.9 °C | -0.3 °C | 76.7 mm | 0.2 mm | — | — |
| August | 38.4 °C | 28.7 °C | 15.0 °C | 29.4 °C | 20.5 °C | 11.2 °C | 22.4 °C | 10.9 °C | 0.0 °C | 53.3 mm | 0.1 mm | — | — |
| September | 41.0 °C | 32.7 °C | 15.2 °C | 34.0 °C | 25.3 °C | 15.0 °C | 26.6 °C | 15.5 °C | 3.9 °C | 36.3 mm | 0.2 mm | — | — |
| October | 44.0 °C | 36.2 °C | 19.4 °C | 35.8 °C | 29.1 °C | 17.6 °C | 31.1 °C | 19.8 °C | 5.7 °C | 65.3 mm | 0.4 mm | — | — |
| November | 44.5 °C | 37.8 °C | 23.3 °C | 37.5 °C | 30.9 °C | 19.9 °C | 30.6 °C | 22.6 °C | 7.5 °C | 130.0 mm | 1.0 mm | — | — |
| December | 46.6 °C | 38.3 °C | 21.7 °C | 38.6 °C | 31.6 °C | 22.7 °C | 31.4 °C | 24.1 °C | 14.4 °C | 116.3 mm | 2.0 mm | — | — |
Data Visualisations
Remove WatermarksCurrent Year Climate Trends vs Historical


Max Temperature this Year | 1 of 6
Climate 12-Month Moving Averages


Max Temperature 12-Month MA | 1 of 6
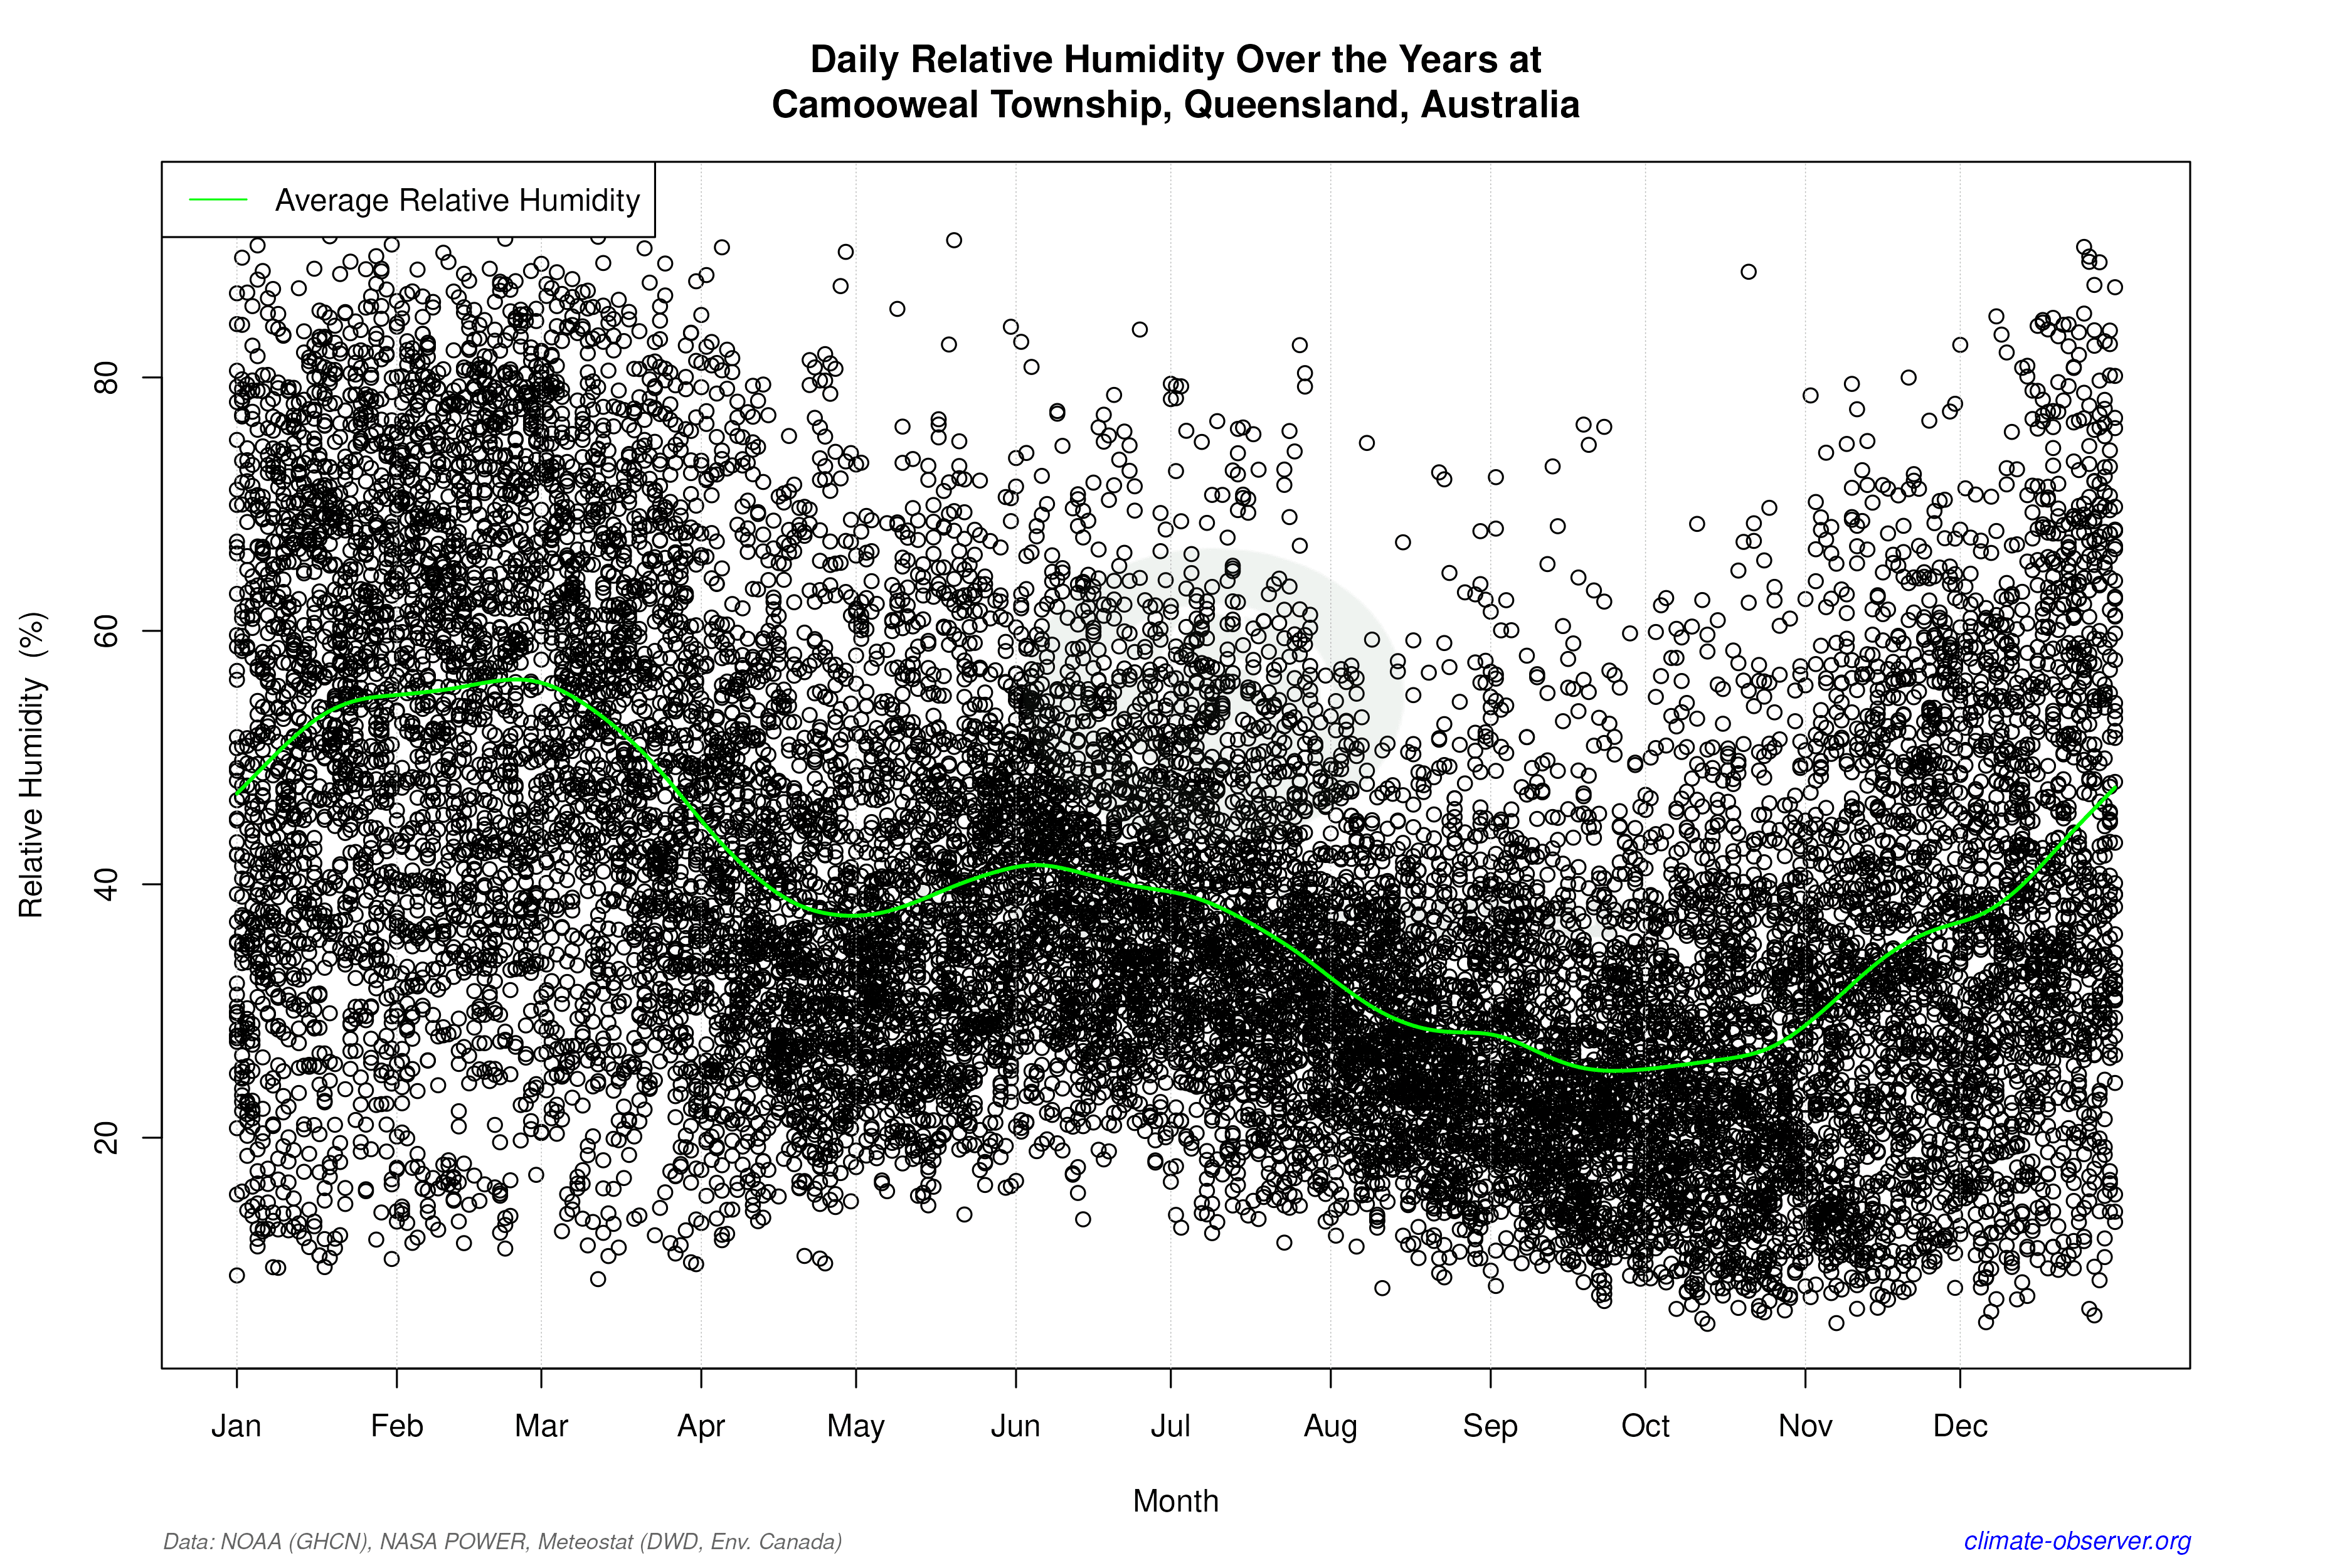
Daily Data Points and Averages Throughout the Year


Average Max Temperature Throughout Year | 1 of 5
