Climate for Station: Maryborough, Queensland, Australia
Loading live weather...
Climate Analysis & Overview
Maryborough, located in Queensland, Australia, exhibits a complex climatic profile with contrasting temperature trends over different time scales. While the all-time data reveals a slight warming, recent years have shown a cooling trend in maximum temperatures. Precipitation patterns have become more evenly distributed, indicating a shift towards less concentrated rainfall events.
Subtropical Climate Dynamics
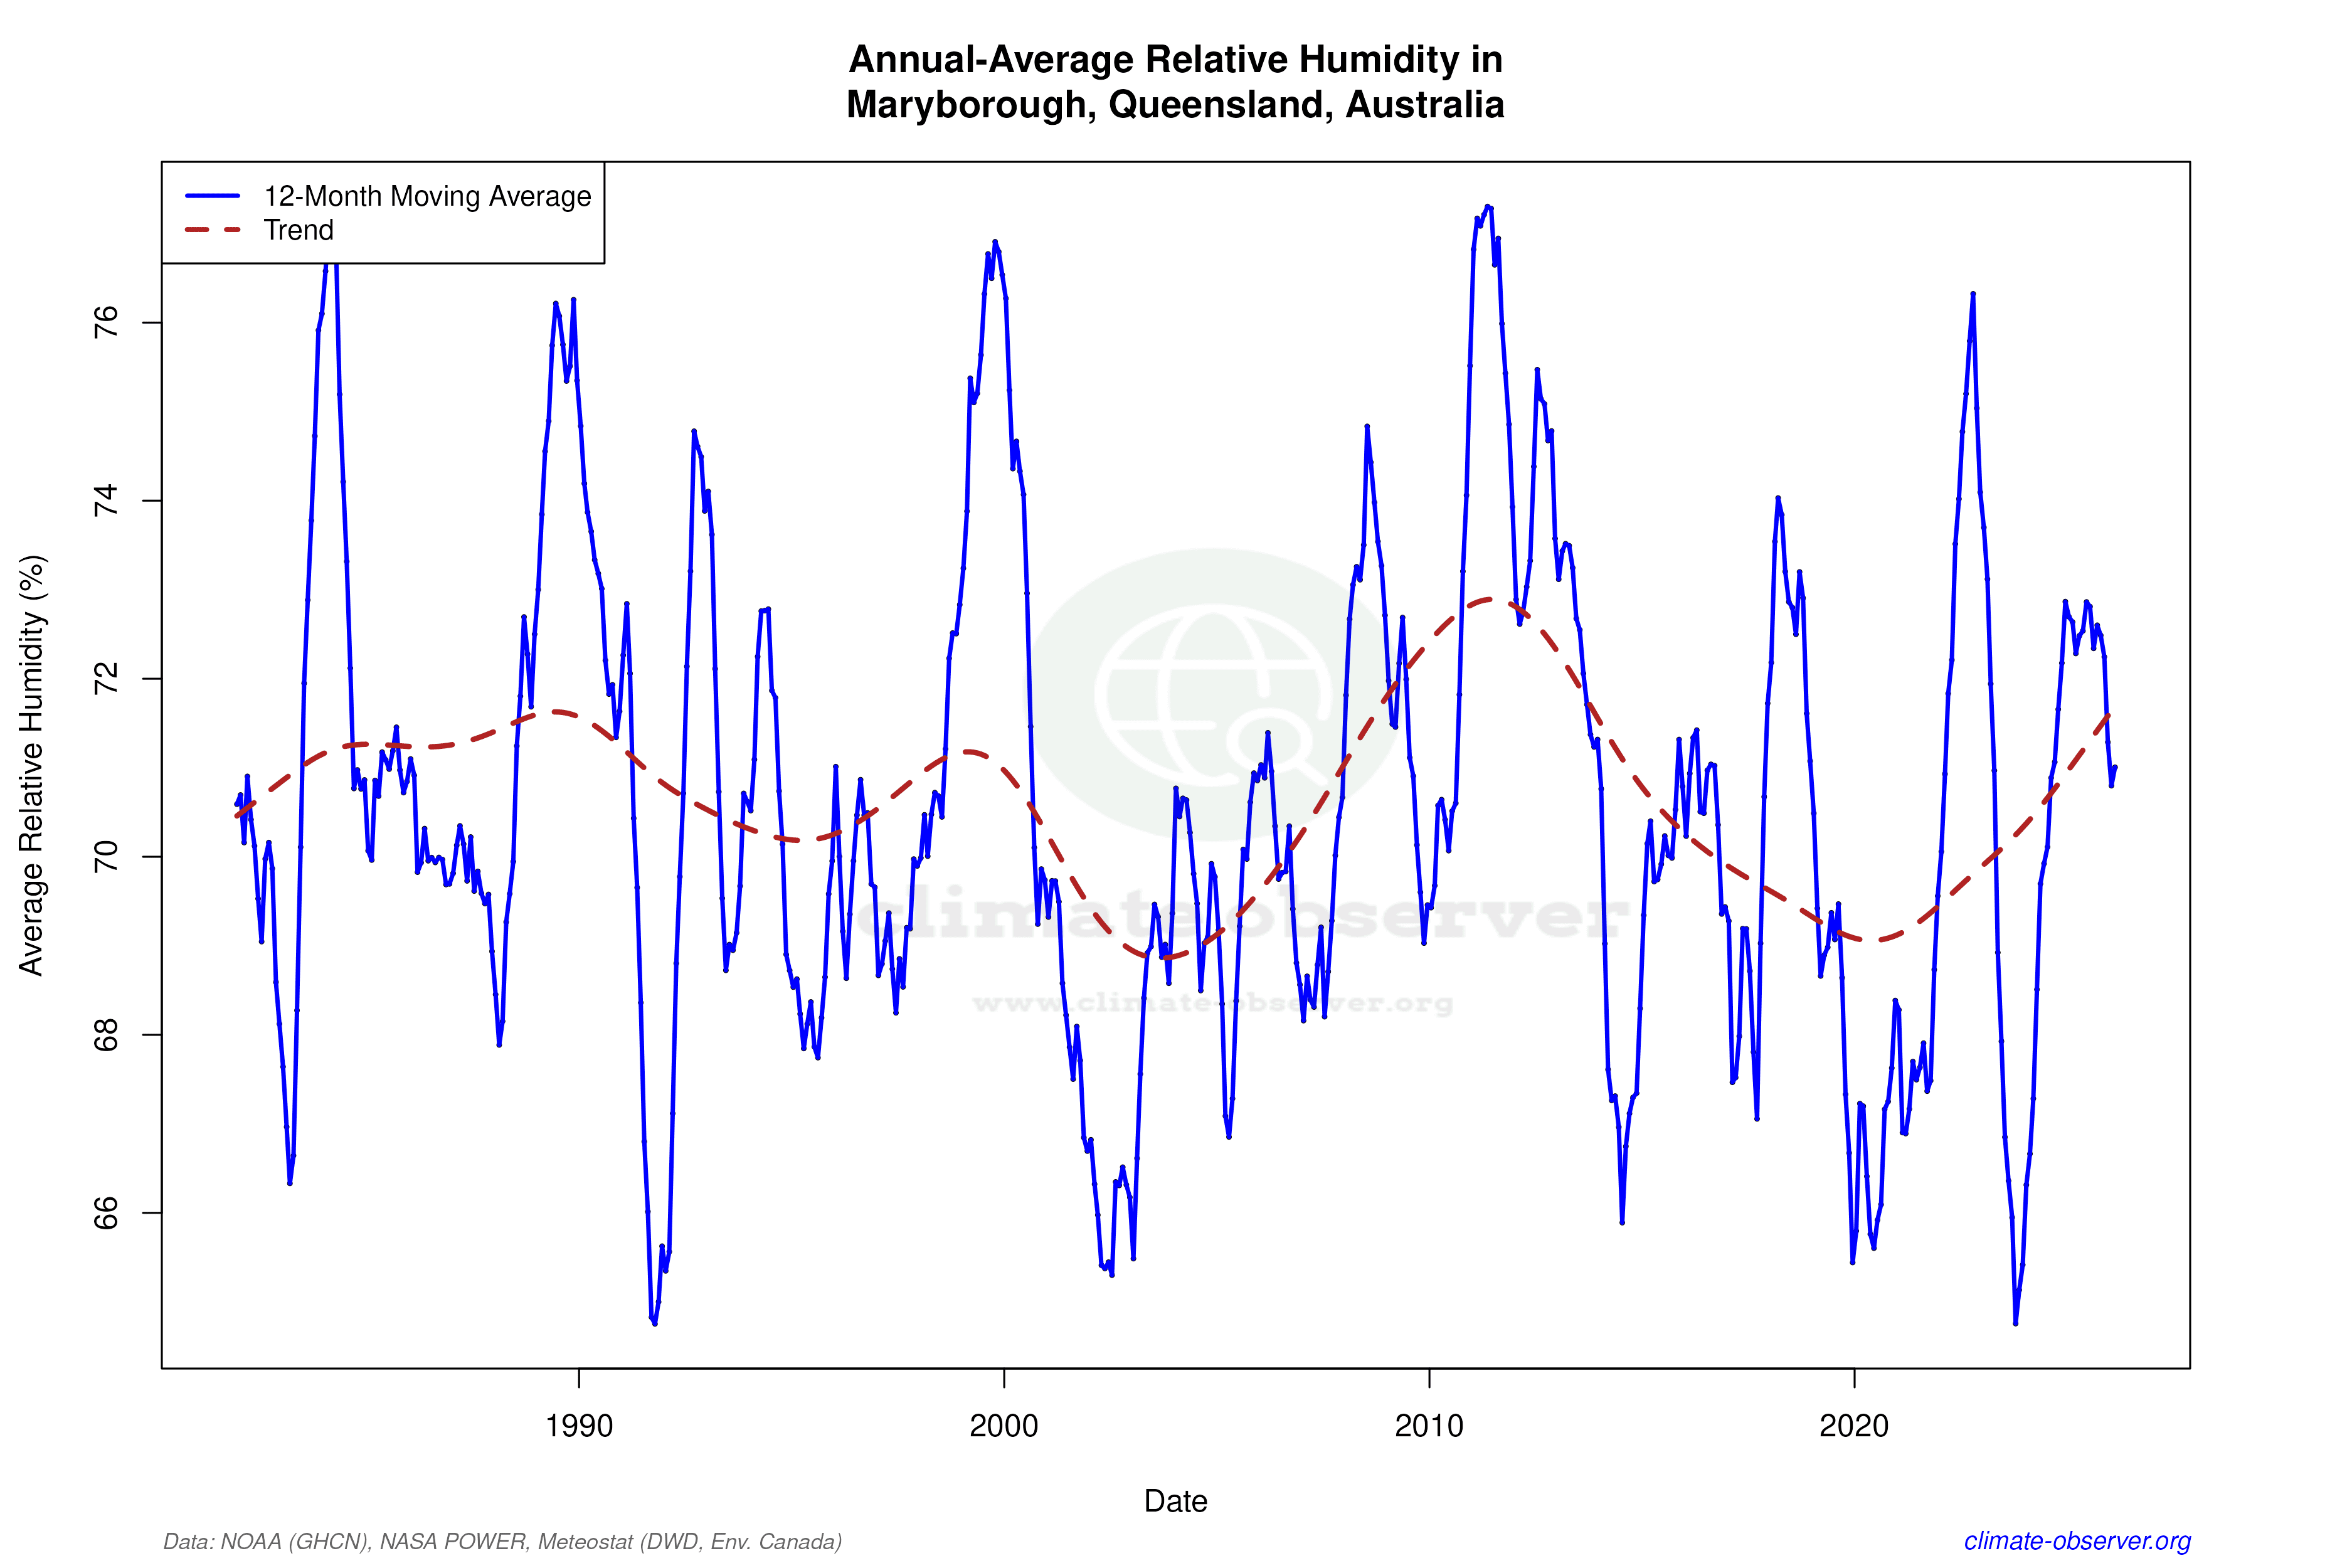
Maryborough is situated within a humid subtropical climate zone, characterised by hot, humid summers and mild winters. The region's proximity to the coast influences its weather patterns, often moderating extreme temperatures. The all-time temperature trends at Maryborough Airport reveal a slight warming, with highs increasing by 0.24°C (0.43°F) and lows rising by 0.14°C (0.25°F). However, the last decade tells a different story, with maximum temperatures experiencing a cooling trend of -0.96°C (-1.73°F), while minimum temperatures have warmed by 0.49°C (0.88°F). This divergence suggests a complex interplay of regional climatic factors.
Temperature Extremes and Records
Maryborough has experienced notable temperature extremes, with record highs reaching 40.6°C (105.1°F) and lows dipping to -1.4°C (29.5°F). These records highlight the potential for significant thermal variability within the region. The recent cooling trend in maximum temperatures over the past decade contrasts with the long-term warming pattern, indicating potential influences from broader climatic phenomena or localised weather events.
Precipitation Patterns and Distribution
The Precipitation Concentration Index (PCI) offers insights into the distribution of rainfall events. A decrease from a baseline of 14.10 to a current value of 10.99 suggests that rainfall in Maryborough has become more evenly distributed over time. This shift towards less concentrated precipitation events could have implications for water management and agricultural practices in the region, as more evenly distributed rainfall can reduce the risk of flooding and improve soil moisture retention.
Regional Climate Considerations
Maryborough's climatic trends must be considered within the broader context of Australia's climate goals and recent weather events. The nation has been focusing on strategies to mitigate the impacts of climate change, including efforts to reduce greenhouse gas emissions and enhance climate resilience. Recent weather patterns, such as prolonged droughts and intense heatwaves, underscore the importance of understanding local climate dynamics to inform policy and planning.
Interpreting the Data
The contrasting temperature trends over different time scales at Maryborough Airport highlight the importance of nuanced climate analysis. While the all-time data suggests a gradual warming, the recent decade's cooling in maximum temperatures points to potential short-term variability. Understanding these patterns is crucial for developing adaptive strategies to address the challenges posed by climate change in the region.
Station Statistics
10-Year Trend
High: -1.14 °C/decade
Low: +0.56 °C/decade
Rain: +0.80 mm/decade
25-Year Trend
High: +0.22 °C/decade
Low: -0.11 °C/decade
Rain: +0.07 mm/decade
50-Year Trend
High: +0.16 °C/decade
Low: +0.08 °C/decade
Rain: +0.06 mm/decade
All-Time Trend
High: +0.23 °C/decade
Low: +0.14 °C/decade
Rain: -0.04 mm/decade
Percentage Above-Average Days
Last 12 Months: 49.3%
This Year: 34.8%
Precipitation Concentration Index (PCI) ℹ️
Last 12 Months: 13.9
Historical Average: 14.8
Percentile Rank of Last 12 Months ℹ️
High: 72nd percentile
Low: 82nd percentile
Rain: 50th percentile
Change in Variance ℹ️
High: -3.4%
Low: -1.0%
Intraday: +5.3%
Data Coverage
54.5%
First Year of Data
1878
Station Location
Historical Weather Records
| Max High | Avg High | Min High | Max Avg | Avg Avg | Min Avg | Max Low | Avg Low | Min Low | Max Precipitation | Avg Precipitation | Max Snow | Avg Snow | |
|---|---|---|---|---|---|---|---|---|---|---|---|---|---|
| Record | 40.6 °C | — | 11.9 °C | 31.7 °C | — | 8.5 °C | 27.7 °C | — | -1.4 °C | 359.9 mm | — | — | — |
| January | 39.6 °C | 30.7 °C | 19.4 °C | 31.3 °C | 25.6 °C | 21.3 °C | 27.7 °C | 20.8 °C | 13.3 °C | 250.7 mm | 5.1 mm | — | — |
| February | 38.8 °C | 30.3 °C | 21.3 °C | 30.7 °C | 25.1 °C | 20.6 °C | 26.5 °C | 20.8 °C | 14.4 °C | 359.9 mm | 6.0 mm | — | — |
| March | 38.0 °C | 29.3 °C | 21.7 °C | 29.4 °C | 23.9 °C | 18.9 °C | 25.5 °C | 19.6 °C | 11.8 °C | 344.4 mm | 4.9 mm | — | — |
| April | 34.0 °C | 27.4 °C | 17.8 °C | 27.5 °C | 21.6 °C | 13.8 °C | 24.5 °C | 16.9 °C | 6.2 °C | 167.6 mm | 2.8 mm | — | — |
| May | 31.5 °C | 24.7 °C | 15.8 °C | 24.4 °C | 18.8 °C | 10.6 °C | 21.7 °C | 13.4 °C | 1.9 °C | 202.2 mm | 2.4 mm | — | — |
| June | 29.7 °C | 22.4 °C | 11.9 °C | 21.9 °C | 16.1 °C | 8.5 °C | 19.4 °C | 10.3 °C | -0.6 °C | 209.0 mm | 2.0 mm | — | — |
| July | 30.1 °C | 22.1 °C | 12.2 °C | 22.3 °C | 15.5 °C | 8.5 °C | 21.7 °C | 8.6 °C | -1.4 °C | 137.2 mm | 1.6 mm | — | — |
| August | 33.1 °C | 23.6 °C | 13.2 °C | 24.6 °C | 16.7 °C | 9.5 °C | 19.5 °C | 9.4 °C | -0.8 °C | 102.6 mm | 1.2 mm | — | — |
| September | 34.7 °C | 25.9 °C | 16.9 °C | 28.3 °C | 19.4 °C | 13.4 °C | 22.0 °C | 12.1 °C | 1.5 °C | 85.1 mm | 1.3 mm | — | — |
| October | 39.4 °C | 27.7 °C | 18.2 °C | 28.7 °C | 21.8 °C | 15.2 °C | 23.6 °C | 15.4 °C | 4.6 °C | 283.7 mm | 2.3 mm | — | — |
| November | 38.6 °C | 29.1 °C | 19.4 °C | 29.5 °C | 23.5 °C | 17.9 °C | 25.1 °C | 17.9 °C | 6.6 °C | 126.0 mm | 2.8 mm | — | — |
| December | 40.6 °C | 30.4 °C | 21.1 °C | 31.7 °C | 24.9 °C | 17.5 °C | 26.3 °C | 19.7 °C | 11.6 °C | 193.8 mm | 4.2 mm | — | — |
Data Visualisations
Remove WatermarksCurrent Year Climate Trends vs Historical


Max Temperature this Year | 1 of 6
Climate 12-Month Moving Averages


Max Temperature 12-Month MA | 1 of 6
Daily Data Points and Averages Throughout the Year


Average Max Temperature Throughout Year | 1 of 5
