Climate for Station: Hobart (Ellerslie Road), Tasmania, Australia
Loading live weather...
Climate Analysis & Overview
Hobart's climate at Ellerslie Road is experiencing a complex interplay of cooling and warming trends. The all-time data suggests a slight warming, while recent decades have shown a cooling pattern. Precipitation is becoming more evenly distributed, indicating a shift in rainfall patterns.
A Tale of Two Trends
Hobart, located on the southeastern coast of Tasmania, is classified under the Köppen climate system as Cfb, indicating a temperate oceanic climate. This classification is influenced by its proximity to the Southern Ocean, which moderates temperatures and contributes to the region's overall mild climate. The all-time temperature trends at Ellerslie Road reveal a modest warming, with highs increasing by 0.09°C (0.16°F) and lows by 0.10°C (0.18°F). However, the last decade tells a different story, with a cooling trend observed: highs have decreased by 0.19°C (0.34°F) and lows by 0.09°C (0.16°F). This divergence suggests that while long-term warming is evident, recent years have seen a temporary cooling phase.
Precipitation Patterns Evolving
The Precipitation Concentration Index (PCI) provides insight into how rainfall is distributed throughout the year. A decrease from a baseline of 11.1 to a current value of 9.9 indicates that precipitation is becoming more evenly distributed across the year. This shift suggests fewer intense rainfall events, which could be beneficial for agriculture and water management in the region. The PCI, being below 10, signifies a very even distribution, which aligns with the broader goals of Australia's climate strategies to manage water resources effectively.
Temperature Extremes in Context
Hobart's temperature records highlight the extremes that can occur in this temperate climate. The highest recorded temperature at Ellerslie Road is 41.8°C (107.2°F), while the lowest is -2.8°C (27.0°F). These extremes underscore the variability inherent in Hobart's climate, influenced by both oceanic and atmospheric conditions. Such records are crucial for understanding the potential impacts of climate change on local weather patterns and preparing for future climatic events.
Regional Climate Considerations
The local geography of Hobart, with its coastal location and proximity to the Derwent River, plays a significant role in shaping its climate. The oceanic influence tends to moderate temperatures, reducing the likelihood of extreme heat or cold compared to inland areas. This moderation is reflected in the relatively narrow range of temperature extremes. Recent weather events, such as increased rainfall variability, align with the broader trends observed in southern Australia, where climate change is expected to alter precipitation patterns and increase the frequency of extreme weather events.
Station Statistics
10-Year Trend
High: -0.34 °C/decade
Low: -0.13 °C/decade
Rain: +0.03 mm/decade
25-Year Trend
High: +0.40 °C/decade
Low: +0.22 °C/decade
Rain: -0.00 mm/decade
50-Year Trend
High: +0.26 °C/decade
Low: +0.13 °C/decade
Rain: -0.00 mm/decade
All-Time Trend
High: +0.09 °C/decade
Low: +0.10 °C/decade
Rain: -0.02 mm/decade
Percentage Above-Average Days
Last 12 Months: 47.4%
This Year: 51.3%
Precipitation Concentration Index (PCI) ℹ️
Last 12 Months: 10.7
Historical Average: 11.6
Percentile Rank of Last 12 Months ℹ️
High: 93rd percentile
Low: 85th percentile
Rain: 38th percentile
Change in Variance ℹ️
High: -4.4%
Low: +5.9%
Intraday: -7.1%
Data Coverage
77.0%
First Year of Data
1882
Station Location
Historical Weather Records
| Max High | Avg High | Min High | Max Avg | Avg Avg | Min Avg | Max Low | Avg Low | Min Low | Max Precipitation | Avg Precipitation | Max Snow | Avg Snow | |
|---|---|---|---|---|---|---|---|---|---|---|---|---|---|
| Record | 41.8 °C | — | 4.3 °C | 27.1 °C | — | 3.2 °C | 23.9 °C | — | -2.8 °C | 156.2 mm | — | — | — |
| January | 41.8 °C | 21.8 °C | 11.1 °C | 27.1 °C | 16.1 °C | 9.7 °C | 23.9 °C | 12.1 °C | 3.3 °C | 75.2 mm | 1.4 mm | — | — |
| February | 40.1 °C | 21.7 °C | 9.6 °C | 26.3 °C | 16.1 °C | 10.1 °C | 23.4 °C | 12.2 °C | 3.4 °C | 55.9 mm | 1.4 mm | — | — |
| March | 39.1 °C | 20.2 °C | 8.9 °C | 25.7 °C | 15.0 °C | 7.5 °C | 21.1 °C | 11.0 °C | 1.8 °C | 88.1 mm | 1.4 mm | — | — |
| April | 32.3 °C | 17.5 °C | 7.7 °C | 20.8 °C | 12.7 °C | 6.8 °C | 18.6 °C | 9.1 °C | 0.7 °C | 132.3 mm | 1.7 mm | — | — |
| May | 25.7 °C | 14.6 °C | 6.1 °C | 18.0 °C | 10.5 °C | 5.0 °C | 16.3 °C | 7.1 °C | -1.6 °C | 47.0 mm | 1.5 mm | — | — |
| June | 20.6 °C | 12.1 °C | 4.3 °C | 14.4 °C | 8.7 °C | 3.5 °C | 15.0 °C | 5.3 °C | -2.8 °C | 147.3 mm | 1.7 mm | — | — |
| July | 22.1 °C | 11.9 °C | 4.7 °C | 13.5 °C | 8.1 °C | 3.2 °C | 13.0 °C | 4.7 °C | -2.8 °C | 63.8 mm | 1.7 mm | — | — |
| August | 24.5 °C | 13.2 °C | 5.5 °C | 13.7 °C | 8.5 °C | 4.2 °C | 15.0 °C | 5.2 °C | -1.8 °C | 64.8 mm | 1.7 mm | — | — |
| September | 31.0 °C | 15.2 °C | 6.1 °C | 16.6 °C | 9.6 °C | 4.6 °C | 18.0 °C | 6.5 °C | -0.8 °C | 156.2 mm | 1.8 mm | — | — |
| October | 34.6 °C | 17.0 °C | 6.0 °C | 19.8 °C | 11.1 °C | 5.8 °C | 20.2 °C | 7.8 °C | -2.2 °C | 65.5 mm | 2.0 mm | — | — |
| November | 36.8 °C | 18.8 °C | 8.4 °C | 22.3 °C | 12.8 °C | 6.0 °C | 19.9 °C | 9.4 °C | 1.7 °C | 63.2 mm | 1.8 mm | — | — |
| December | 40.8 °C | 20.5 °C | 10.0 °C | 23.4 °C | 14.5 °C | 8.2 °C | 23.9 °C | 10.9 °C | 2.8 °C | 84.6 mm | 1.8 mm | — | — |
Data Visualisations
Remove WatermarksCurrent Year Climate Trends vs Historical


Max Temperature this Year | 1 of 6
Climate 12-Month Moving Averages


Max Temperature 12-Month MA | 1 of 6
Daily Data Points and Averages Throughout the Year


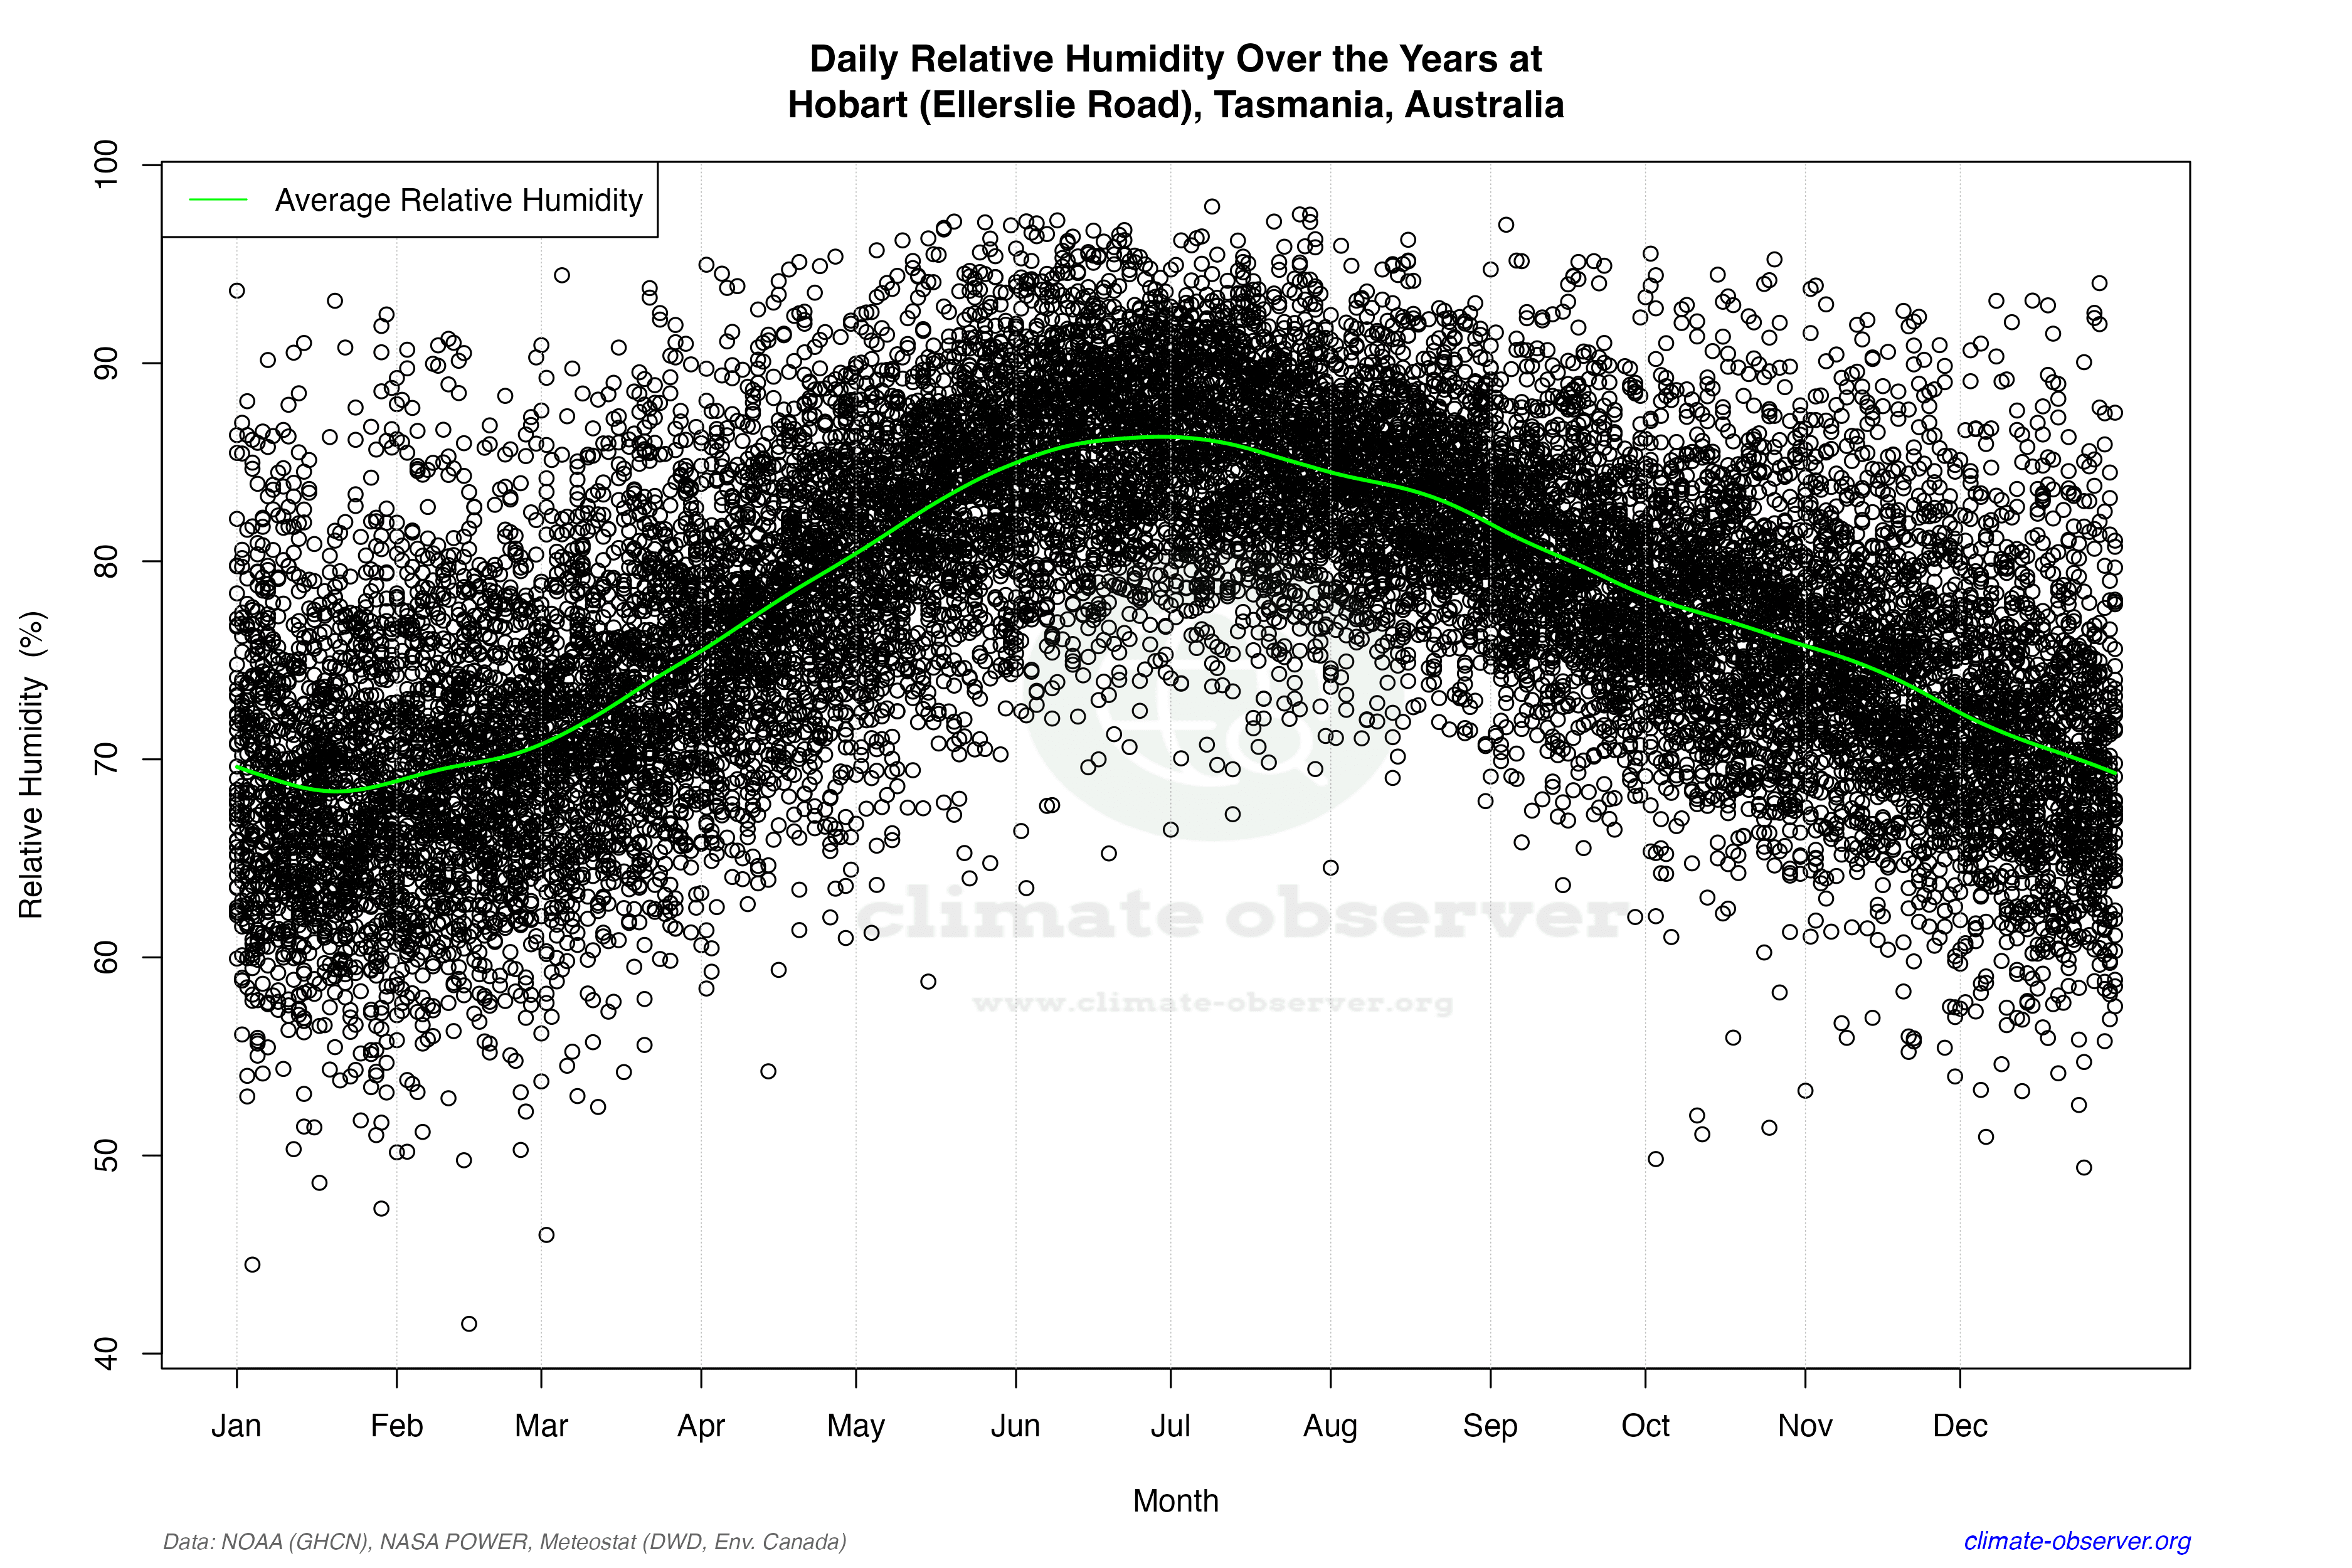

Average Max Temperature Throughout Year | 1 of 5
