Climate for Station: Kremsmuenster, Upper Austria, Austria
Loading live weather...
Climate Analysis & Overview
Kremsmünster's climate is experiencing a warming trend, with a notable increase in both high and low temperatures over the past decade. Meanwhile, precipitation is becoming slightly more evenly distributed, suggesting shifts in local weather patterns.
Warming Trends in Kremsmünster
Kremsmünster, located in Upper Austria, falls under the Köppen climate classification of Cfb, indicating a temperate oceanic climate with no dry season and a warm summer. The region's climate is influenced by its proximity to the Alps, which can moderate temperatures and affect precipitation patterns. Over the past decade, Kremsmünster has experienced a significant warming trend, with high temperatures rising by 0.82°C (1.48°F) and low temperatures increasing by 0.48°C (0.86°F). This recent trend is more pronounced than the all-time warming trend, where highs have risen by 0.21°C (0.38°F) and lows by 0.13°C (0.23°F). This suggests an acceleration in temperature increases, which could have implications for local agriculture and energy consumption.
Temperature Extremes and Records
Kremsmünster has recorded a maximum temperature of 36.4°C (97.5°F) and a minimum of -25.6°C (-14.1°F). These extremes highlight the variability of the region's climate, which can swing from hot summers to cold winters. Such variability is typical for areas influenced by both Atlantic and continental weather systems, as is the case in much of Austria.
Precipitation Patterns and Distribution
The Precipitation Concentration Index (PCI) for Kremsmünster has seen a slight decrease from a baseline of 11.39 to a current value of 11.23. The PCI measures how precipitation is distributed throughout the year; a decrease suggests that rainfall is becoming more evenly spread across the months. This marginal change indicates a subtle shift towards more consistent rainfall, which could help mitigate the risk of both droughts and floods.
Implications for Regional Climate Goals
Austria has been proactive in setting ambitious climate goals, aiming to reduce greenhouse gas emissions and increase renewable energy usage. The trends observed in Kremsmünster, particularly the warming of temperatures, align with broader national and global patterns of climate change. Understanding these localised changes is crucial for developing effective adaptation and mitigation strategies. Recent weather events, such as unseasonal heatwaves or heavy rainfall, underscore the importance of these efforts in preparing for future climatic shifts.
Local Geography and Climate Influence
The geography of Kremsmünster, nestled in a valley with nearby hills and rivers, plays a crucial role in shaping its climate. The surrounding topography can lead to microclimatic conditions, such as temperature inversions or localised fog, especially during transitional seasons. These geographical features, combined with the broader climatic trends, paint a complex picture of how Kremsmünster's climate is evolving in the face of global change.
Station Statistics
10-Year Trend
High: +0.50 °C/decade
Low: +0.33 °C/decade
Rain: -0.01 mm/decade
25-Year Trend
High: +0.77 °C/decade
Low: +0.61 °C/decade
Rain: -0.03 mm/decade
50-Year Trend
High: +0.72 °C/decade
Low: +0.49 °C/decade
Rain: +0.05 mm/decade
All-Time Trend
High: +0.20 °C/decade
Low: +0.13 °C/decade
Rain: -0.01 mm/decade
Percentage Above-Average Days
Last 12 Months: 52.1%
This Year: 62.6%
Precipitation Concentration Index (PCI) ℹ️
Last 12 Months: 11.4
Historical Average: 11.1
Percentile Rank of Last 12 Months ℹ️
High: 91st percentile
Low: 92nd percentile
Rain: 32nd percentile
Change in Variance ℹ️
High: +6.3%
Low: -8.3%
Intraday: +27.6%
Data Coverage
84.0%
First Year of Data
1876
Station Location
Historical Weather Records
| Max High | Avg High | Min High | Max Avg | Avg Avg | Min Avg | Max Low | Avg Low | Min Low | Max Precipitation | Avg Precipitation | Max Snow | Avg Snow | |
|---|---|---|---|---|---|---|---|---|---|---|---|---|---|
| Record | 36.4 °C | — | -18.6 °C | 28.8 °C | — | -21.0 °C | 22.1 °C | — | -25.6 °C | 110.0 mm | — | — | — |
| January | 18.1 °C | 0.7 °C | -16.0 °C | 14.2 °C | -0.7 °C | -21.0 °C | 10.0 °C | -4.1 °C | -25.6 °C | 41.1 mm | 2.0 mm | — | — |
| February | 20.3 °C | 3.1 °C | -18.6 °C | 13.3 °C | 0.8 °C | -17.3 °C | 11.6 °C | -2.8 °C | -24.2 °C | 43.6 mm | 2.0 mm | — | — |
| March | 24.2 °C | 8.2 °C | -9.5 °C | 17.8 °C | 5.1 °C | -15.9 °C | 13.0 °C | 0.6 °C | -17.2 °C | 48.6 mm | 2.1 mm | — | — |
| April | 30.7 °C | 13.5 °C | -0.4 °C | 22.9 °C | 9.5 °C | -2.6 °C | 15.8 °C | 4.5 °C | -9.7 °C | 63.1 mm | 2.5 mm | — | — |
| May | 31.9 °C | 18.3 °C | 3.1 °C | 24.4 °C | 14.3 °C | 2.7 °C | 19.8 °C | 8.9 °C | -1.5 °C | 108.0 mm | 3.3 mm | — | — |
| June | 36.0 °C | 21.6 °C | 8.2 °C | 27.7 °C | 17.7 °C | 7.2 °C | 22.1 °C | 12.4 °C | 0.6 °C | 77.2 mm | 4.0 mm | — | — |
| July | 36.3 °C | 23.5 °C | 10.1 °C | 28.1 °C | 19.3 °C | 10.1 °C | 22.1 °C | 14.1 °C | 6.2 °C | 110.0 mm | 4.6 mm | — | — |
| August | 36.4 °C | 22.9 °C | 11.4 °C | 28.8 °C | 18.9 °C | 8.9 °C | 21.6 °C | 13.7 °C | 4.1 °C | 98.9 mm | 3.8 mm | — | — |
| September | 34.6 °C | 18.8 °C | 5.4 °C | 26.2 °C | 14.7 °C | 5.4 °C | 20.0 °C | 10.4 °C | -1.6 °C | 101.8 mm | 2.9 mm | — | — |
| October | 27.1 °C | 12.7 °C | -0.6 °C | 20.6 °C | 9.4 °C | -2.7 °C | 18.4 °C | 5.8 °C | -7.4 °C | 46.0 mm | 2.1 mm | — | — |
| November | 24.7 °C | 5.9 °C | -8.8 °C | 17.2 °C | 3.9 °C | -8.9 °C | 14.0 °C | 1.2 °C | -14.8 °C | 50.2 mm | 2.1 mm | — | — |
| December | 15.3 °C | 1.9 °C | -17.8 °C | 12.7 °C | 0.4 °C | -15.9 °C | 9.7 °C | -2.4 °C | -22.3 °C | 41.7 mm | 2.1 mm | — | — |
Data Visualisations
Remove WatermarksCurrent Year Climate Trends vs Historical


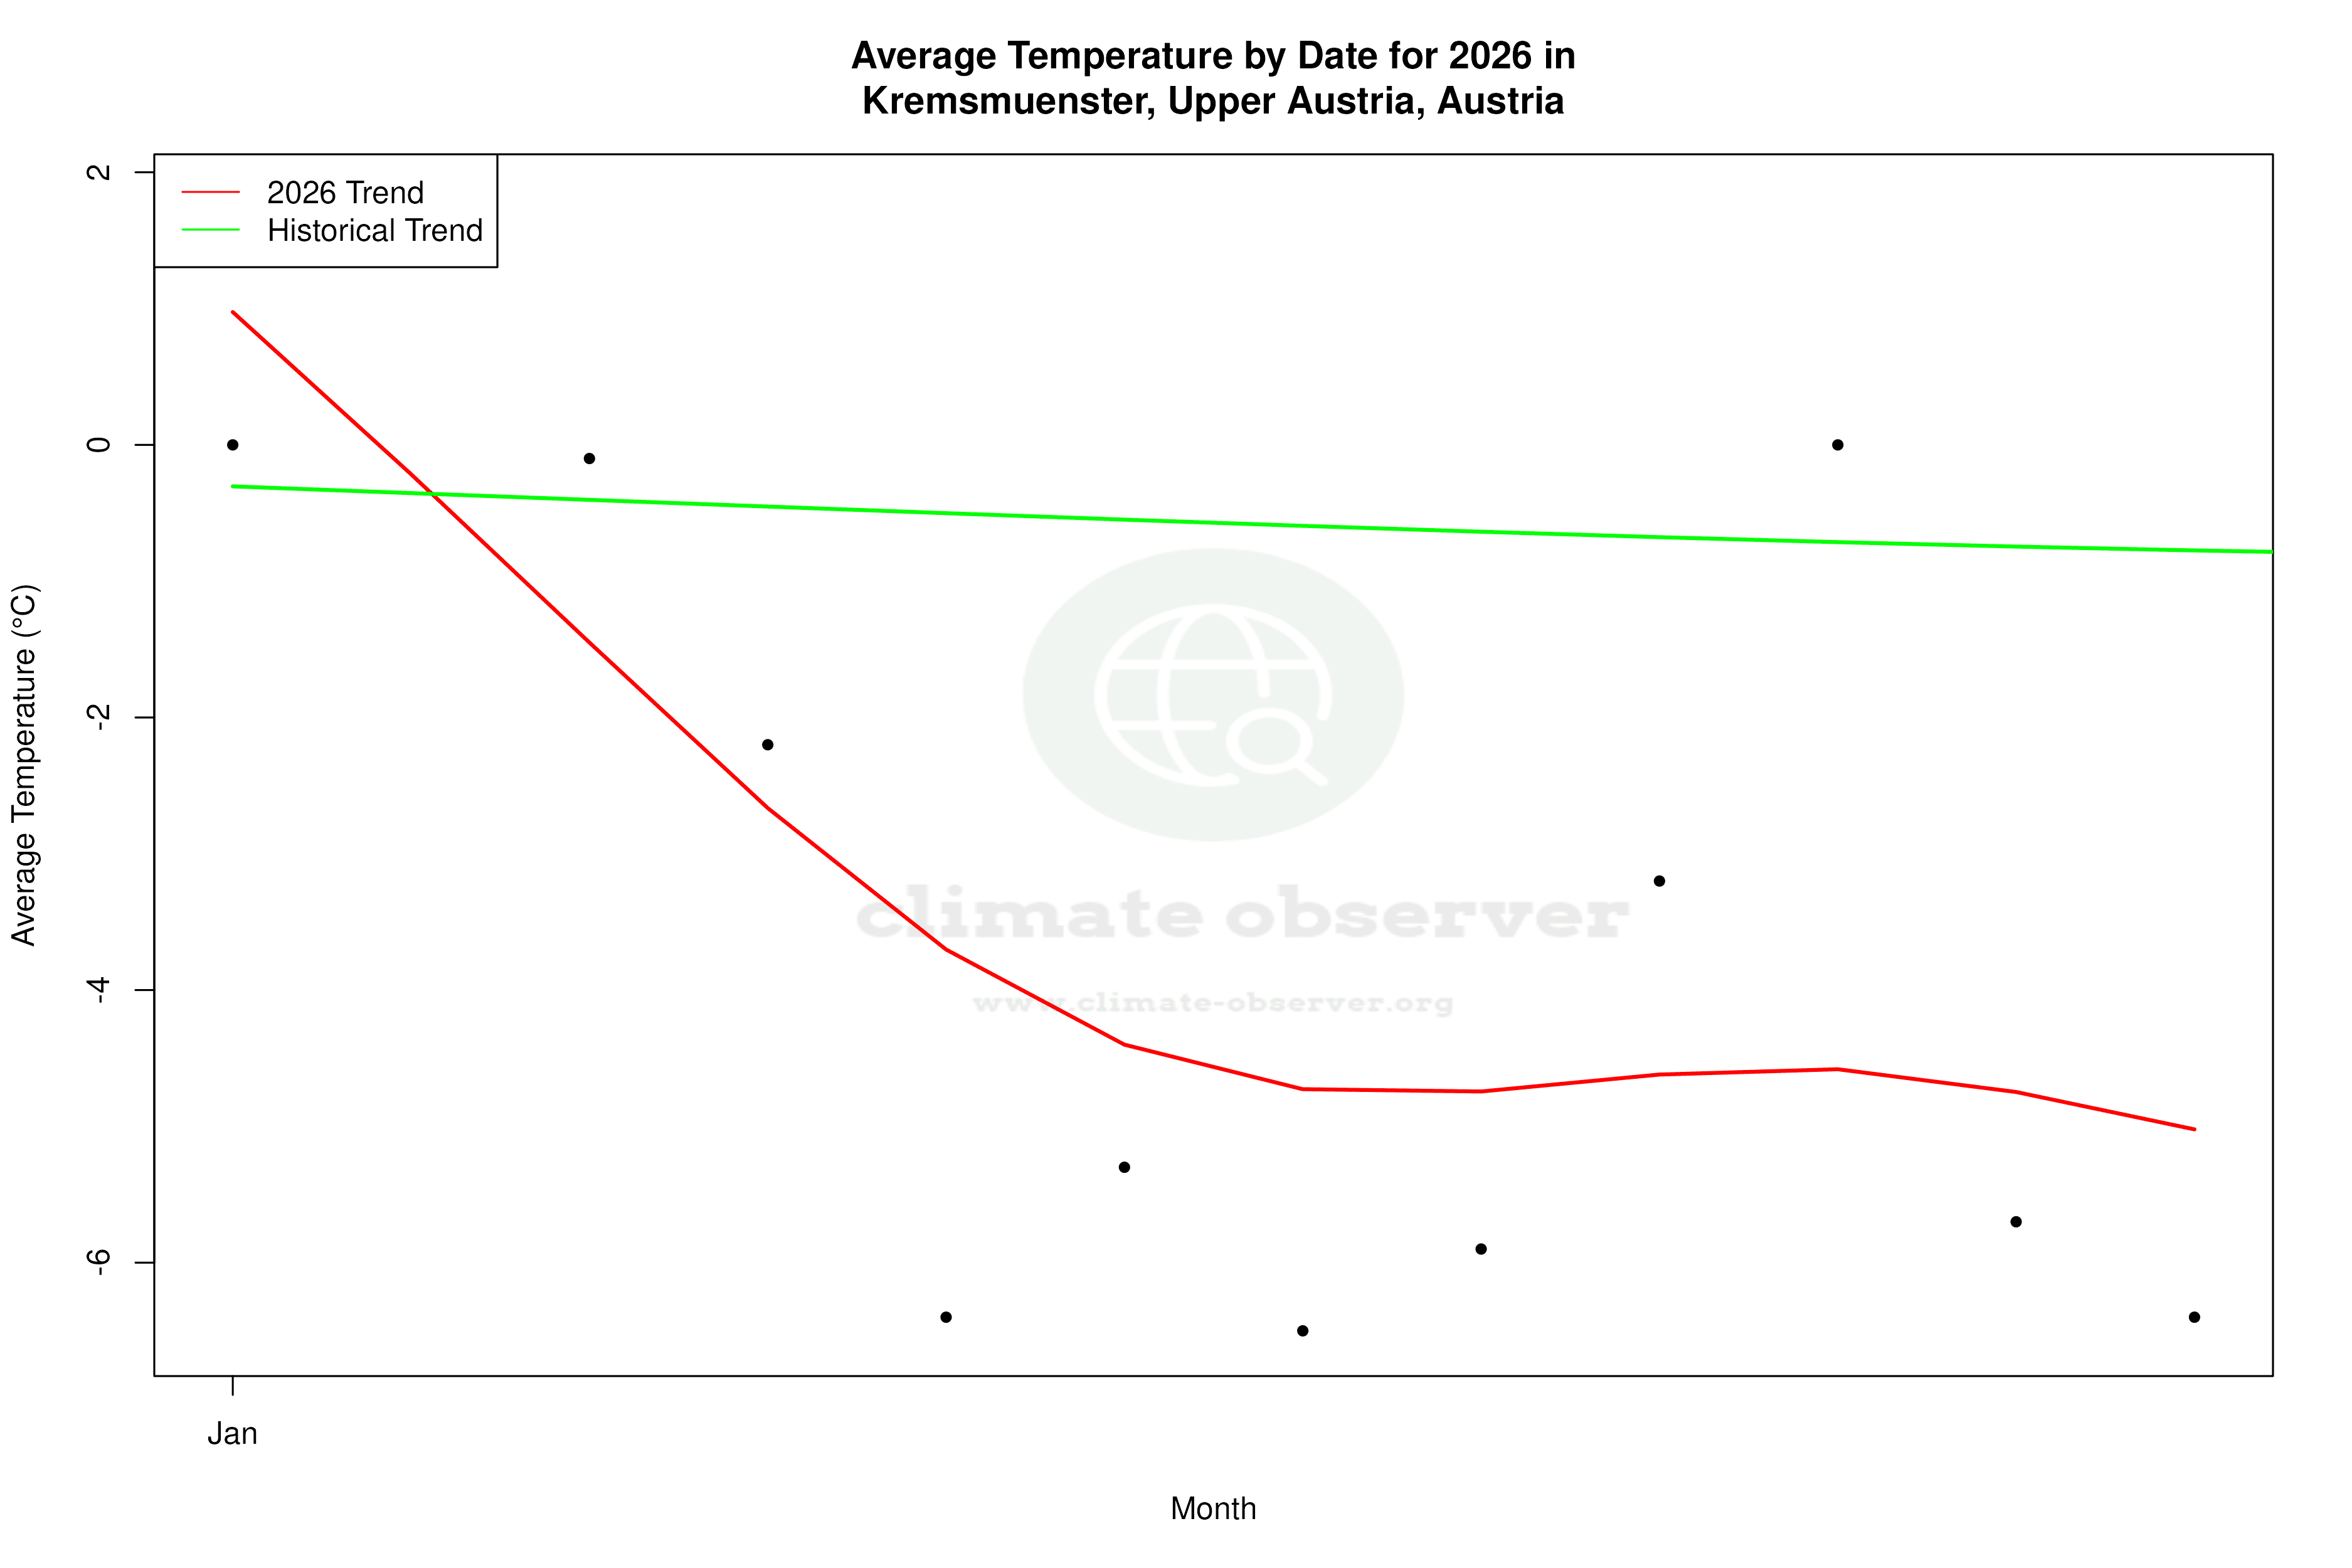


Max Temperature this Year | 1 of 6
Climate 12-Month Moving Averages


Max Temperature 12-Month MA | 1 of 6
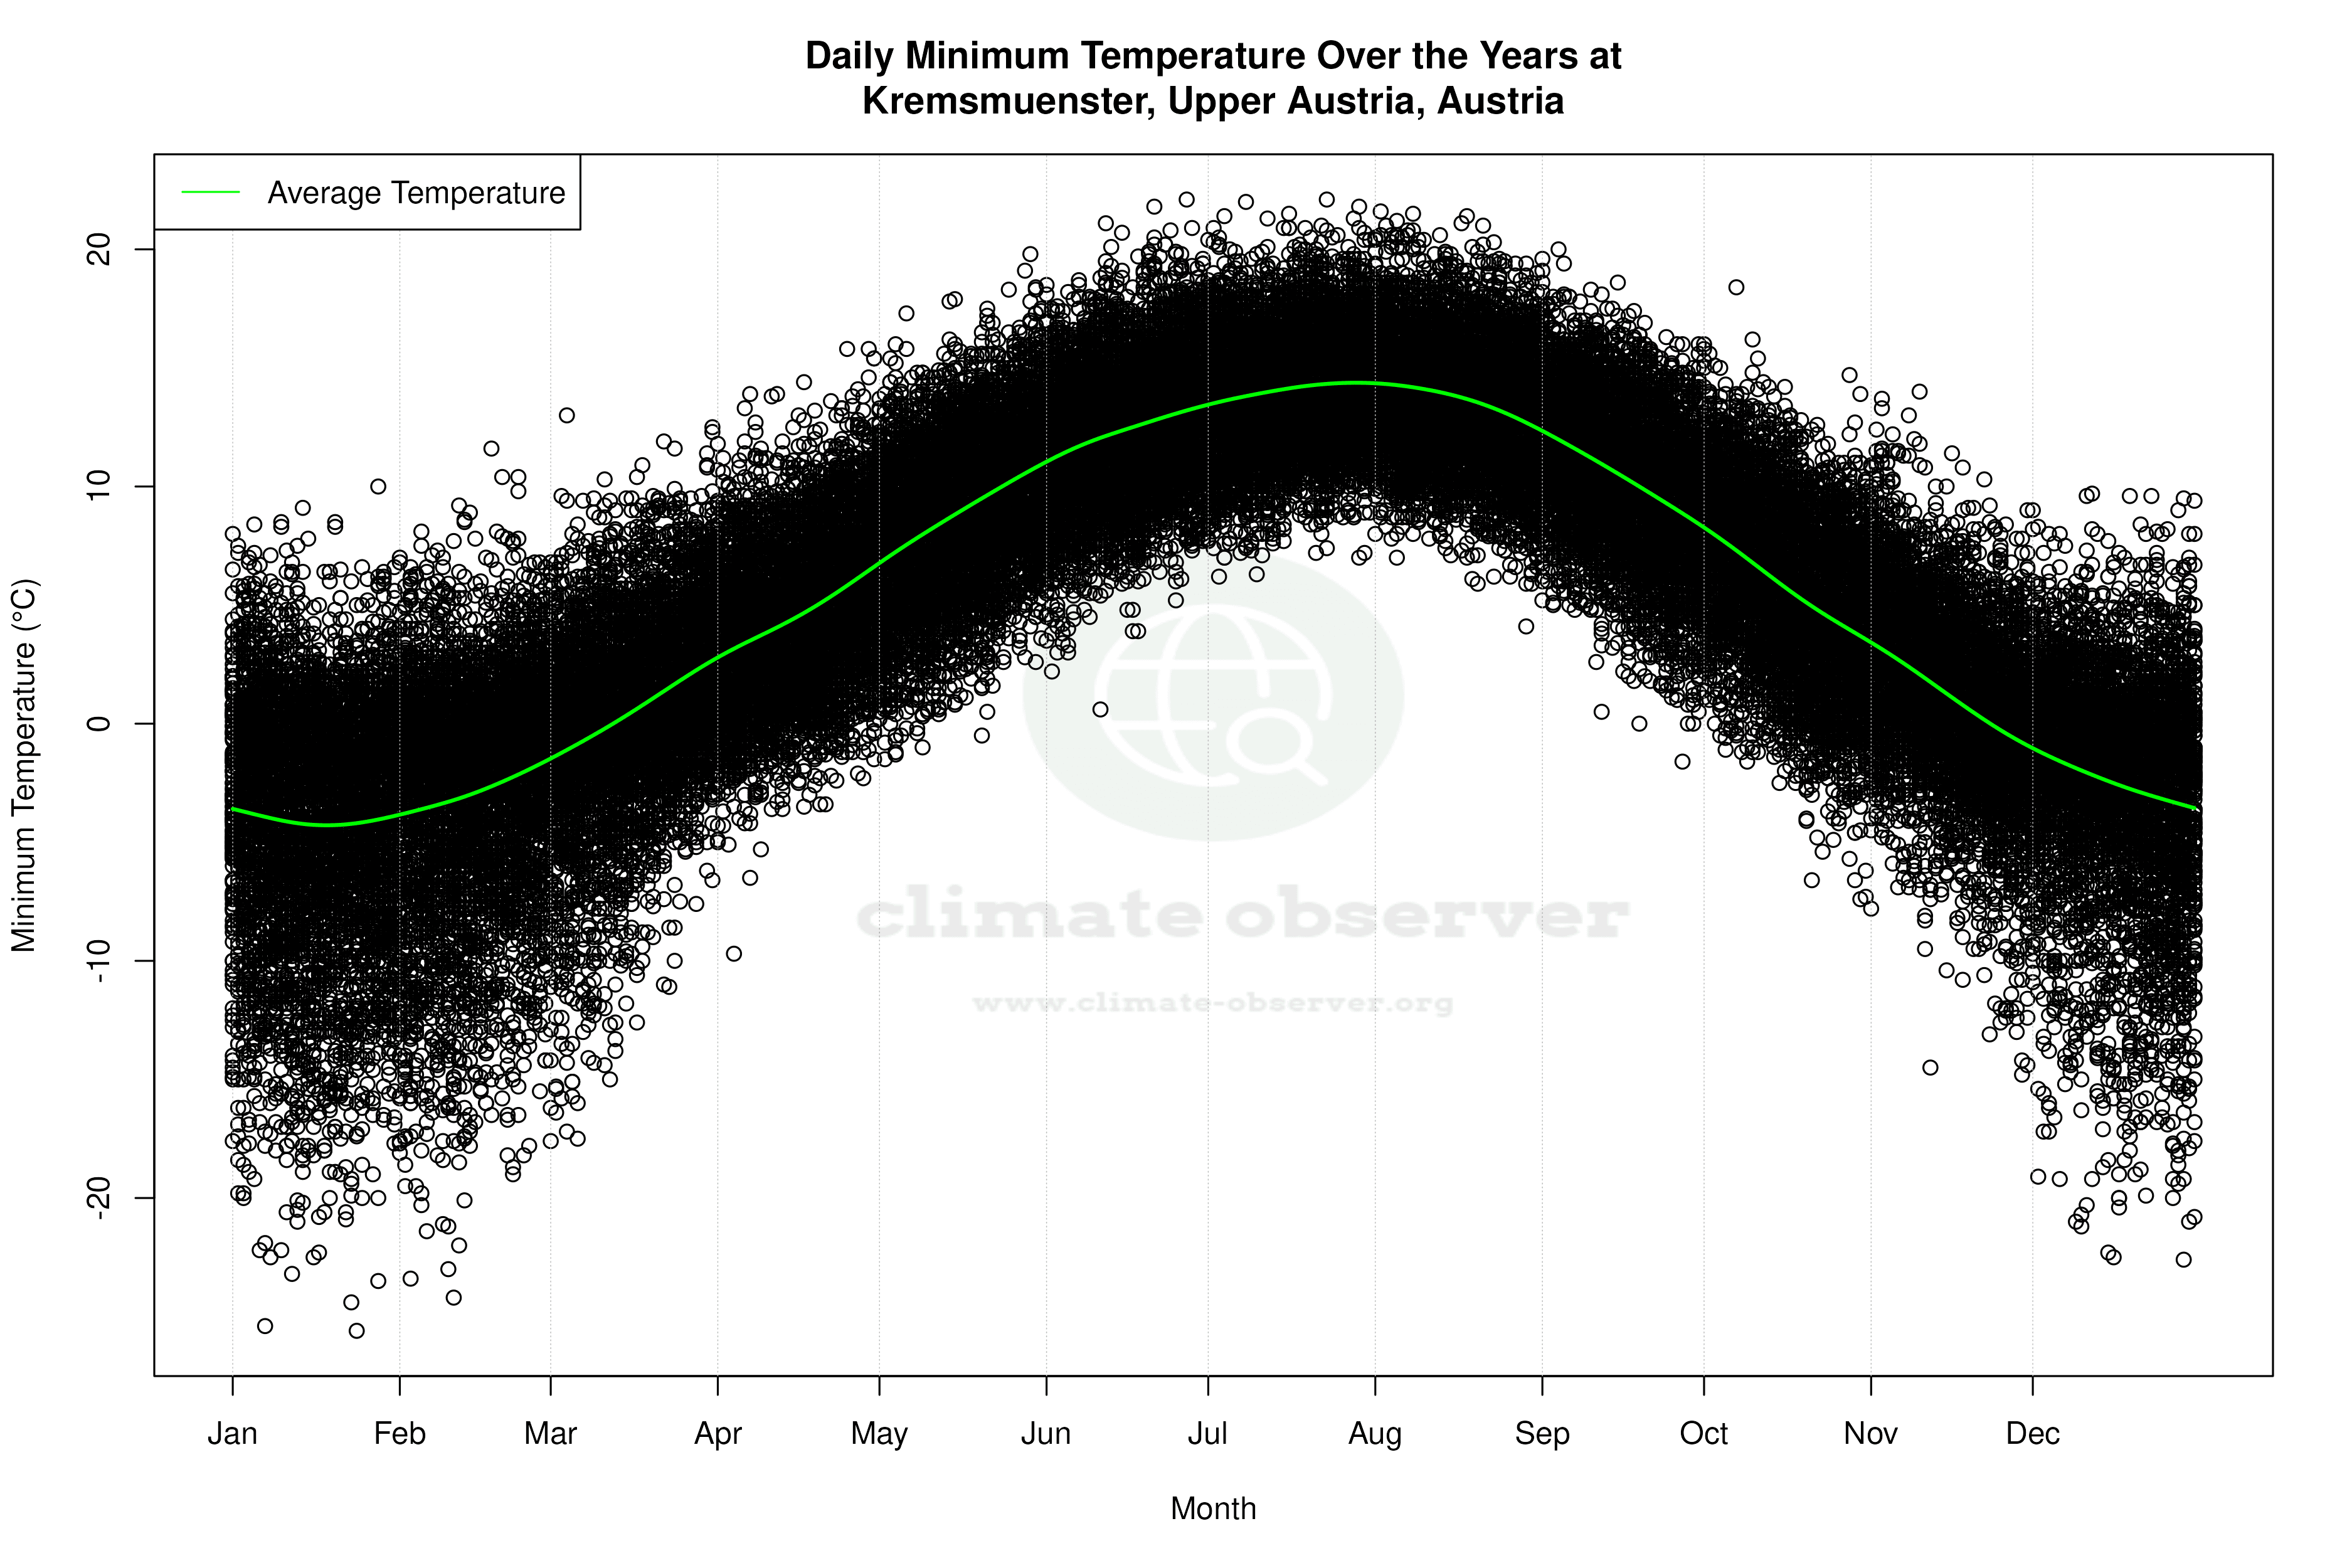
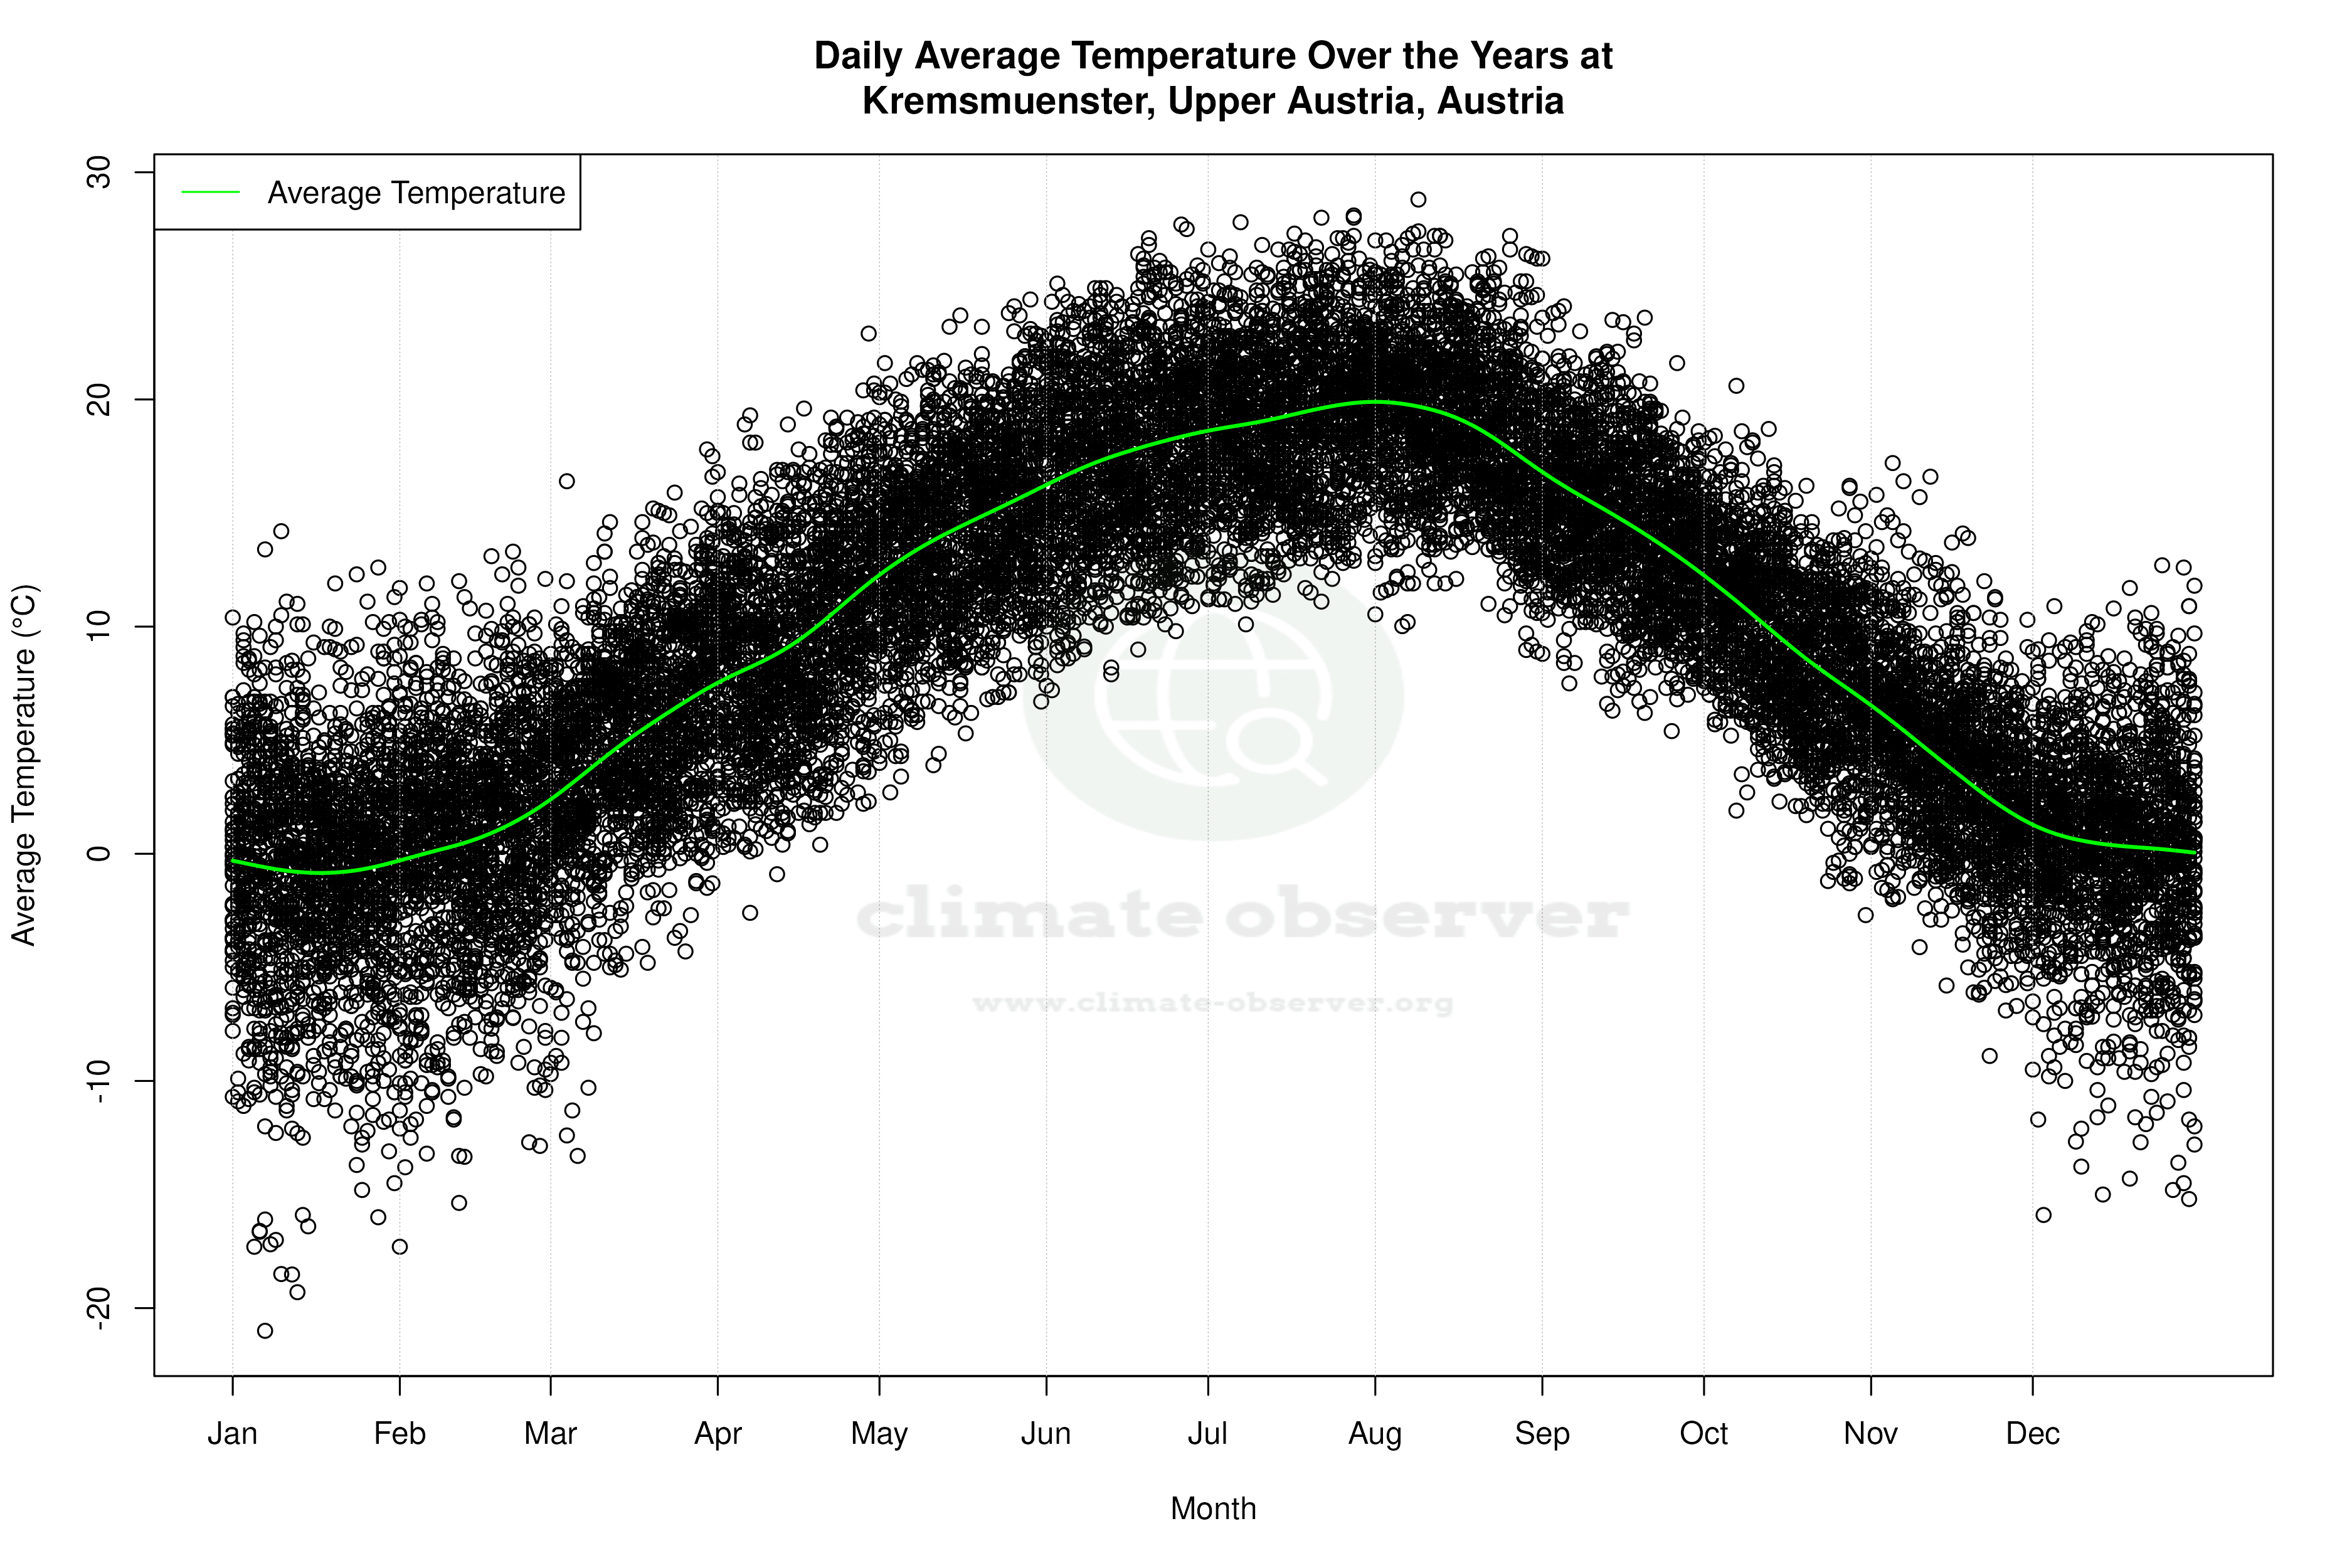
Daily Data Points and Averages Throughout the Year
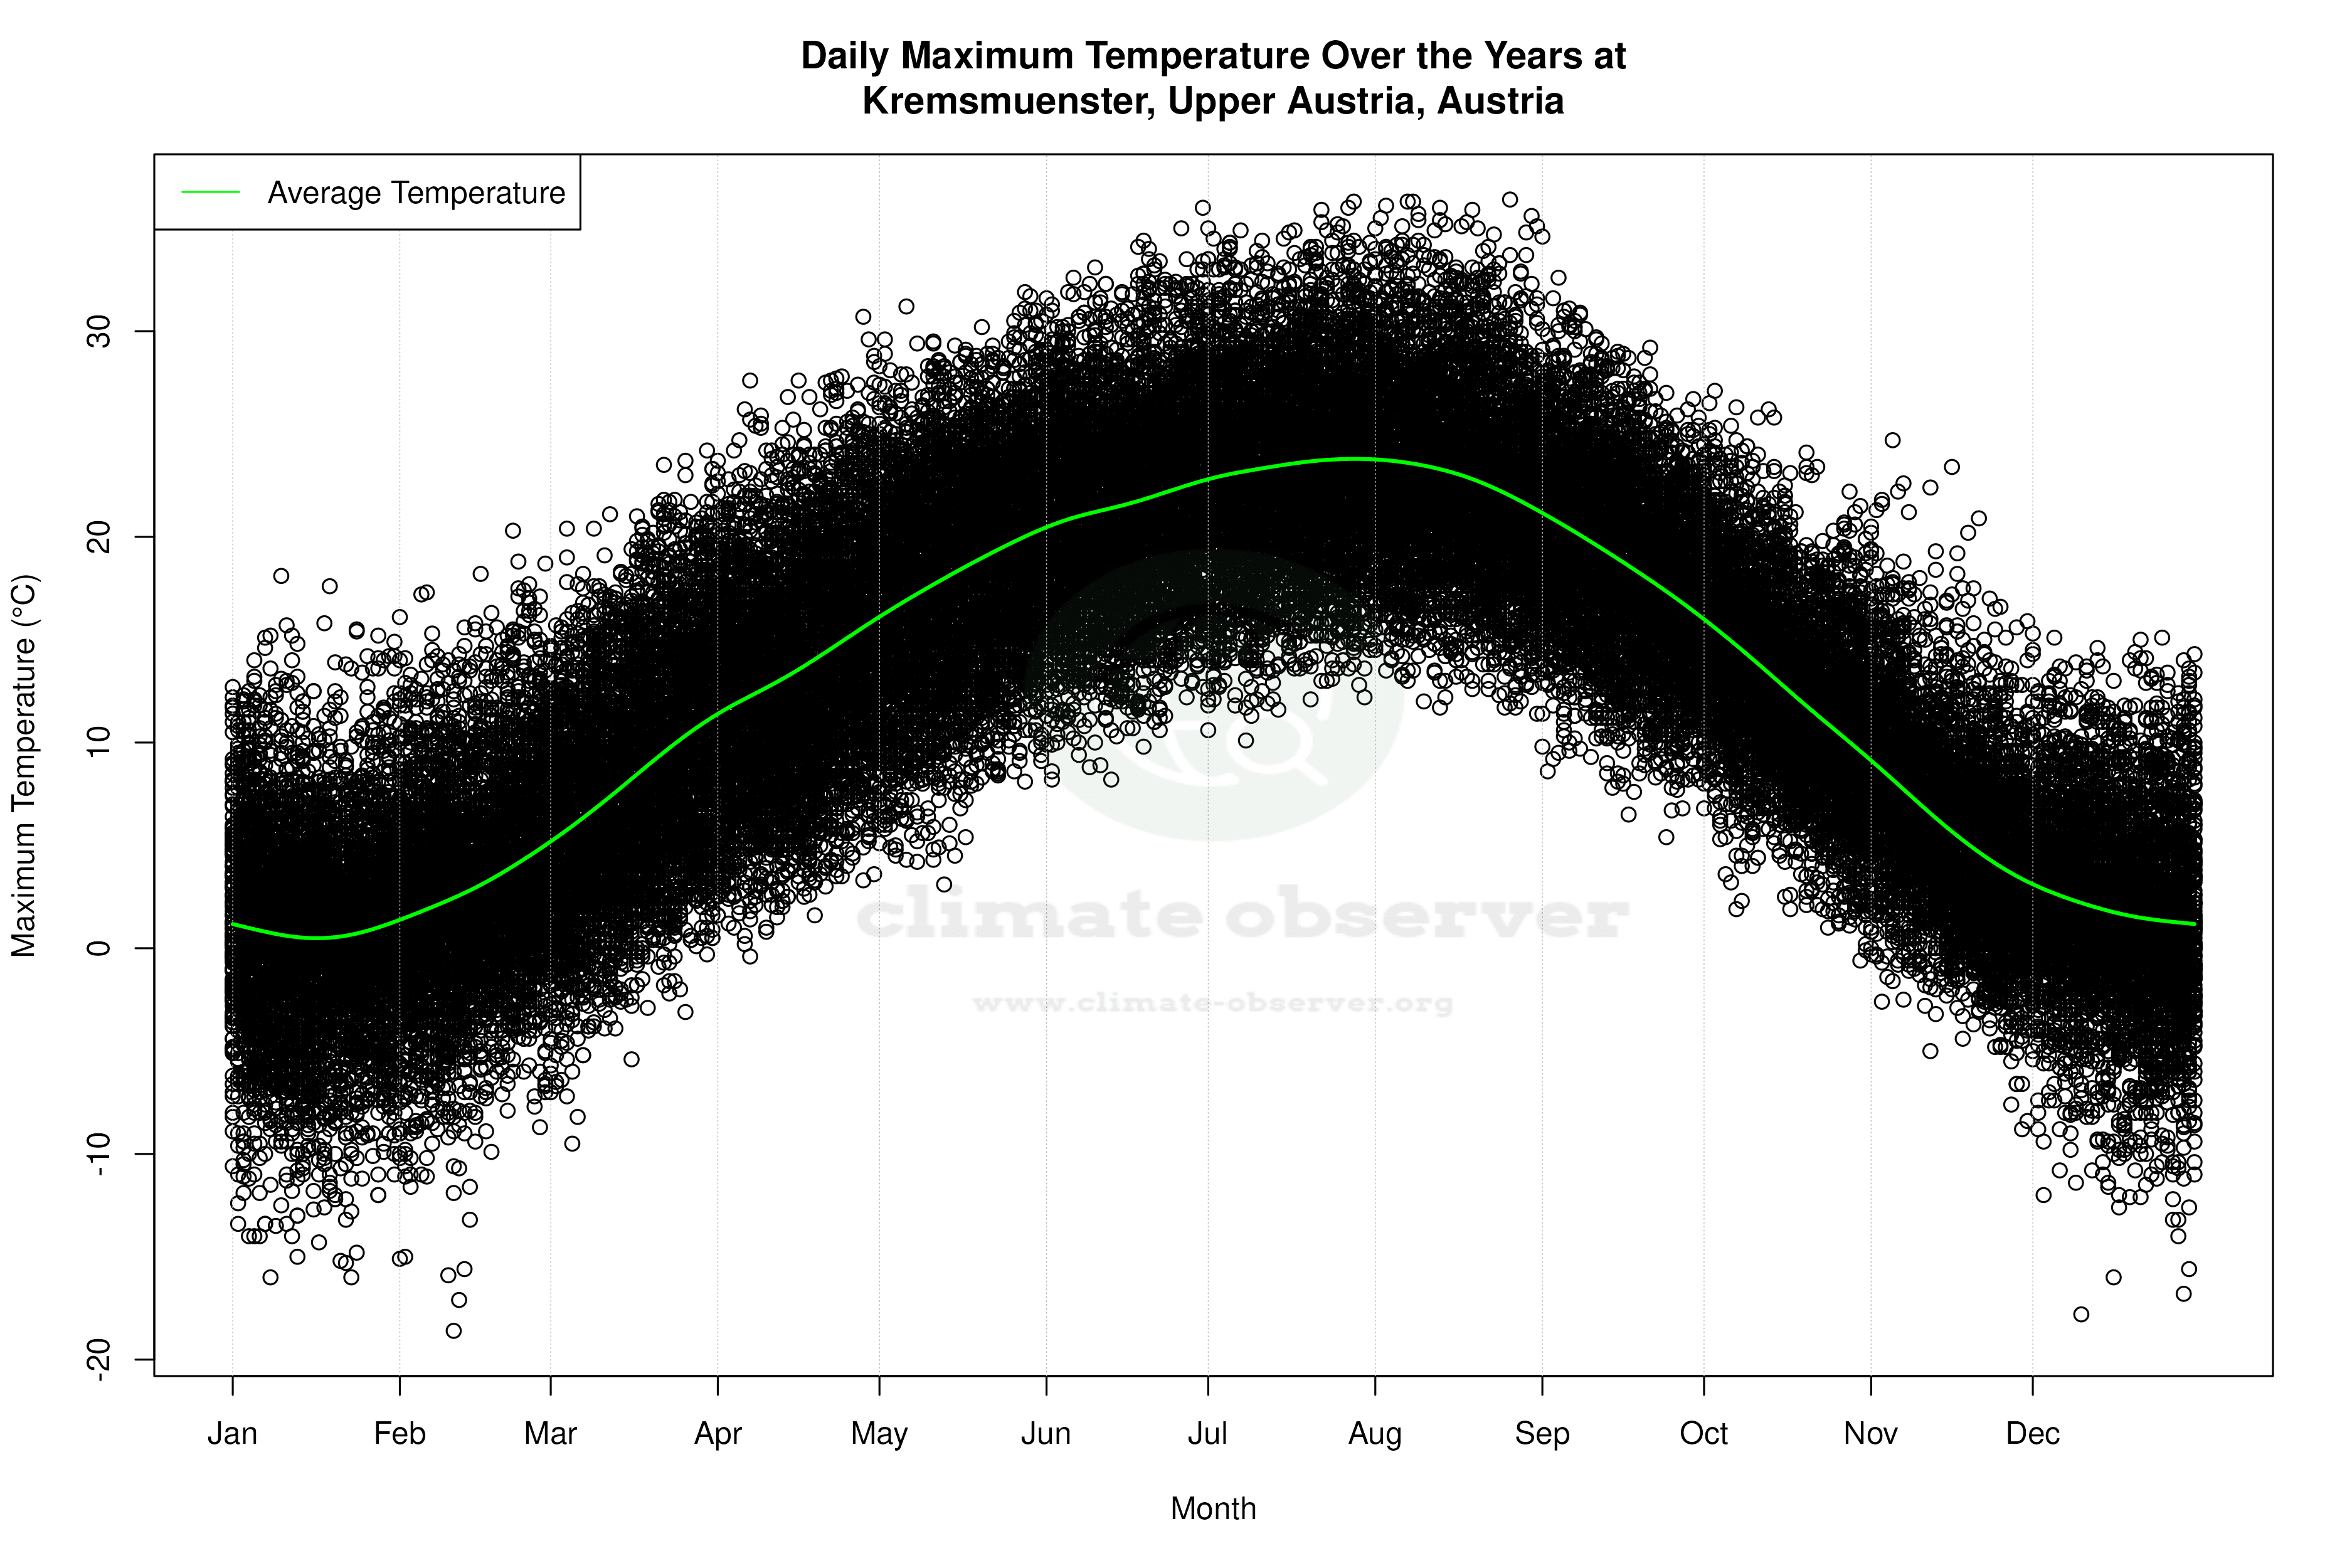


Average Max Temperature Throughout Year | 1 of 5
