Climate for Station: Innsbruck, Tyrol, Austria
Loading live weather...
Climate Analysis & Overview
Innsbruck's climate is experiencing a complex interplay of cooling short-term trends and long-term warming. Recent data shows a slight increase in precipitation concentration, suggesting more intense rainfall events. These changes are set against Austria's regional climate goals, which aim to mitigate such shifts.
Alpine Climate Dynamics
Innsbruck, nestled in the heart of the Austrian Alps, is characterised by its humid continental climate, classified under the Köppen system as Dfb. This classification indicates a climate with cold, snowy winters and warm summers, heavily influenced by the surrounding mountainous terrain. The city's geographical location at 47.2667°N, 11.4°E allows for unique climatic interactions, where elevation and topography play crucial roles in temperature and precipitation patterns.
Short-Term Cooling Trends
Over the past decade, Innsbruck has experienced a noticeable cooling trend, with average highs decreasing by 2.28°C (4.10°F) and lows by 1.27°C (2.29°F). This short-term cooling contrasts with the broader, long-term warming trend observed globally and highlights the variability inherent in regional climates. Such trends may be influenced by local factors, including snow cover and alpine weather systems, which can modulate temperature extremes.
Long-Term Warming Indicators
Despite the recent cooling, the all-time temperature trends for Innsbruck reveal a subtle warming pattern. Average highs have risen by 0.21°C (0.38°F), while lows have increased by 0.15°C (0.27°F). These figures suggest a gradual warming over the extended period, aligning with broader climatic shifts driven by global factors. This warming trend is significant for the region, potentially affecting snowpack levels and the timing of seasonal transitions, which are critical for both natural ecosystems and human activities, such as winter sports tourism.
Precipitation Patterns and PCI Insights
The Precipitation Concentration Index (PCI) for Innsbruck has shown a marginal increase from a baseline of 11.43 to a current value of 11.54. This slight rise indicates a trend towards more concentrated precipitation events, meaning that rainfall is becoming less evenly distributed throughout the year. While not yet at a level that suggests extreme concentration, this shift could lead to more intense rainfall events, impacting flood risk and water resource management.
Regional Climate Context
Austria's commitment to climate action, as part of its regional climate goals, aims to address these evolving patterns. Recent weather events in the region, such as increased instances of heavy rainfall and warmer winter temperatures, underscore the importance of these goals. As Innsbruck continues to experience these climatic shifts, understanding and adapting to both short-term and long-term trends will be crucial for sustainable development and resilience in the face of climate change.
Station Statistics
10-Year Trend
High: -2.11 °C/decade
Low: -1.12 °C/decade
Rain: +0.58 mm/decade
25-Year Trend
High: +0.24 °C/decade
Low: +0.15 °C/decade
Rain: +0.03 mm/decade
50-Year Trend
High: +0.48 °C/decade
Low: +0.36 °C/decade
Rain: +0.00 mm/decade
All-Time Trend
High: +0.21 °C/decade
Low: +0.16 °C/decade
Rain: +0.16 mm/decade
Percentage Above-Average Days
Last 12 Months: 46.0%
This Year: 55.0%
Precipitation Concentration Index (PCI) ℹ️
Last 12 Months: 13.6
Historical Average: 12.6
Percentile Rank of Last 12 Months ℹ️
High: 30th percentile
Low: 52nd percentile
Rain: 51st percentile
Change in Variance ℹ️
High: -7.2%
Low: -8.4%
Intraday: +3.2%
Data Coverage
85.6%
First Year of Data
1877
Station Location
Historical Weather Records
| Max High | Avg High | Min High | Max Avg | Avg Avg | Min Avg | Max Low | Avg Low | Min Low | Max Precipitation | Avg Precipitation | Max Snow | Avg Snow | |
|---|---|---|---|---|---|---|---|---|---|---|---|---|---|
| Record | 38.5 °C | — | -18.2 °C | 27.6 °C | — | -22.4 °C | 23.3 °C | — | -26.9 °C | 118.7 mm | — | — | — |
| January | 20.0 °C | 2.3 °C | -15.4 °C | 12.2 °C | -1.8 °C | -19.8 °C | 11.0 °C | -5.3 °C | -26.6 °C | 88.5 mm | 2.3 mm | — | — |
| February | 21.7 °C | 5.4 °C | -18.2 °C | 12.4 °C | 0.2 °C | -22.4 °C | 10.8 °C | -3.6 °C | -26.9 °C | 49.5 mm | 2.1 mm | — | — |
| March | 25.5 °C | 10.9 °C | -7.8 °C | 16.3 °C | 4.5 °C | -16.5 °C | 14.6 °C | 0.3 °C | -16.9 °C | 48.7 mm | 2.3 mm | — | — |
| April | 30.7 °C | 15.5 °C | -1.5 °C | 21.7 °C | 8.5 °C | -5.3 °C | 20.3 °C | 4.2 °C | -7.0 °C | 50.7 mm | 2.8 mm | — | — |
| May | 33.7 °C | 20.2 °C | 3.6 °C | 26.7 °C | 12.9 °C | -1.0 °C | 21.7 °C | 8.2 °C | -2.4 °C | 97.7 mm | 4.1 mm | — | — |
| June | 38.5 °C | 23.4 °C | 7.2 °C | 26.9 °C | 16.1 °C | 3.2 °C | 23.3 °C | 11.5 °C | 0.6 °C | 118.6 mm | 5.3 mm | — | — |
| July | 38.2 °C | 25.0 °C | 7.4 °C | 27.6 °C | 17.6 °C | 5.6 °C | 22.3 °C | 13.1 °C | 2.0 °C | 109.6 mm | 5.6 mm | — | — |
| August | 37.4 °C | 24.2 °C | 8.7 °C | 27.1 °C | 17.1 °C | 5.2 °C | 20.7 °C | 12.7 °C | 3.3 °C | 118.7 mm | 5.3 mm | — | — |
| September | 31.7 °C | 20.6 °C | 3.4 °C | 23.3 °C | 13.8 °C | 2.5 °C | 20.3 °C | 9.7 °C | -1.0 °C | 65.8 mm | 3.5 mm | — | — |
| October | 26.8 °C | 15.1 °C | 0.0 °C | 20.7 °C | 9.2 °C | -5.9 °C | 18.3 °C | 5.0 °C | -9.0 °C | 69.4 mm | 2.6 mm | — | — |
| November | 23.0 °C | 8.0 °C | -7.8 °C | 17.8 °C | 3.4 °C | -12.8 °C | 17.8 °C | 0.3 °C | -15.3 °C | 65.6 mm | 2.4 mm | — | — |
| December | 17.9 °C | 2.9 °C | -14.3 °C | 11.9 °C | -0.9 °C | -20.8 °C | 11.4 °C | -3.7 °C | -24.8 °C | 73.7 mm | 2.3 mm | — | — |
Data Visualisations
Remove WatermarksCurrent Year Climate Trends vs Historical


Max Temperature this Year | 1 of 6
Climate 12-Month Moving Averages


Max Temperature 12-Month MA | 1 of 6
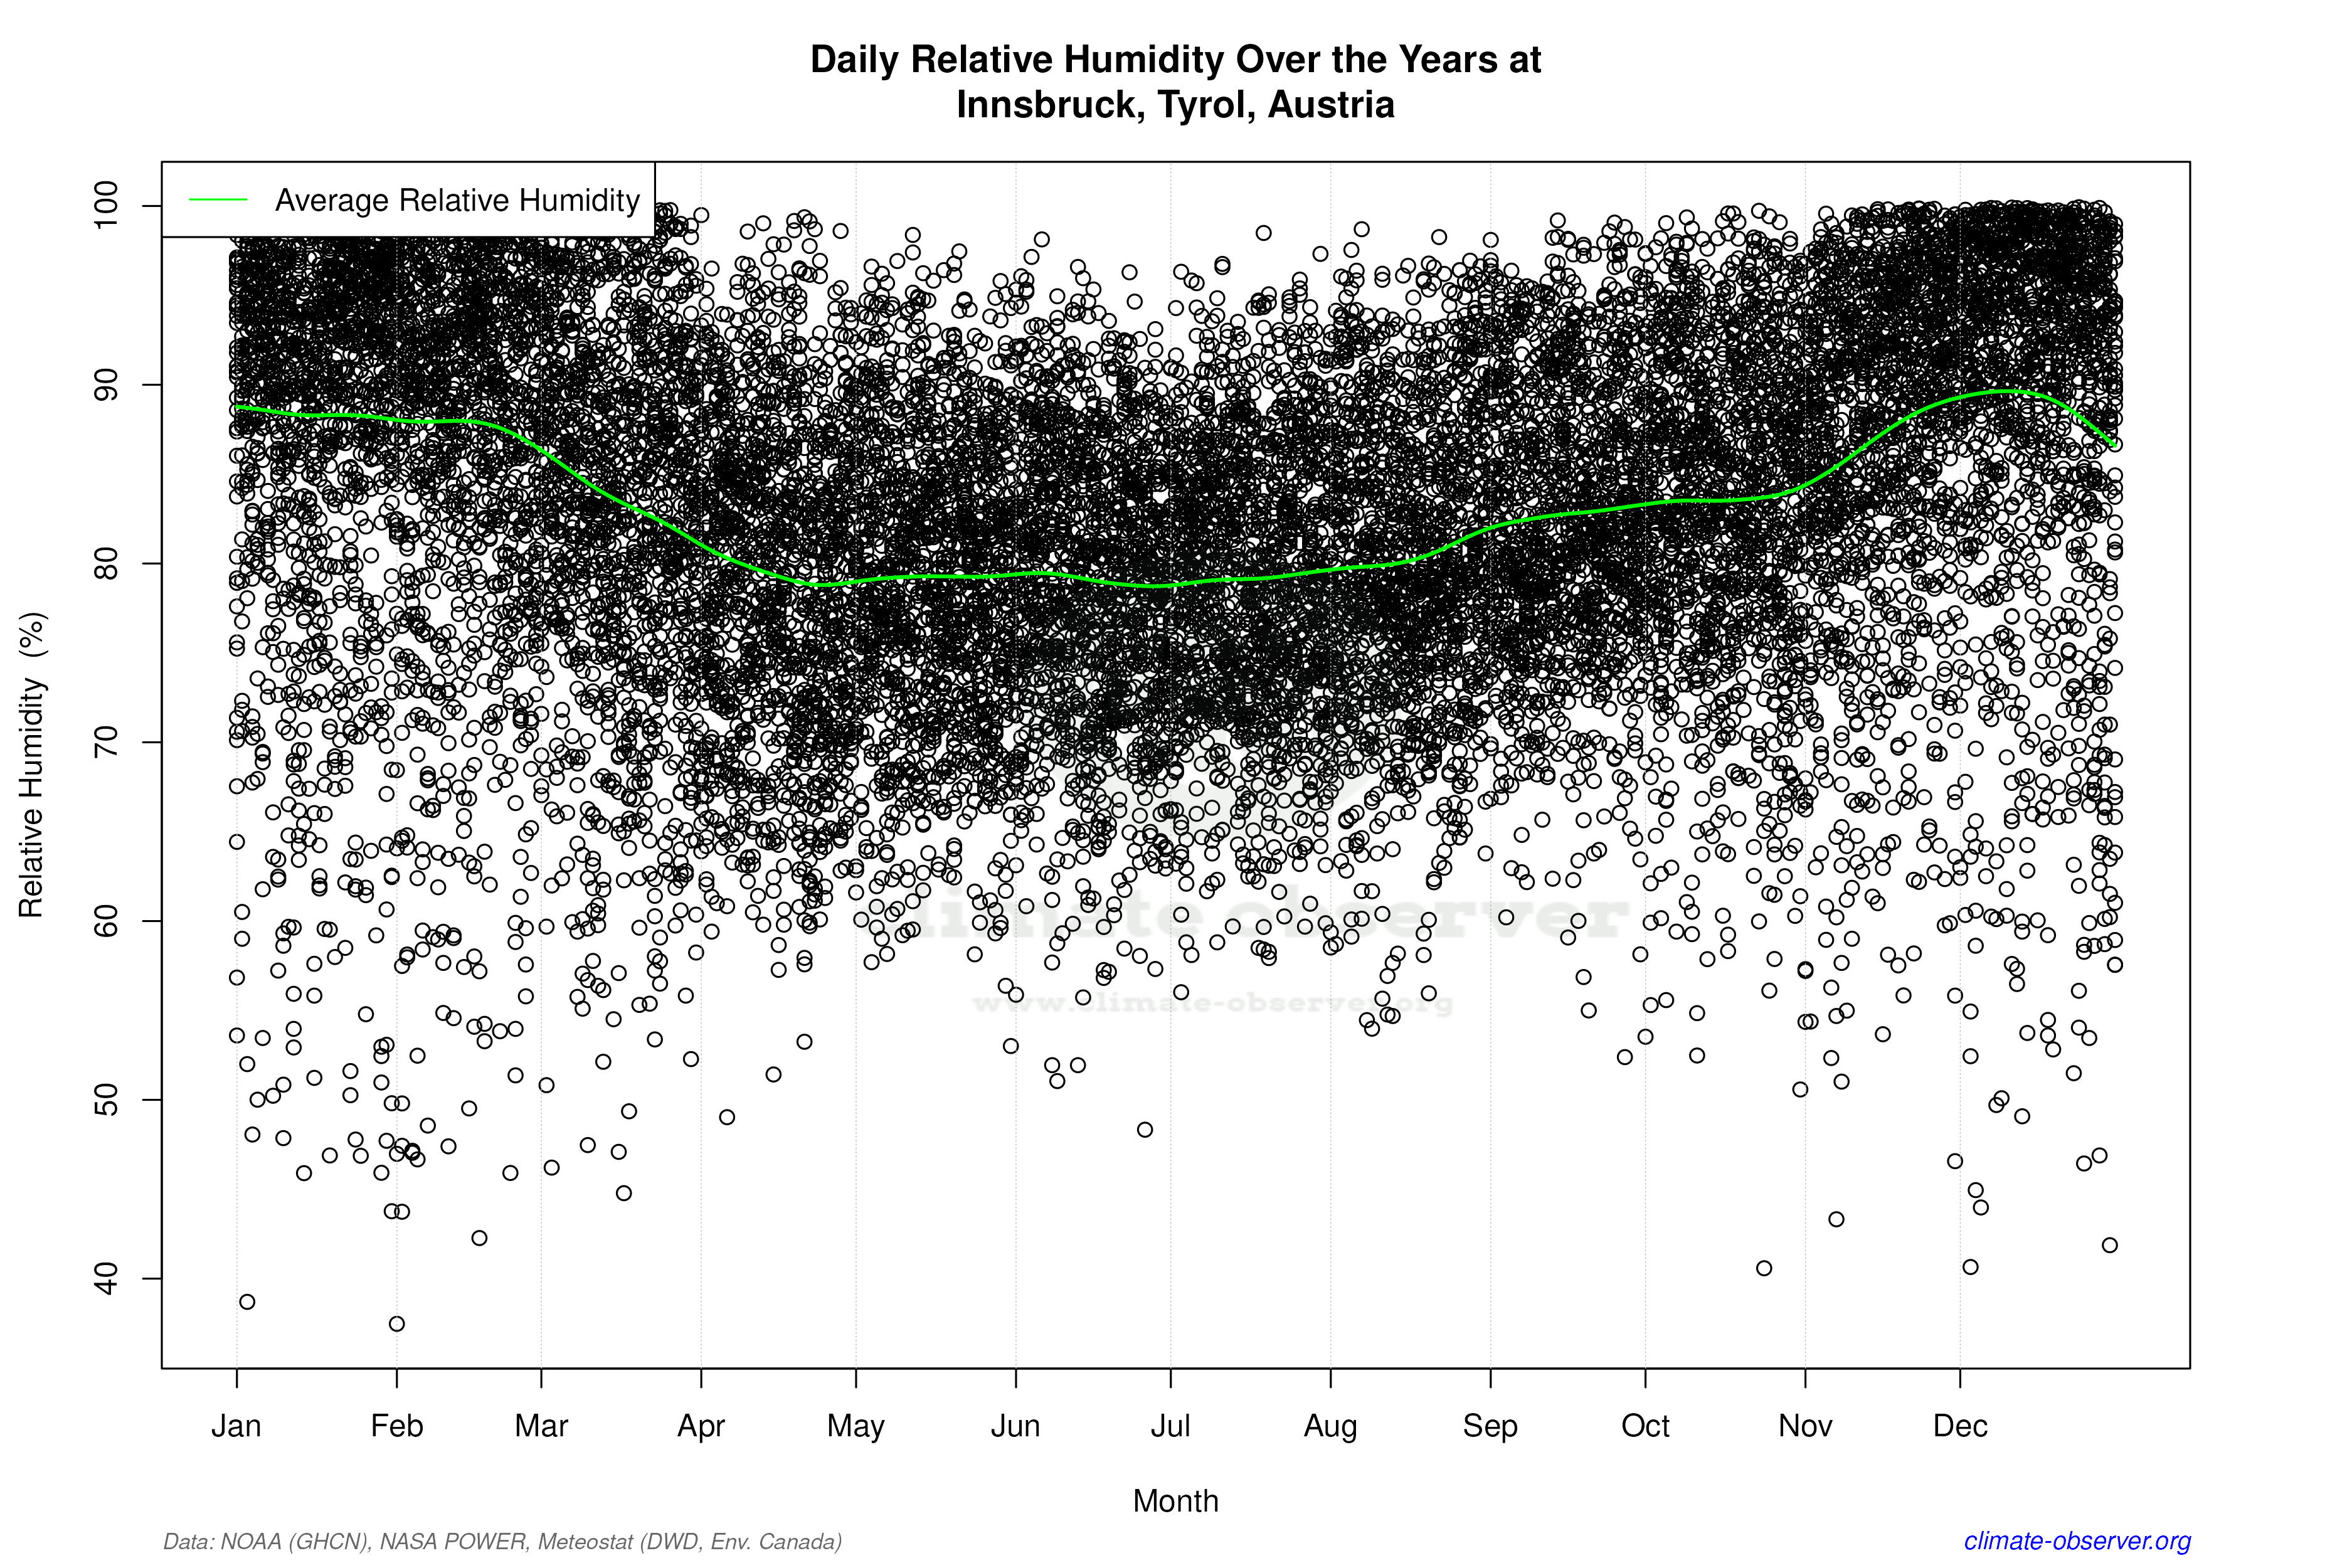
Daily Data Points and Averages Throughout the Year


Average Max Temperature Throughout Year | 1 of 5
