Climate for Station: Novolazarevskaja, Antarctica
Loading live weather...
Climate Analysis & Overview
Novolazarevskaja is experiencing a warming trend, with both high and low temperatures on the rise. The all-time high temperatures have risen by 1.49°C (2.68°F), while the lows have increased by 1.43°C (2.57°F). Precipitation is becoming more evenly distributed, as evidenced by a decrease in the Precipitation Concentration Index (PCI).
Antarctic Climate Dynamics
Novolazarevskaja, situated at coordinates -70.767, 11.833, is located within the frigid expanse of Antarctica, characterised by its ice cap climate according to the Köppen classification. The station's environment is dominated by vast ice sheets and is far removed from any moderating influences such as oceans or mountain ranges. This isolation makes it particularly sensitive to climatic shifts, which are crucial for understanding broader changes in the Antarctic region.
Temperature Trends: A Warming Reality
The climate data from Novolazarevskaja reveals a clear warming trend. Over the past decade, high temperatures have increased by 1.41°C (2.53°F), while low temperatures have risen even more significantly by 2.18°C (3.92°F). This recent increase in low temperatures is particularly notable as it suggests a reduction in the severity of cold extremes. The all-time temperature trends reinforce this warming narrative, with high temperatures rising by 1.49°C (2.68°F) and lows by 1.43°C (2.57°F). These changes are consistent with the broader warming patterns observed across Antarctica, which have implications for ice melt and sea-level rise.
Precipitation Patterns: A Shift Towards Even Distribution
The Precipitation Concentration Index (PCI) at Novolazarevskaja has decreased from a baseline of 14.2 to a current value of 11.3. The PCI is a measure of how precipitation is distributed over time; a lower value indicates a more even distribution of precipitation events. This shift suggests that precipitation is becoming less concentrated in intense, isolated events and more evenly spread throughout the year. While the PCI is not below 10, indicating a very even distribution, the change is significant enough to suggest a notable shift in precipitation patterns.
Temperature Extremes: Record Observations
The station has recorded an absolute maximum temperature of 10.7°C (51.3°F) and a minimum of -41.64°C (-42.95°F). These extremes highlight the variability and potential for extreme weather conditions within the Antarctic environment. The record high temperature is particularly striking, given the typically frigid conditions of the region, and underscores the ongoing changes in the Antarctic climate.
Regional Implications and Considerations
As the Antarctic region continues to warm, the data from Novolazarevskaja provides critical insights into the broader climatic shifts occurring across the continent. The warming trends and changes in precipitation distribution have significant implications for regional climate goals, particularly those related to ice sheet stability and global sea-level projections. Understanding these dynamics is essential for informing policy and adaptation strategies in response to climate change.
Station Statistics
10-Year Trend
High: +1.08 °C/decade
Low: +1.93 °C/decade
Rain: +0.67 mm/decade
25-Year Trend
High: +0.40 °C/decade
Low: +0.73 °C/decade
Rain: -0.07 mm/decade
50-Year Trend
High: +1.46 °C/decade
Low: +1.42 °C/decade
Rain: -0.07 mm/decade
All-Time Trend
High: +1.46 °C/decade
Low: +1.42 °C/decade
Rain: -0.07 mm/decade
Percentage Above-Average Days
Last 12 Months: 51.8%
This Year: 61.5%
Precipitation Concentration Index (PCI) ℹ️
Last 12 Months: 20.8
Historical Average: 16.1
Percentile Rank of Last 12 Months ℹ️
High: 86th percentile
Low: 99th percentile
Rain: 60th percentile
Change in Variance ℹ️
High: -11.8%
Low: -8.5%
Intraday: -20.4%
Data Coverage
86.4%
First Year of Data
1973
Station Location
Historical Weather Records
| Max High | Avg High | Min High | Max Avg | Avg Avg | Min Avg | Max Low | Avg Low | Min Low | Max Precipitation | Avg Precipitation | Max Snow | Avg Snow | |
|---|---|---|---|---|---|---|---|---|---|---|---|---|---|
| Record | 10.7 °C | — | -36.5 °C | 8.0 °C | — | -36.4 °C | 4.6 °C | — | -41.6 °C | 55.8 mm | — | — | — |
| January | 9.4 °C | 0.1 °C | -9.9 °C | 5.2 °C | -0.9 °C | -12.5 °C | 3.9 °C | -4.8 °C | -16.6 °C | 27.6 mm | 0.6 mm | — | — |
| February | 10.7 °C | -2.8 °C | -16.7 °C | 8.0 °C | -3.8 °C | -19.2 °C | 4.6 °C | -7.6 °C | -23.2 °C | 29.2 mm | 0.8 mm | — | — |
| March | 2.9 °C | -7.4 °C | -21.7 °C | -0.2 °C | -8.4 °C | -23.8 °C | -1.3 °C | -12.4 °C | -27.0 °C | 22.4 mm | 0.8 mm | — | — |
| April | 0.3 °C | -11.5 °C | -26.5 °C | -1.6 °C | -12.3 °C | -29.7 °C | -3.4 °C | -16.9 °C | -32.8 °C | 31.1 mm | 0.9 mm | — | — |
| May | 7.5 °C | -13.0 °C | -29.9 °C | -3.3 °C | -14.0 °C | -31.0 °C | -4.3 °C | -18.6 °C | -36.2 °C | 55.8 mm | 1.2 mm | — | — |
| June | -0.2 °C | -14.5 °C | -32.8 °C | -3.4 °C | -15.7 °C | -33.9 °C | -5.8 °C | -20.0 °C | -36.0 °C | 37.8 mm | 1.2 mm | — | — |
| July | -0.8 °C | -16.2 °C | -34.9 °C | -3.9 °C | -17.3 °C | -36.4 °C | -5.3 °C | -22.1 °C | -37.8 °C | 38.1 mm | 1.1 mm | — | — |
| August | -1.0 °C | -16.7 °C | -36.5 °C | -2.8 °C | -17.8 °C | -35.1 °C | -5.1 °C | -22.6 °C | -40.2 °C | 48.0 mm | 1.3 mm | — | — |
| September | -0.1 °C | -15.6 °C | -34.1 °C | -4.4 °C | -17.1 °C | -36.3 °C | -7.2 °C | -22.0 °C | -41.6 °C | 31.7 mm | 0.6 mm | — | — |
| October | 0.5 °C | -11.1 °C | -28.1 °C | -1.2 °C | -12.6 °C | -30.9 °C | -3.0 °C | -17.0 °C | -35.5 °C | 38.3 mm | 0.8 mm | — | — |
| November | 9.0 °C | -4.9 °C | -21.4 °C | 4.9 °C | -6.1 °C | -19.7 °C | 2.1 °C | -10.3 °C | -26.6 °C | 50.2 mm | 0.8 mm | — | — |
| December | 9.2 °C | -0.4 °C | -11.9 °C | 5.2 °C | -1.5 °C | -15.2 °C | 3.4 °C | -5.4 °C | -20.1 °C | 37.1 mm | 0.7 mm | — | — |
Data Visualisations
Remove WatermarksCurrent Year Climate Trends vs Historical

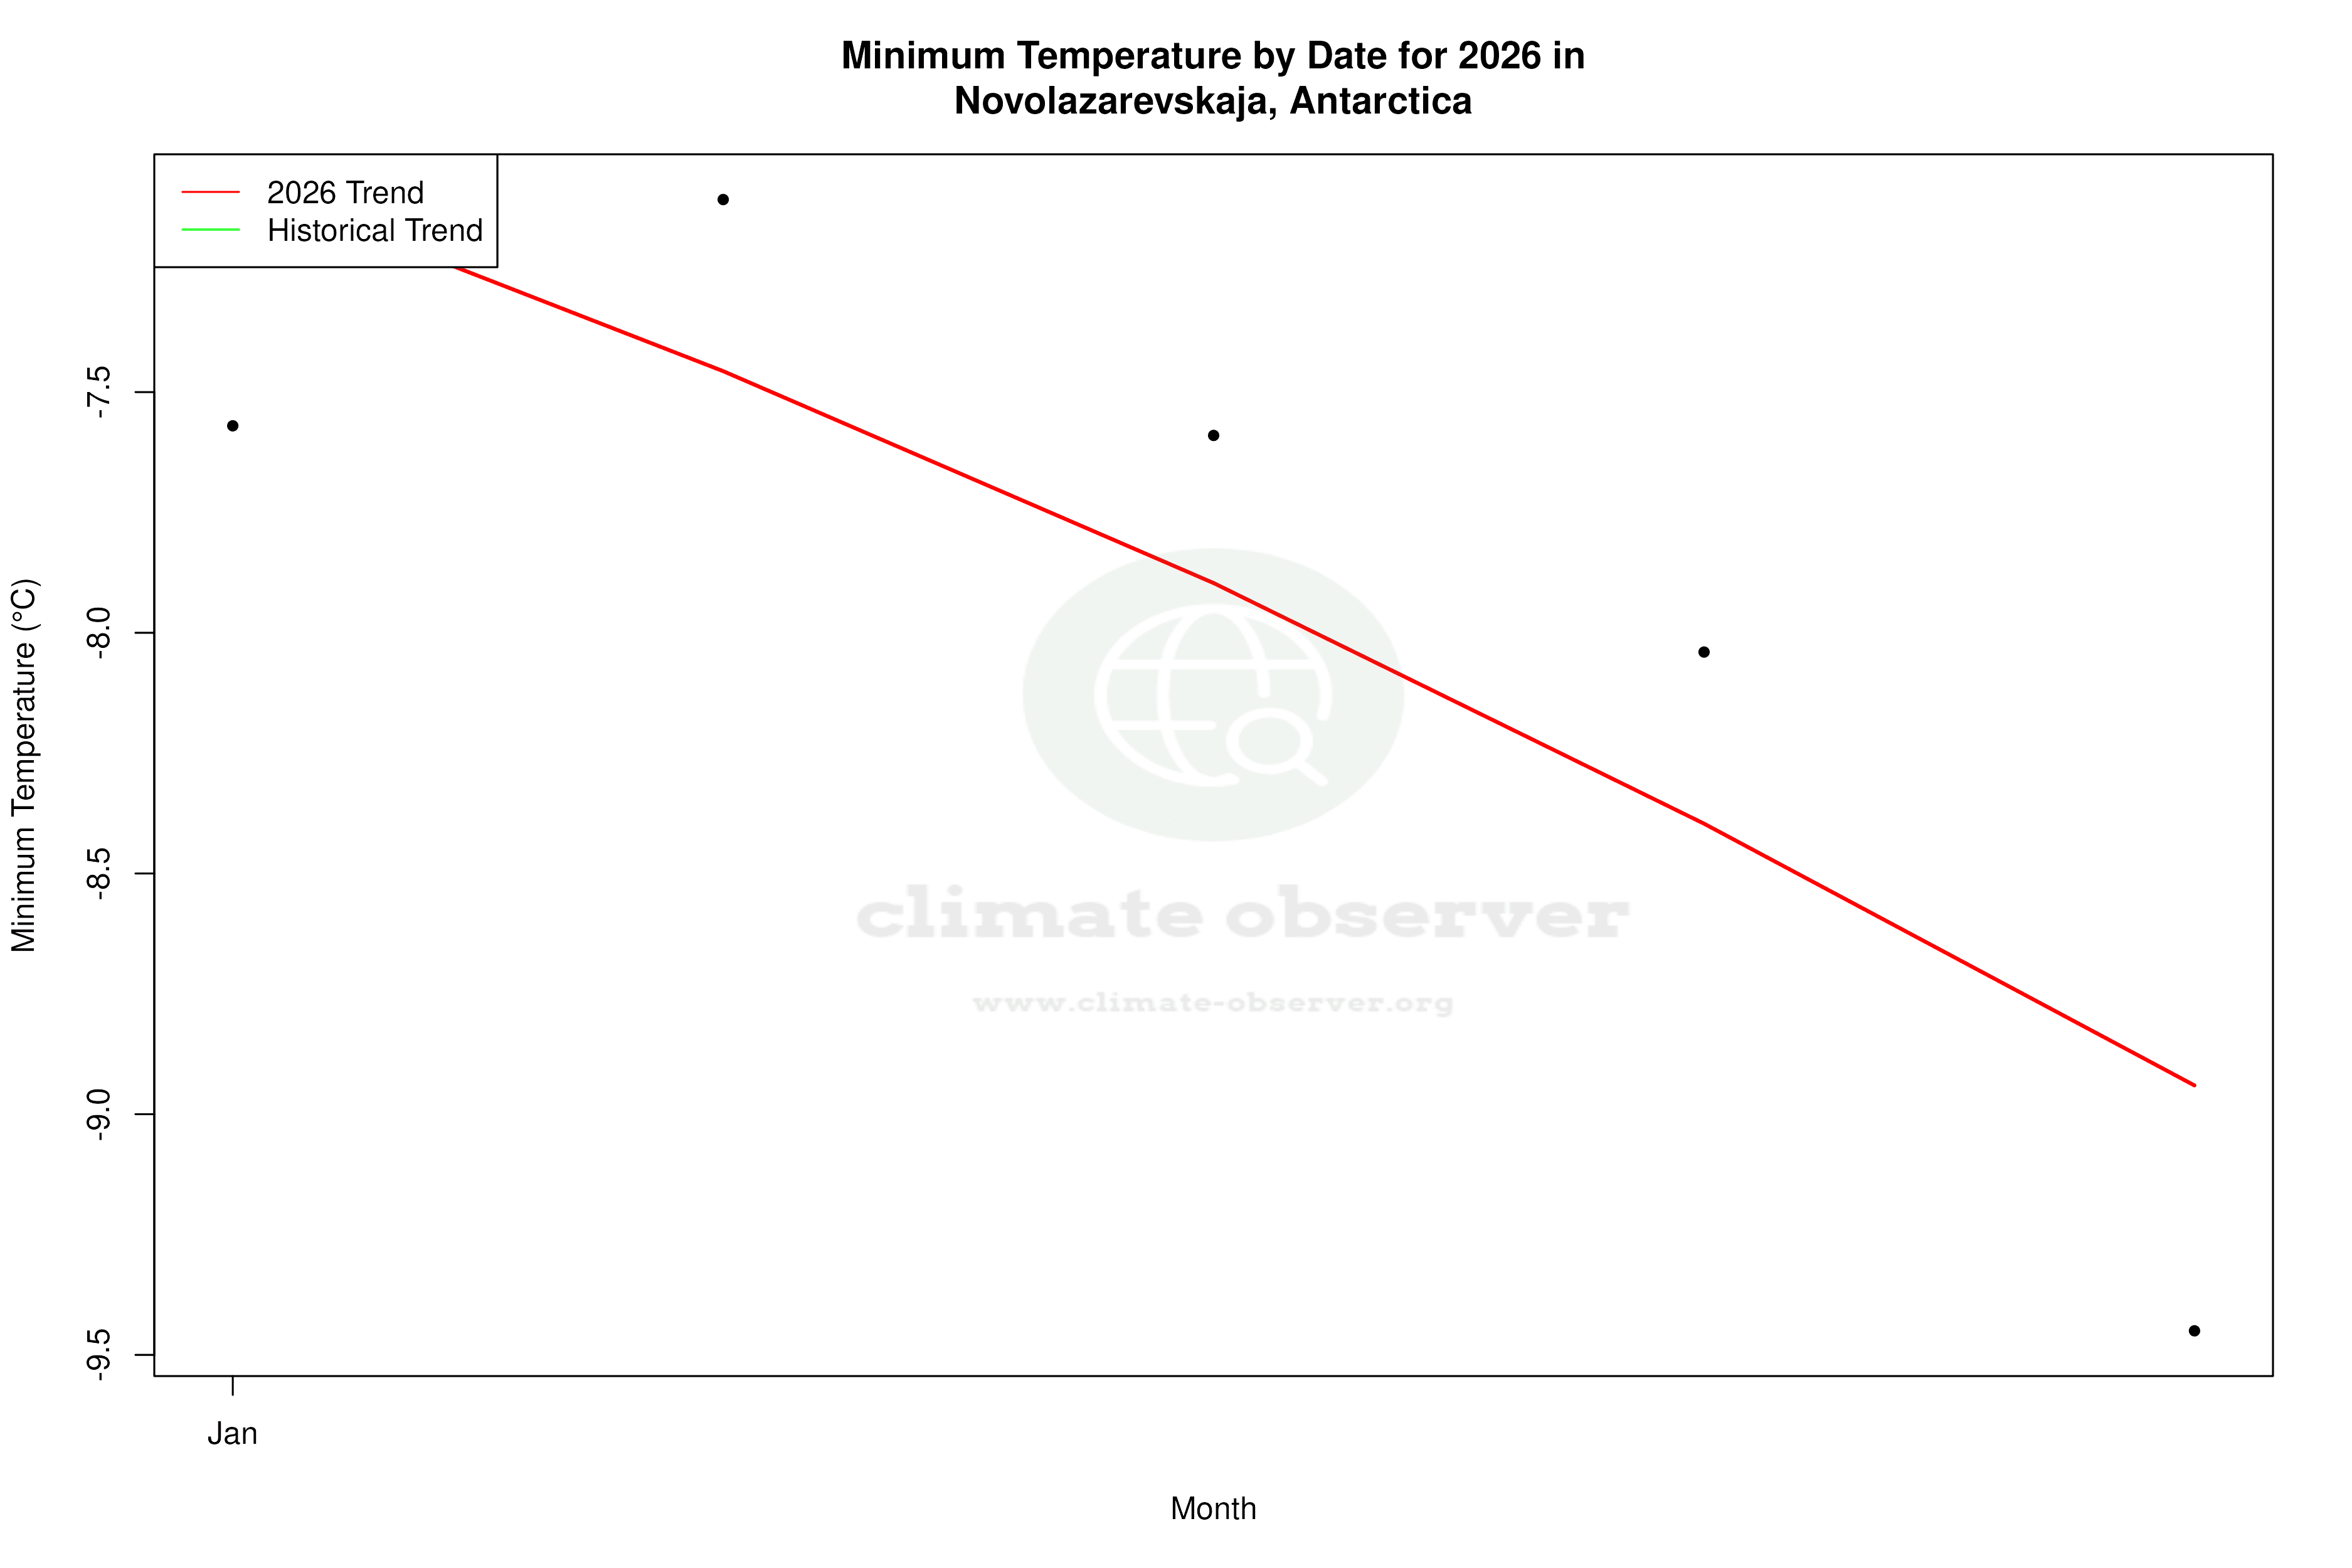


Max Temperature this Year | 1 of 6
Climate 12-Month Moving Averages


Max Temperature 12-Month MA | 1 of 6
Daily Data Points and Averages Throughout the Year


Average Max Temperature Throughout Year | 1 of 5