Climate for Station: Uccle, Belgium
Loading live weather...
Climate Analysis & Overview
Uccle's climate profile reveals a subtle yet noteworthy warming trend over both short and long-term periods. The temperature highs and lows have increased, with a more even distribution of precipitation in recent years. These changes align with broader regional climate goals to mitigate extreme weather impacts.
Subtle Thermal Shifts in Uccle
Uccle, located in the Brussels-Capital Region of Belgium, experiences a temperate oceanic climate, classified as Cfb in the Köppen system. This classification is characterised by mild temperatures and moderate rainfall throughout the year. Over the past decade, Uccle has experienced a warming trend, with high temperatures increasing by 0.61°C (1.10°F) and low temperatures rising by 0.88°C (1.59°F). These changes are more pronounced than the all-time trends, which show a smaller rise in highs by 0.07°C (0.13°F) and lows by 0.11°C (0.20°F). This suggests a recent acceleration in warming, possibly influenced by urban heat effects and global climate dynamics.
Precipitation Patterns: A Smoother Ride
The Precipitation Concentration Index (PCI) in Uccle has decreased from a baseline of 11.1 to a current value of 9.4. This indicates a more even distribution of rainfall events, as the PCI measures how concentrated precipitation is over a period. A lower PCI suggests that rain is now falling more consistently throughout the year, rather than in fewer, more intense events. This shift could be beneficial for local agriculture and water management, aligning with Belgium's climate goals to reduce the impact of severe weather.
Extremes in Historical Context
Uccle's historical temperature records include a maximum of 39.7°C (103.5°F) and a minimum of -21.1°C (-6.0°F). These extremes highlight the variability within the region's climate, although such temperatures are rare. The recent warming trends may increase the frequency of higher temperature extremes, necessitating adaptations in infrastructure and public health strategies.
Regional Climate Goals: A Balancing Act
Belgium has committed to ambitious climate targets, aiming to reduce greenhouse gas emissions and enhance resilience to climate impacts. The warming trends observed in Uccle are consistent with national patterns, underscoring the need for continued efforts in energy efficiency and renewable energy adoption. The more even precipitation distribution is a positive sign, potentially reducing the risk of floods and droughts, which are critical concerns for the region's densely populated and economically significant areas.
Geographic Influences on Climate Dynamics
Uccle's location within the Brussels-Capital Region means it is influenced by both urban and natural factors. The urban heat island effect, where built environments retain more heat, may contribute to the observed warming trends. Additionally, the region's proximity to the North Sea can moderate temperatures, preventing extreme cold or heat. This interplay of geographic factors shapes Uccle's unique climate profile, providing both challenges and opportunities for adaptation in the face of climate change.
Station Statistics
10-Year Trend
High: +0.59 °C/decade
Low: +0.87 °C/decade
Rain: +0.10 mm/decade
25-Year Trend
High: +0.44 °C/decade
Low: +0.32 °C/decade
Rain: -0.06 mm/decade
50-Year Trend
High: +0.47 °C/decade
Low: +0.39 °C/decade
Rain: +0.00 mm/decade
All-Time Trend
High: +0.08 °C/decade
Low: +0.11 °C/decade
Rain: +0.02 mm/decade
Percentage Above-Average Days
Last 12 Months: 59.7%
This Year: 66.3%
Precipitation Concentration Index (PCI) ℹ️
Last 12 Months: 9.8
Historical Average: 10.7
Percentile Rank of Last 12 Months ℹ️
High: 96th percentile
Low: 98th percentile
Rain: 12th percentile
Change in Variance ℹ️
High: -6.5%
Low: -9.1%
Intraday: -7.5%
Data Coverage
76.2%
First Year of Data
1833
Station Location
Historical Weather Records
| Max High | Avg High | Min High | Max Avg | Avg Avg | Min Avg | Max Low | Avg Low | Min Low | Max Precipitation | Avg Precipitation | Max Snow | Avg Snow | |
|---|---|---|---|---|---|---|---|---|---|---|---|---|---|
| Record | 39.7 °C | — | -13.6 °C | 30.4 °C | — | -13.4 °C | 23.5 °C | — | -21.1 °C | 72.4 mm | — | — | — |
| January | 16.2 °C | 5.0 °C | -13.6 °C | 12.9 °C | 3.5 °C | -13.4 °C | 11.1 °C | -0.2 °C | -21.1 °C | 37.2 mm | 2.2 mm | — | — |
| February | 20.2 °C | 6.4 °C | -11.1 °C | 14.8 °C | 4.1 °C | -9.6 °C | 12.7 °C | 0.2 °C | -18.3 °C | 31.0 mm | 1.9 mm | — | — |
| March | 24.2 °C | 9.8 °C | -6.0 °C | 17.8 °C | 6.8 °C | -4.2 °C | 13.3 °C | 2.1 °C | -13.6 °C | 29.2 mm | 1.9 mm | — | — |
| April | 28.7 °C | 13.9 °C | 0.5 °C | 21.9 °C | 9.6 °C | -0.1 °C | 15.7 °C | 4.6 °C | -5.0 °C | 36.6 mm | 1.7 mm | — | — |
| May | 34.1 °C | 18.3 °C | 6.3 °C | 24.9 °C | 13.5 °C | 4.4 °C | 19.5 °C | 8.1 °C | -2.2 °C | 47.3 mm | 1.9 mm | — | — |
| June | 38.8 °C | 21.3 °C | 9.7 °C | 28.4 °C | 16.5 °C | 6.8 °C | 23.5 °C | 11.1 °C | 0.3 °C | 65.8 mm | 2.3 mm | — | — |
| July | 39.7 °C | 22.9 °C | 12.1 °C | 30.4 °C | 18.3 °C | 11.0 °C | 23.5 °C | 12.8 °C | 4.4 °C | 72.4 mm | 2.6 mm | — | — |
| August | 36.5 °C | 22.5 °C | 13.1 °C | 28.6 °C | 18.1 °C | 11.2 °C | 23.1 °C | 12.8 °C | 4.7 °C | 59.9 mm | 2.4 mm | — | — |
| September | 34.9 °C | 19.5 °C | 8.5 °C | 25.1 °C | 15.1 °C | 8.0 °C | 21.6 °C | 10.5 °C | 0.0 °C | 48.0 mm | 2.2 mm | — | — |
| October | 27.8 °C | 14.4 °C | 2.3 °C | 20.4 °C | 11.4 °C | 0.9 °C | 17.3 °C | 7.1 °C | -6.8 °C | 51.0 mm | 2.3 mm | — | — |
| November | 20.4 °C | 8.8 °C | -5.7 °C | 17.4 °C | 7.0 °C | -4.6 °C | 14.9 °C | 3.3 °C | -12.8 °C | 60.1 mm | 2.4 mm | — | — |
| December | 16.7 °C | 5.7 °C | -11.2 °C | 15.5 °C | 4.3 °C | -10.0 °C | 12.8 °C | 0.8 °C | -17.7 °C | 52.8 mm | 2.4 mm | — | — |
Data Visualisations
Remove WatermarksCurrent Year Climate Trends vs Historical


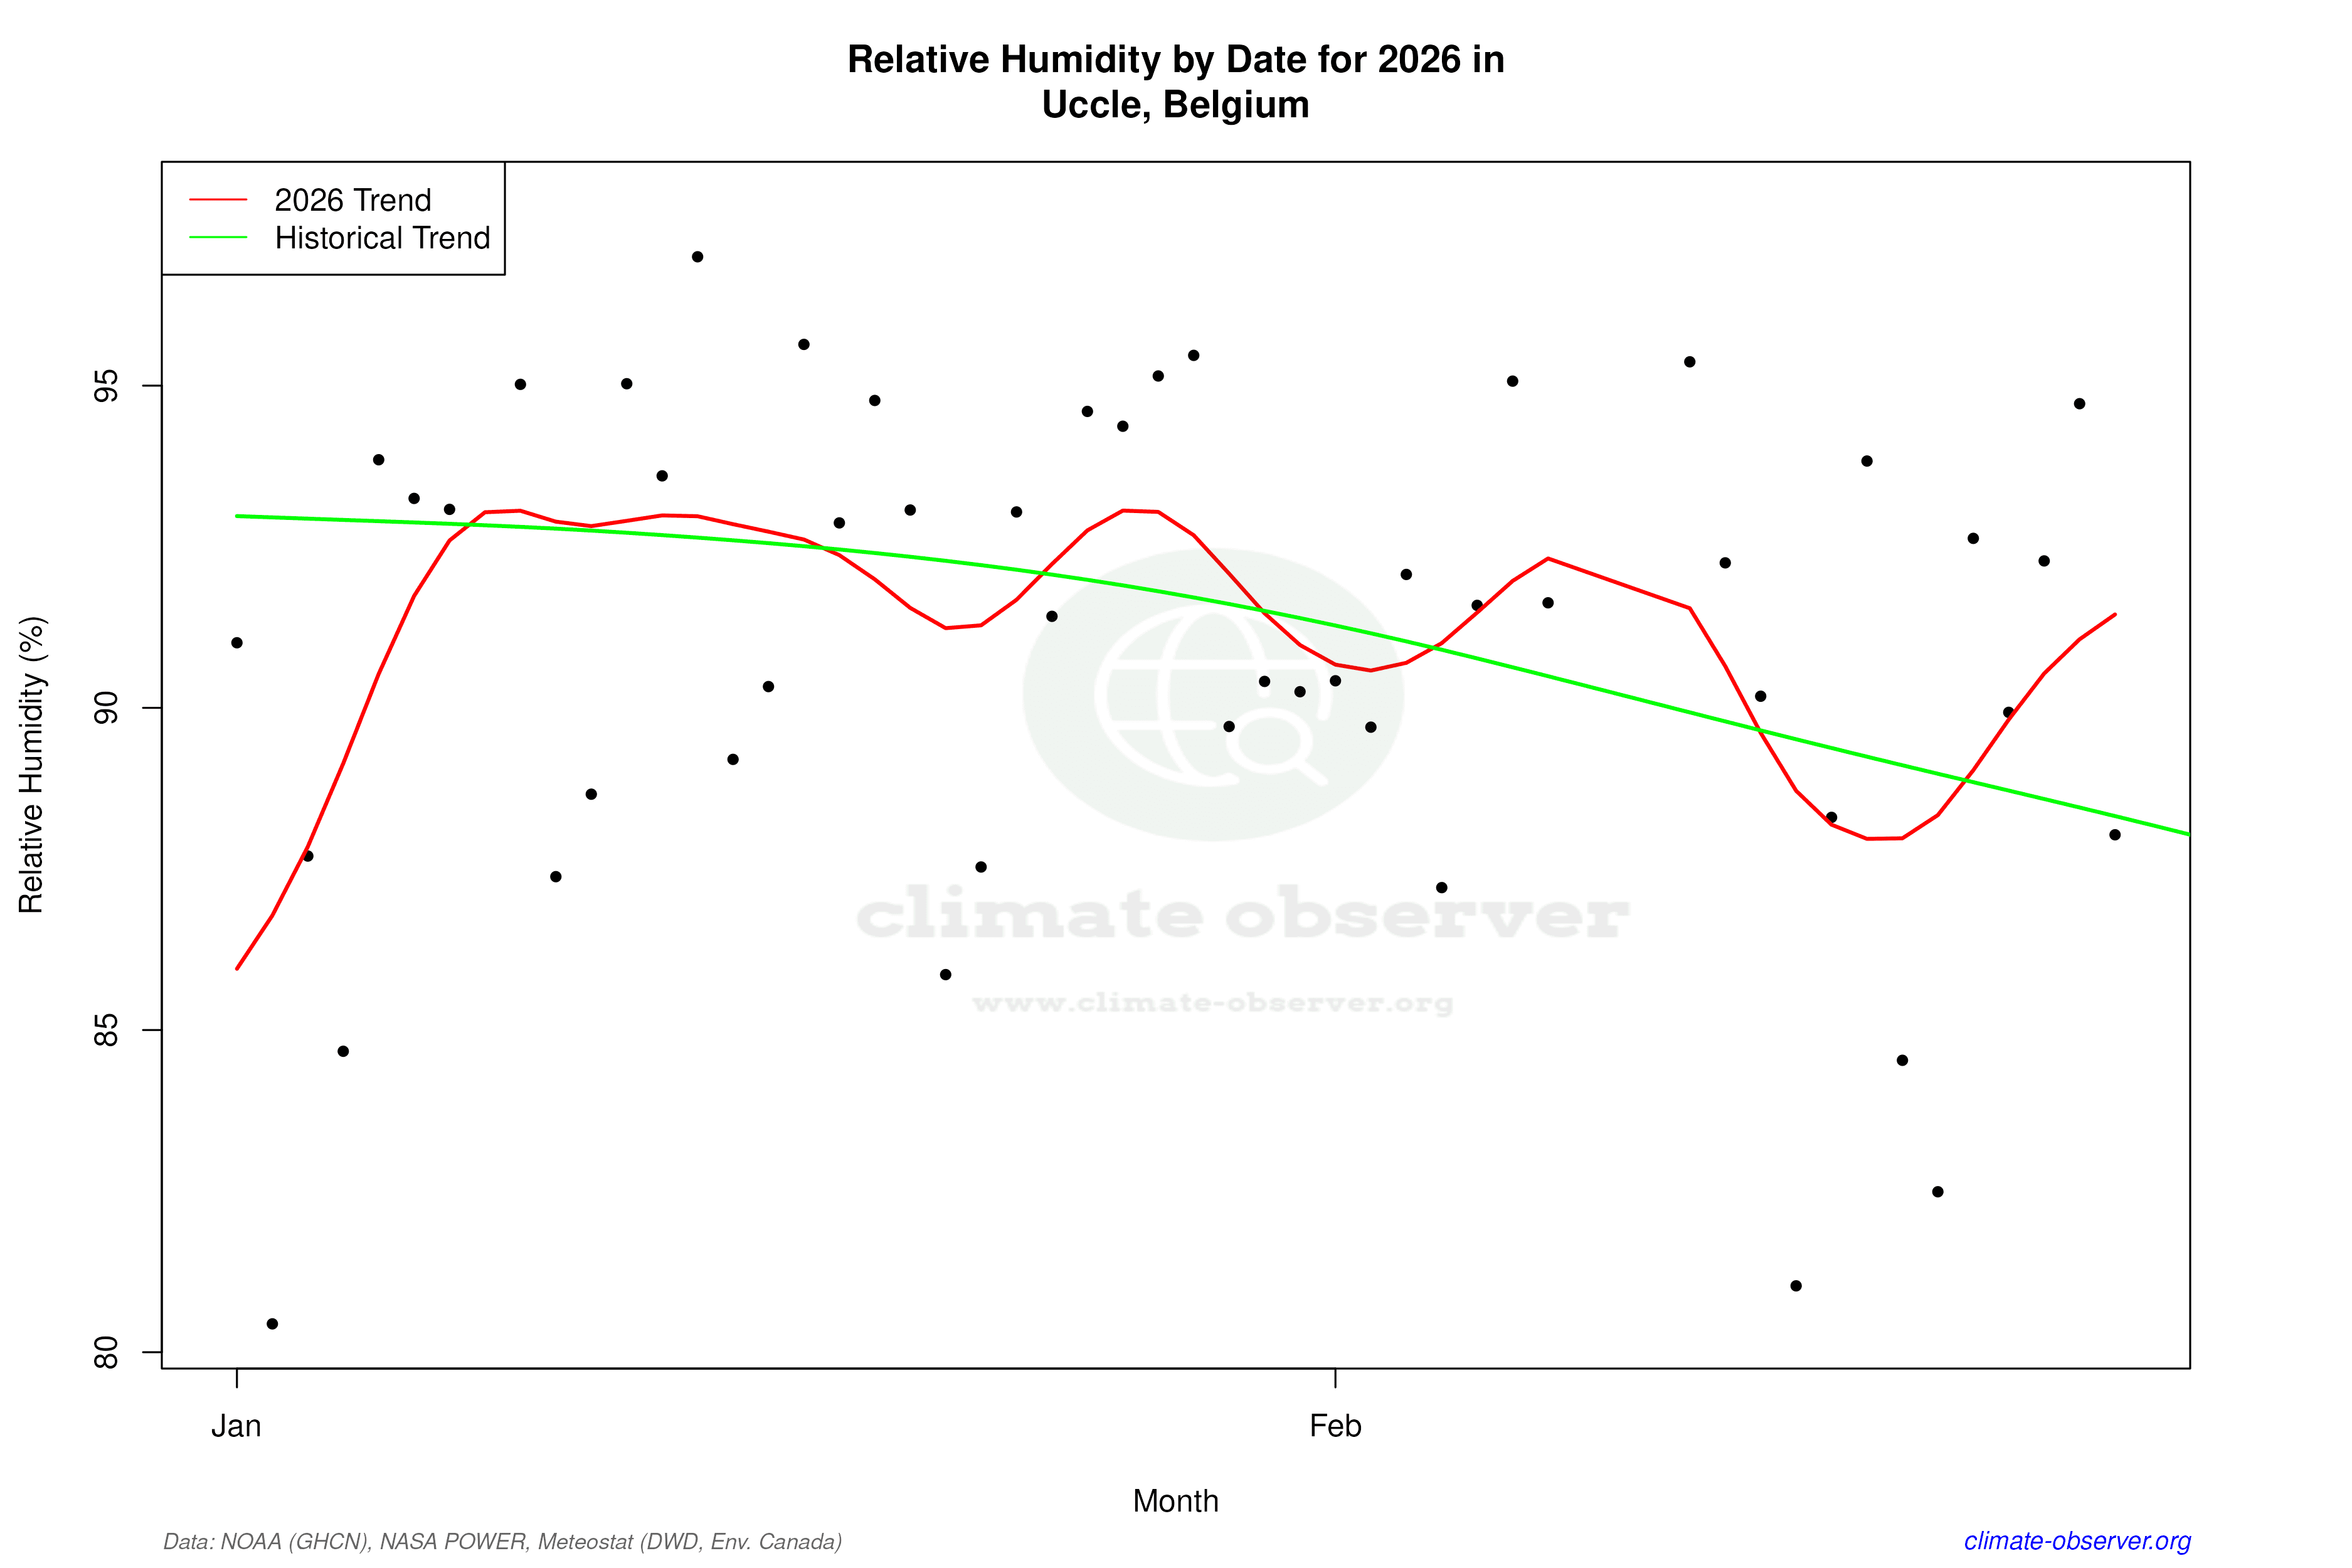

Max Temperature this Year | 1 of 6
Climate 12-Month Moving Averages


Max Temperature 12-Month MA | 1 of 6
Daily Data Points and Averages Throughout the Year


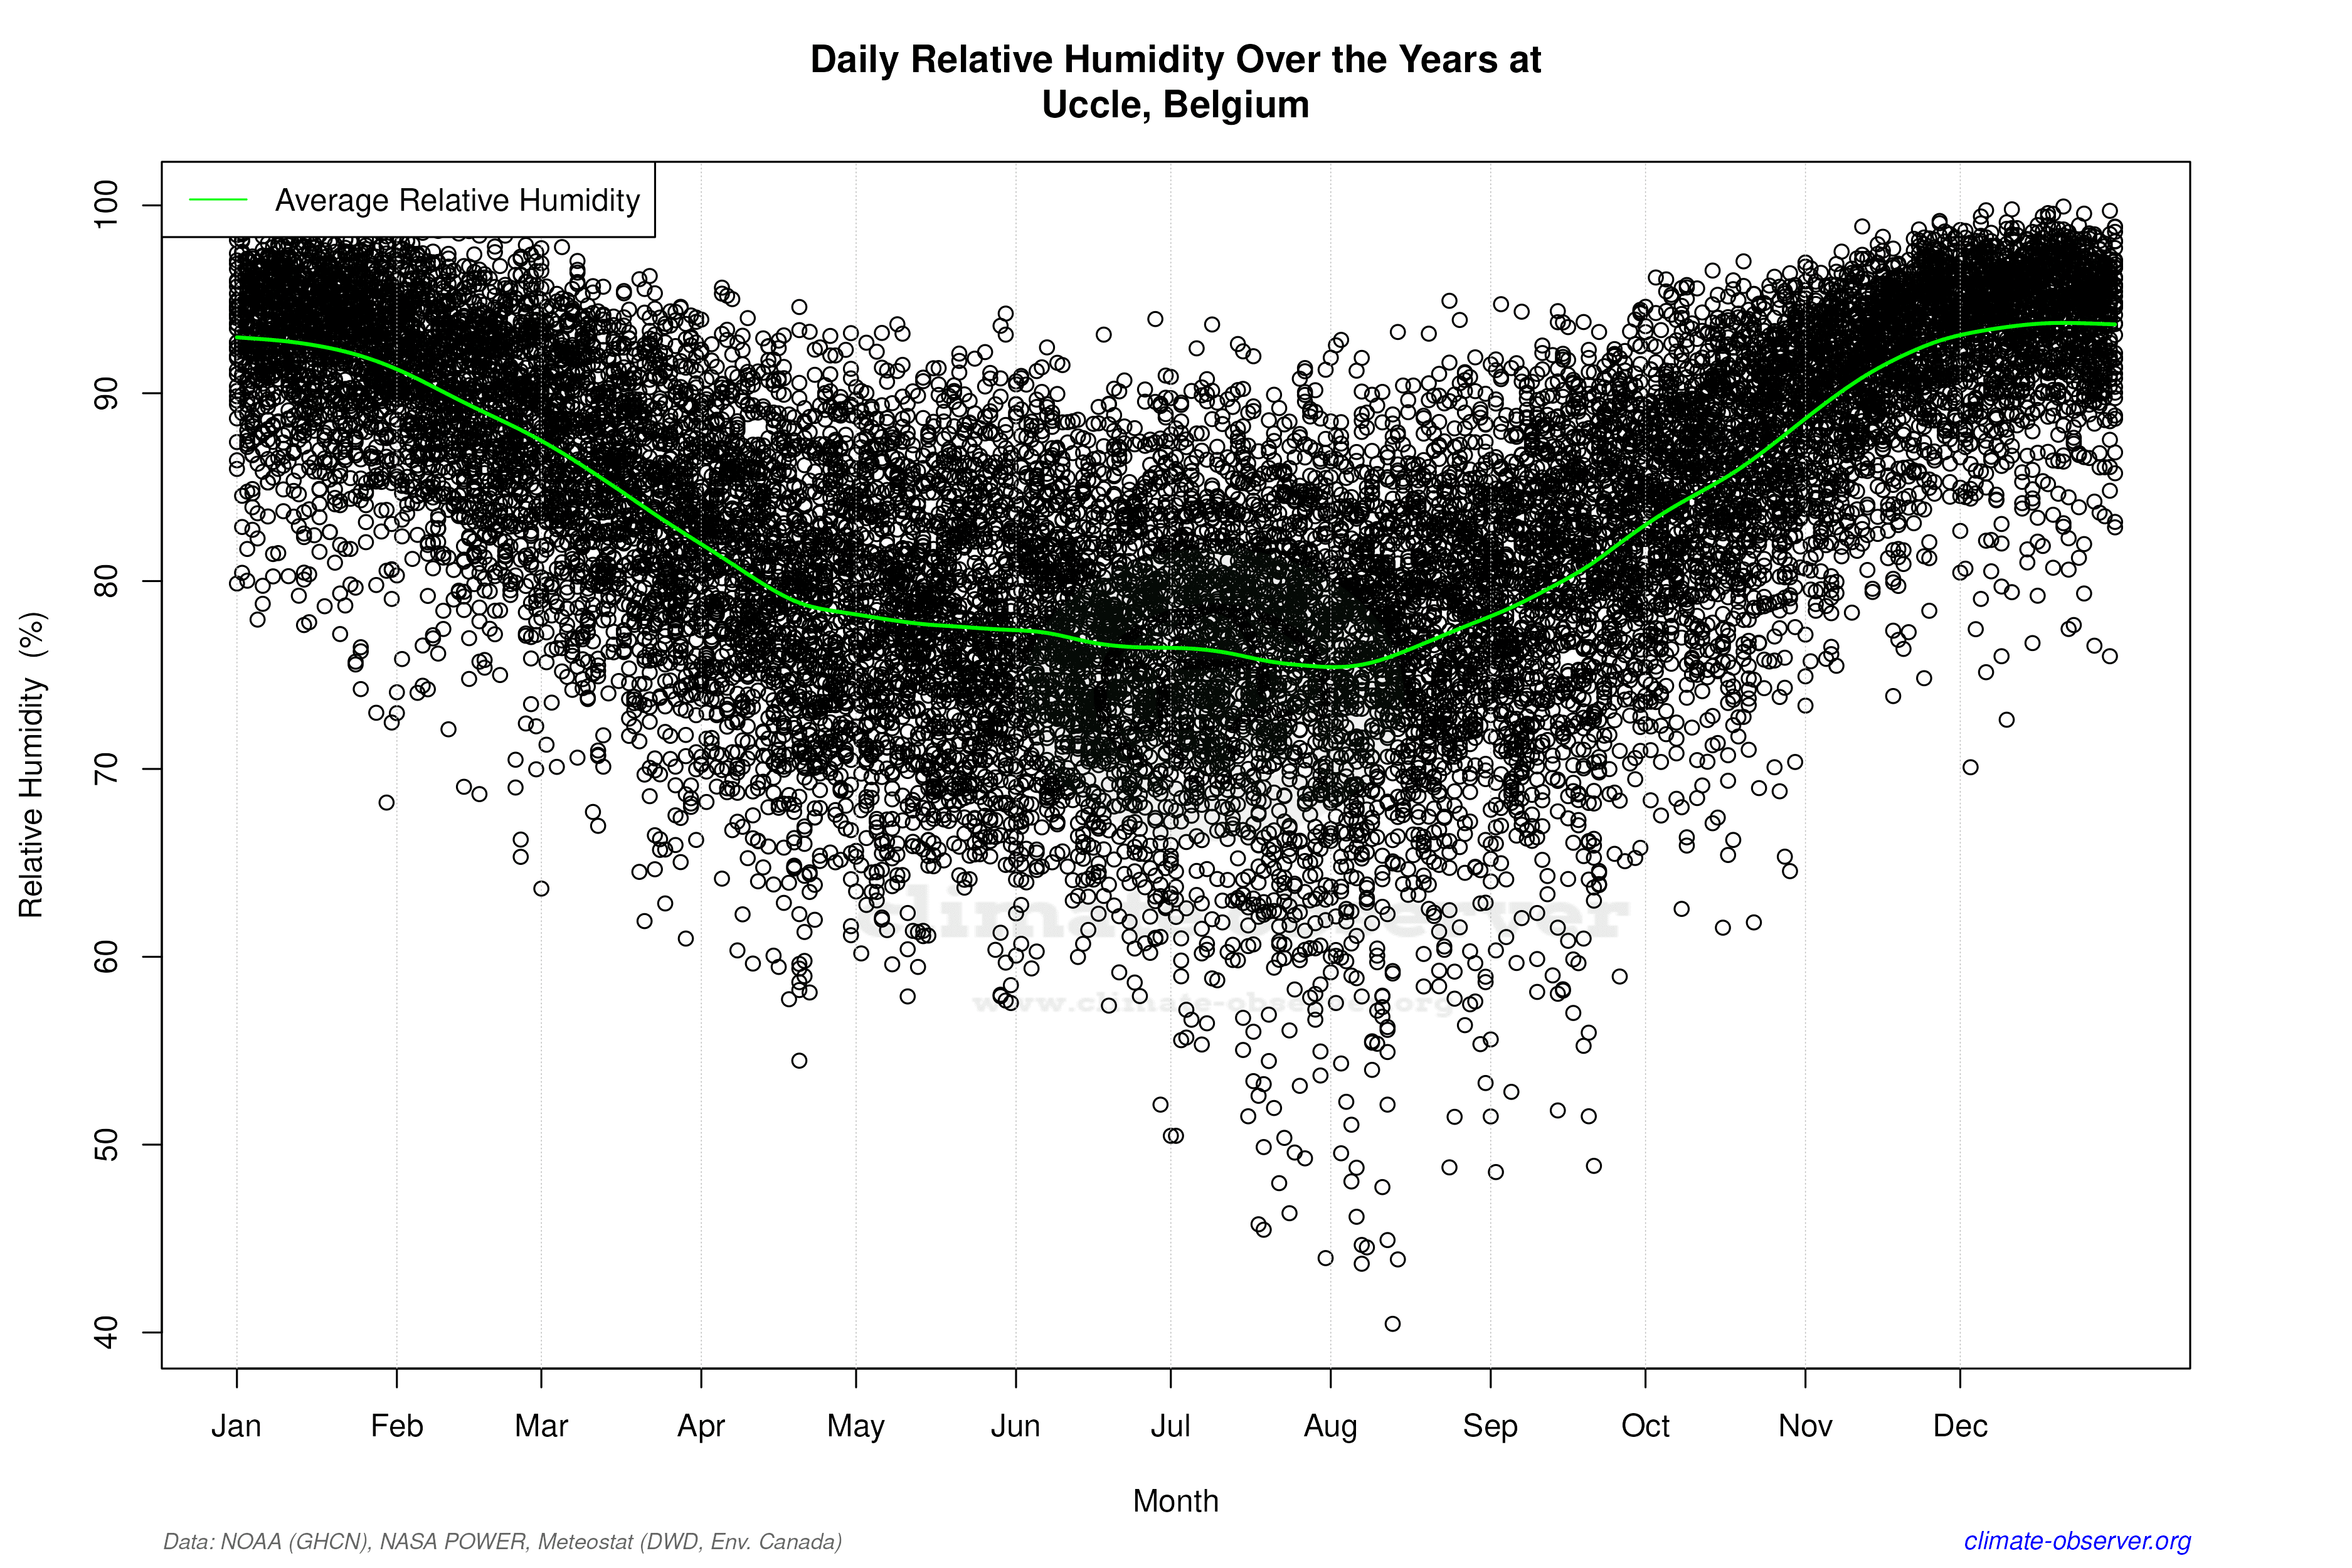

Average Max Temperature Throughout Year | 1 of 5
