Climate for Station: Philip s w Goldson Intl, Belize District, Belize
Loading live weather...
Climate Analysis & Overview
Philip S. W. Goldson International Airport is experiencing a complex climate narrative. While the all-time temperature trend shows a slight warming, recent years reveal a stark contrast with significant short-term cooling in lows. Precipitation patterns are becoming slightly more concentrated, hinting at evolving weather dynamics in Belize's tropical climate.
Tropical Climate Dynamics
Philip S. W. Goldson International Airport, located at 17.539°N, -88.308°W, sits within Belize's tropical monsoon climate zone, classified under the Köppen system as Am. This classification indicates a climate with a pronounced wet season and a short dry spell. The airport's proximity to the Caribbean Sea influences its weather patterns, contributing to high humidity and substantial rainfall during the wet season. The surrounding lowlands and coastal geography also play a role in moderating temperature fluctuations.
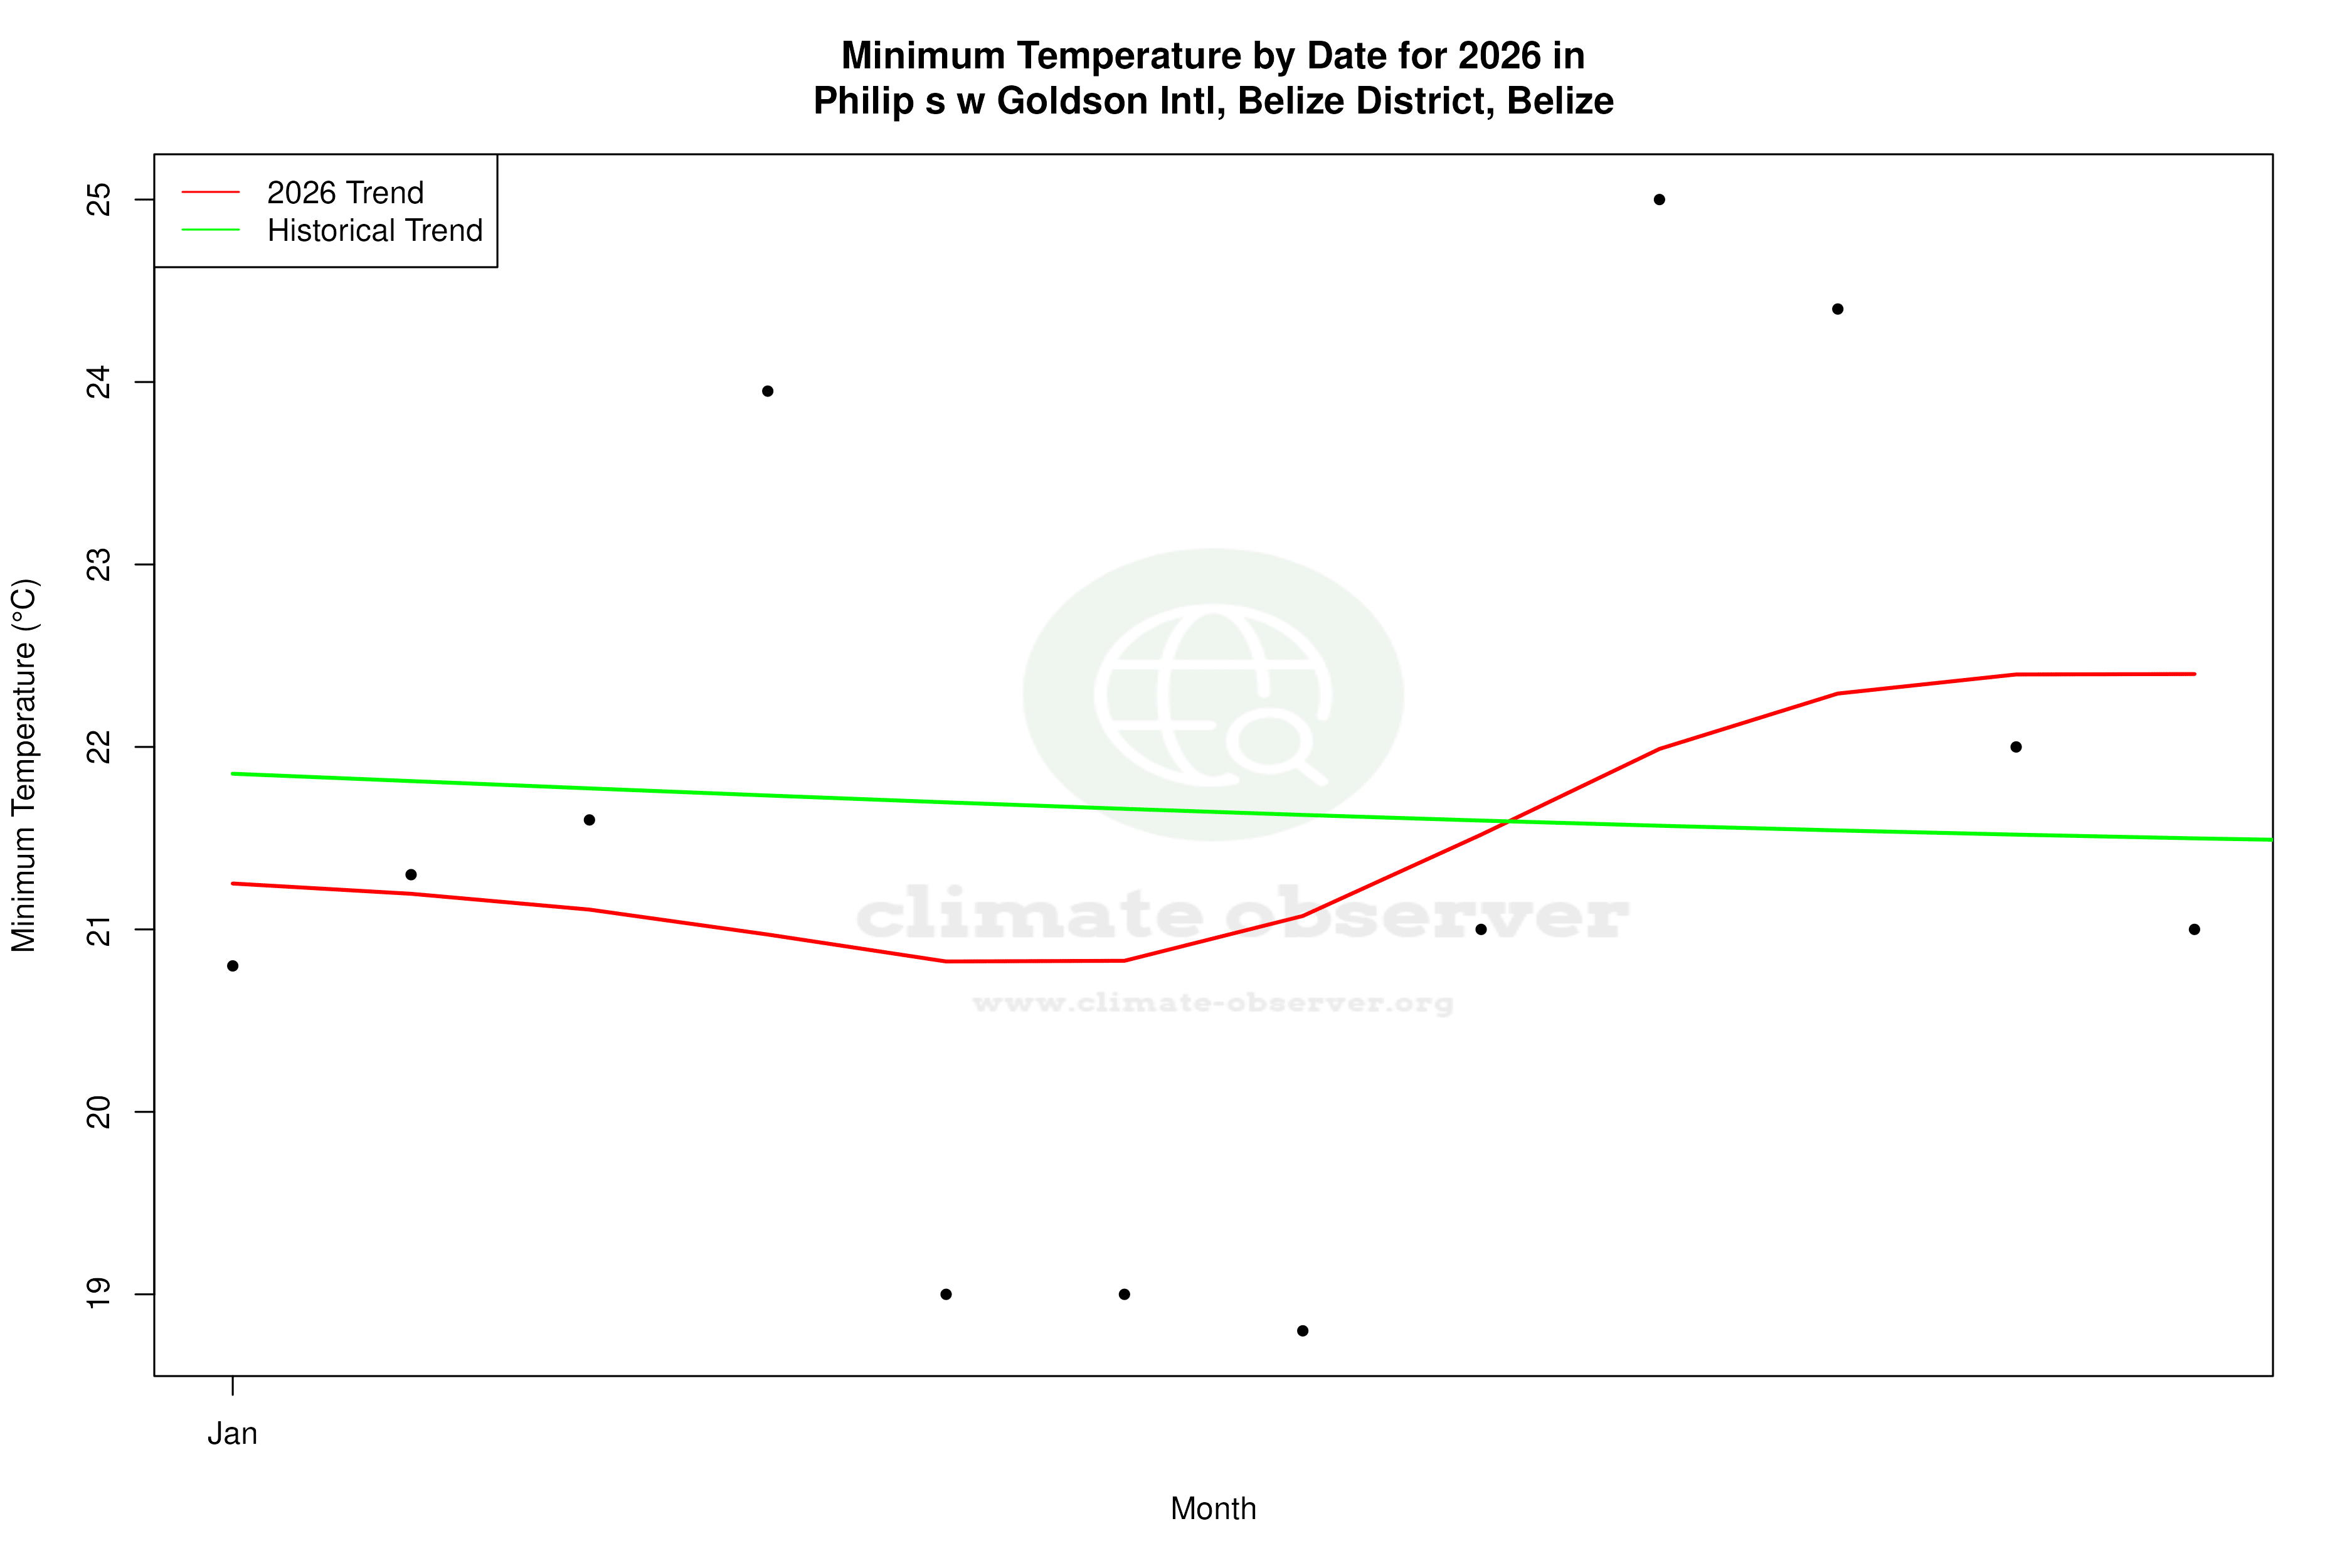
Temperature Trends: A Dual Narrative
The all-time temperature trends at the airport reveal a subtle warming, with highs increasing by 0.20°C (0.36°F) and lows by 0.09°C (0.16°F). However, the 10-year trends tell a different story. Recent data indicates a significant warming in highs by 1.54°C (2.78°F), contrasted by a cooling of lows by -1.37°C (-2.46°F). This divergence suggests a growing temperature range between day and night, which could have implications for local agriculture and energy consumption.
Precipitation Patterns: Slight Concentration
The Precipitation Concentration Index (PCI) at Philip S. W. Goldson International Airport has seen a marginal increase from a baseline of 13.78 to the current 14.03. The PCI measures how rainfall is distributed over time, with higher values indicating more concentrated rainfall events. This slight increase suggests that precipitation is becoming marginally more concentrated in fewer, possibly more intense, events. While not yet reaching levels of significant concern, this trend could affect water management strategies and flood risk assessments in the region.
Record Extremes: A Snapshot
The airport has recorded temperature extremes with a maximum of 37.0°C (98.6°F) and a minimum of 10.9°C (51.6°F). These records highlight the potential for both intense heat and cooler nights, despite the generally warm climate. Such extremes are crucial for understanding the range of conditions that local infrastructure and ecosystems must withstand.
Regional Climate Context
Belize has been actively engaging in regional climate initiatives, aiming to mitigate the impacts of climate change through sustainable practices and resilience-building measures. The observed climate trends at Philip S. W. Goldson International Airport provide valuable insights into the effectiveness of these efforts and the challenges that lie ahead. As Belize continues to navigate its climate future, understanding these localised trends will be essential for informed decision-making and policy development.
Station Statistics
10-Year Trend
High: +1.16 °C/decade
Low: -1.18 °C/decade
Rain: +0.14 mm/decade
25-Year Trend
High: +0.67 °C/decade
Low: -0.34 °C/decade
Rain: -0.03 mm/decade
50-Year Trend
High: +0.20 °C/decade
Low: +0.08 °C/decade
Rain: +0.25 mm/decade
All-Time Trend
High: +0.20 °C/decade
Low: +0.08 °C/decade
Rain: +0.25 mm/decade
Percentage Above-Average Days
Last 12 Months: 53.7%
This Year: 23.7%
Precipitation Concentration Index (PCI) ℹ️
Last 12 Months: 10.7
Historical Average: 13.2
Percentile Rank of Last 12 Months ℹ️
High: 84th percentile
Low: 27th percentile
Rain: 77th percentile
Change in Variance ℹ️
High: +6.5%
Low: -15.0%
Intraday: -37.5%
Data Coverage
75.8%
First Year of Data
1960
Station Location
Historical Weather Records
| Max High | Avg High | Min High | Max Avg | Avg Avg | Min Avg | Max Low | Avg Low | Min Low | Max Precipitation | Avg Precipitation | Max Snow | Avg Snow | |
|---|---|---|---|---|---|---|---|---|---|---|---|---|---|
| Record | 37.0 °C | — | 19.3 °C | 34.1 °C | — | 16.5 °C | 29.2 °C | — | 10.9 °C | 496.1 mm | — | — | — |
| January | 34.2 °C | 27.6 °C | 21.3 °C | 28.5 °C | 24.5 °C | 17.2 °C | 26.4 °C | 21.5 °C | 11.0 °C | 196.1 mm | 4.1 mm | — | — |
| February | 35.0 °C | 28.4 °C | 20.7 °C | 29.9 °C | 25.4 °C | 16.5 °C | 26.5 °C | 22.2 °C | 11.5 °C | 196.1 mm | 2.3 mm | — | — |
| March | 36.1 °C | 29.4 °C | 23.8 °C | 31.4 °C | 26.5 °C | 18.8 °C | 27.0 °C | 23.1 °C | 10.9 °C | 51.8 mm | 1.5 mm | — | — |
| April | 36.4 °C | 30.5 °C | 25.1 °C | 31.7 °C | 27.9 °C | 22.4 °C | 28.1 °C | 24.5 °C | 15.0 °C | 291.1 mm | 1.7 mm | — | — |
| May | 37.0 °C | 31.3 °C | 26.8 °C | 34.1 °C | 28.8 °C | 24.2 °C | 28.9 °C | 25.6 °C | 19.0 °C | 496.1 mm | 3.6 mm | — | — |
| June | 36.3 °C | 30.9 °C | 26.7 °C | 33.1 °C | 28.8 °C | 23.4 °C | 29.1 °C | 26.0 °C | 18.0 °C | 491.0 mm | 7.8 mm | — | — |
| July | 34.0 °C | 30.6 °C | 26.7 °C | 32.6 °C | 28.7 °C | 23.8 °C | 28.6 °C | 25.7 °C | 20.7 °C | 436.1 mm | 6.2 mm | — | — |
| August | 35.0 °C | 31.0 °C | 27.1 °C | 34.0 °C | 28.8 °C | 24.0 °C | 28.8 °C | 25.7 °C | 21.0 °C | 280.9 mm | 5.3 mm | — | — |
| September | 35.3 °C | 30.9 °C | 26.8 °C | 31.8 °C | 28.5 °C | 23.8 °C | 29.2 °C | 25.6 °C | 19.3 °C | 163.6 mm | 6.6 mm | — | — |
| October | 35.4 °C | 30.1 °C | 25.0 °C | 32.1 °C | 27.4 °C | 22.0 °C | 29.0 °C | 24.5 °C | 16.1 °C | 495.0 mm | 8.6 mm | — | — |
| November | 33.3 °C | 28.8 °C | 22.3 °C | 31.2 °C | 25.9 °C | 20.1 °C | 27.7 °C | 22.9 °C | 14.4 °C | 291.1 mm | 7.2 mm | — | — |
| December | 34.0 °C | 28.0 °C | 19.3 °C | 30.4 °C | 24.9 °C | 17.6 °C | 27.0 °C | 22.0 °C | 12.0 °C | 99.1 mm | 4.0 mm | — | — |
Data Visualisations
Remove WatermarksCurrent Year Climate Trends vs Historical


Max Temperature this Year | 1 of 6
Climate 12-Month Moving Averages


Max Temperature 12-Month MA | 1 of 6
Daily Data Points and Averages Throughout the Year


Average Max Temperature Throughout Year | 1 of 5
