Climate for Station: El Alto Intl, La Paz, Bolivia
Loading live weather...
Climate Analysis & Overview
El Alto International Airport is experiencing a nuanced climate evolution, with a 0.40°C (0.72°F) rise in all-time high temperatures and a minor -0.02°C (-0.04°F) fall in all-time low temperatures. The region's precipitation is becoming more evenly distributed, as indicated by a decrease in the Precipitation Concentration Index from 16.46 to 13.34.
High-Altitude Climate Dynamics
El Alto International Airport, situated at an elevation of approximately 4,061 metres in the Andes, experiences a Tundra climate (ET) according to the Köppen classification. The high altitude contributes to significant temperature variations and influences local weather patterns. Over the past decade, the station has observed a -0.27°C (-0.49°F) decrease in high temperatures, contrasting the all-time trend of a 0.40°C (0.72°F) rise. This divergence suggests short-term cooling against a backdrop of long-term warming, possibly influenced by regional climatic cycles or localised atmospheric conditions.
Temperature Extremes and Variability
The temperature records at El Alto International Airport reveal a maximum of 25.4°C (77.7°F) and a minimum of -13.2°C (8.2°F). These extremes highlight the station's susceptibility to significant thermal oscillations, characteristic of high-altitude environments. The all-time trends indicate a slight warming in high temperatures, while low temperatures have experienced a negligible -0.02°C (-0.04°F) decline, suggesting a stabilisation in nocturnal cooling patterns.
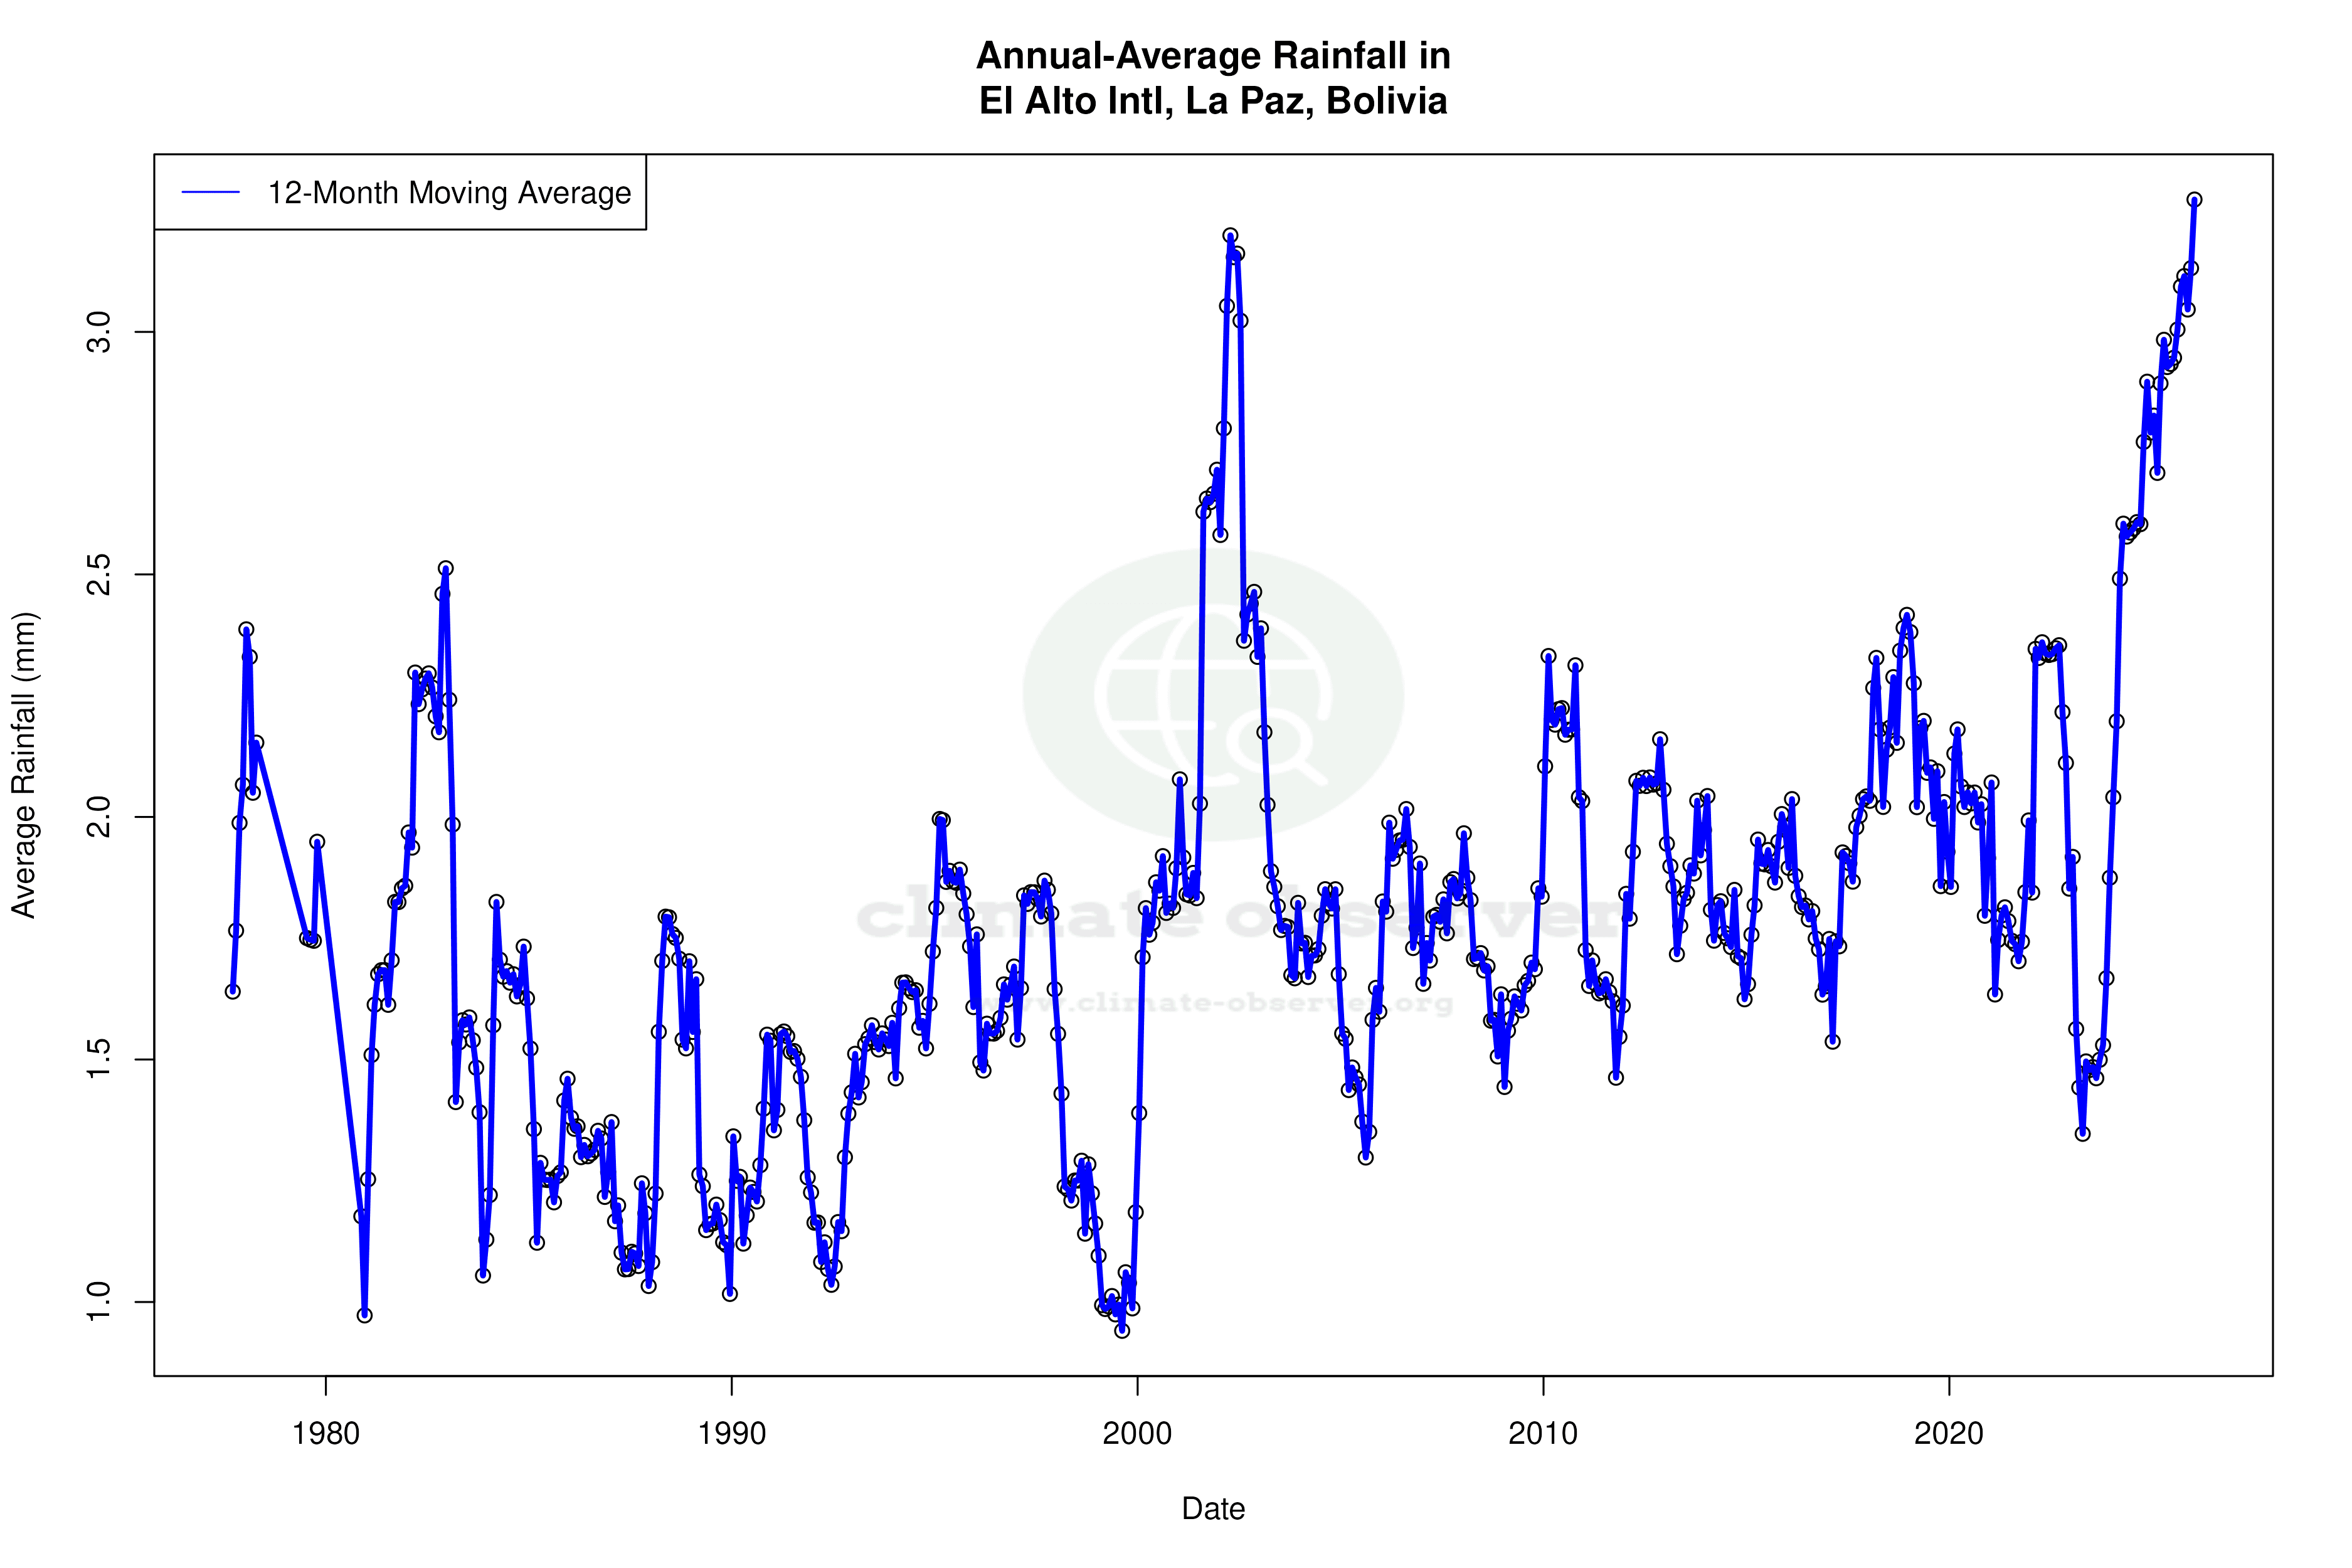
Precipitation Patterns Shifting
The Precipitation Concentration Index (PCI), which measures how precipitation is distributed over time, has decreased from 16.46 to 13.34. This shift indicates a more even distribution of rainfall events, moving away from concentrated downpours towards more regular precipitation. Such a change can have significant implications for agriculture and water resource management in the region, aligning with Bolivia's broader climate goals of enhancing water security and resilience against extreme weather.
Decadal Trends and Regional Implications
While the 10-year trends show a 0.16°C (0.29°F) increase in low temperatures, the all-time data presents a contrasting picture of a -0.02°C (-0.04°F) fall. This discrepancy underscores the complexity of climate dynamics at high altitudes, where short-term variations may not always align with longer-term patterns. The interplay between these trends is crucial for understanding the potential impacts on local ecosystems and human activities.
Strategic Climate Insights
In the context of Bolivia's regional climate objectives, the observed trends at El Alto International Airport provide valuable insights. The more even precipitation distribution supports efforts to mitigate flood risks and enhance agricultural productivity. Meanwhile, the nuanced temperature changes call for adaptive strategies to manage potential impacts on biodiversity and infrastructure. These findings are essential for policymakers and stakeholders aiming to navigate the challenges of climate change in high-altitude regions.
Station Statistics
10-Year Trend
High: -0.54 °C/decade
Low: +0.56 °C/decade
Rain: +0.78 mm/decade
25-Year Trend
High: +0.43 °C/decade
Low: +0.15 °C/decade
Rain: +0.14 mm/decade
50-Year Trend
High: +0.38 °C/decade
Low: -0.03 °C/decade
Rain: +0.16 mm/decade
All-Time Trend
High: +0.38 °C/decade
Low: -0.00 °C/decade
Rain: +0.16 mm/decade
Percentage Above-Average Days
Last 12 Months: 35.3%
This Year: 45.7%
Precipitation Concentration Index (PCI) ℹ️
Last 12 Months: 10.9
Historical Average: 15.4
Percentile Rank of Last 12 Months ℹ️
High: 27th percentile
Low: 99th percentile
Rain: 96th percentile
Change in Variance ℹ️
High: -0.5%
Low: +31.7%
Intraday: +41.5%
Data Coverage
65.1%
First Year of Data
1942
Station Location
Historical Weather Records
| Max High | Avg High | Min High | Max Avg | Avg Avg | Min Avg | Max Low | Avg Low | Min Low | Max Precipitation | Avg Precipitation | Max Snow | Avg Snow | |
|---|---|---|---|---|---|---|---|---|---|---|---|---|---|
| Record | 25.4 °C | — | 6.0 °C | 15.8 °C | — | -2.1 °C | 8.0 °C | — | -13.2 °C | 80.0 mm | — | — | — |
| January | 25.4 °C | 14.9 °C | 8.9 °C | 13.9 °C | 8.4 °C | 4.3 °C | 7.7 °C | 3.9 °C | -3.3 °C | 62.0 mm | 4.4 mm | — | — |
| February | 22.9 °C | 14.9 °C | 9.0 °C | 13.0 °C | 8.3 °C | 4.4 °C | 8.0 °C | 3.8 °C | -3.3 °C | 70.1 mm | 3.7 mm | — | — |
| March | 25.2 °C | 15.0 °C | 6.0 °C | 13.7 °C | 8.2 °C | 3.7 °C | 7.7 °C | 3.3 °C | -3.5 °C | 57.9 mm | 2.9 mm | — | — |
| April | 23.0 °C | 15.2 °C | 9.0 °C | 12.9 °C | 7.8 °C | 3.8 °C | 7.0 °C | 1.5 °C | -5.2 °C | 30.0 mm | 1.4 mm | — | — |
| May | 21.5 °C | 15.1 °C | 9.1 °C | 13.1 °C | 6.7 °C | 0.6 °C | 6.0 °C | -1.5 °C | -10.2 °C | 21.8 mm | 0.5 mm | — | — |
| June | 20.0 °C | 14.3 °C | 7.0 °C | 13.2 °C | 5.6 °C | 0.0 °C | 5.2 °C | -3.3 °C | -12.5 °C | 11.2 mm | 0.3 mm | — | — |
| July | 20.0 °C | 14.3 °C | 6.0 °C | 11.8 °C | 5.3 °C | -2.1 °C | 4.5 °C | -3.8 °C | -12.6 °C | 58.4 mm | 0.3 mm | — | — |
| August | 21.0 °C | 15.3 °C | 6.0 °C | 13.9 °C | 6.2 °C | -0.2 °C | 4.0 °C | -2.7 °C | -13.2 °C | 74.0 mm | 0.7 mm | — | — |
| September | 22.0 °C | 15.8 °C | 6.8 °C | 14.9 °C | 7.2 °C | 1.1 °C | 6.5 °C | -0.5 °C | -10.0 °C | 80.0 mm | 1.0 mm | — | — |
| October | 22.2 °C | 16.4 °C | 6.9 °C | 15.8 °C | 8.3 °C | 2.8 °C | 6.8 °C | 1.4 °C | -5.8 °C | 29.0 mm | 1.6 mm | — | — |
| November | 24.3 °C | 16.9 °C | 7.2 °C | 15.4 °C | 9.1 °C | 3.6 °C | 7.3 °C | 2.5 °C | -5.0 °C | 36.1 mm | 1.9 mm | — | — |
| December | 21.8 °C | 16.1 °C | 8.0 °C | 14.4 °C | 8.9 °C | 4.2 °C | 7.4 °C | 3.5 °C | -4.7 °C | 56.9 mm | 3.2 mm | — | — |
Data Visualisations
Remove WatermarksCurrent Year Climate Trends vs Historical


Max Temperature this Year | 1 of 6
Climate 12-Month Moving Averages


Max Temperature 12-Month MA | 1 of 6
Daily Data Points and Averages Throughout the Year


Average Max Temperature Throughout Year | 1 of 5
