Climate for Station: Minsk, Belarus
Loading live weather...
Climate Analysis & Overview
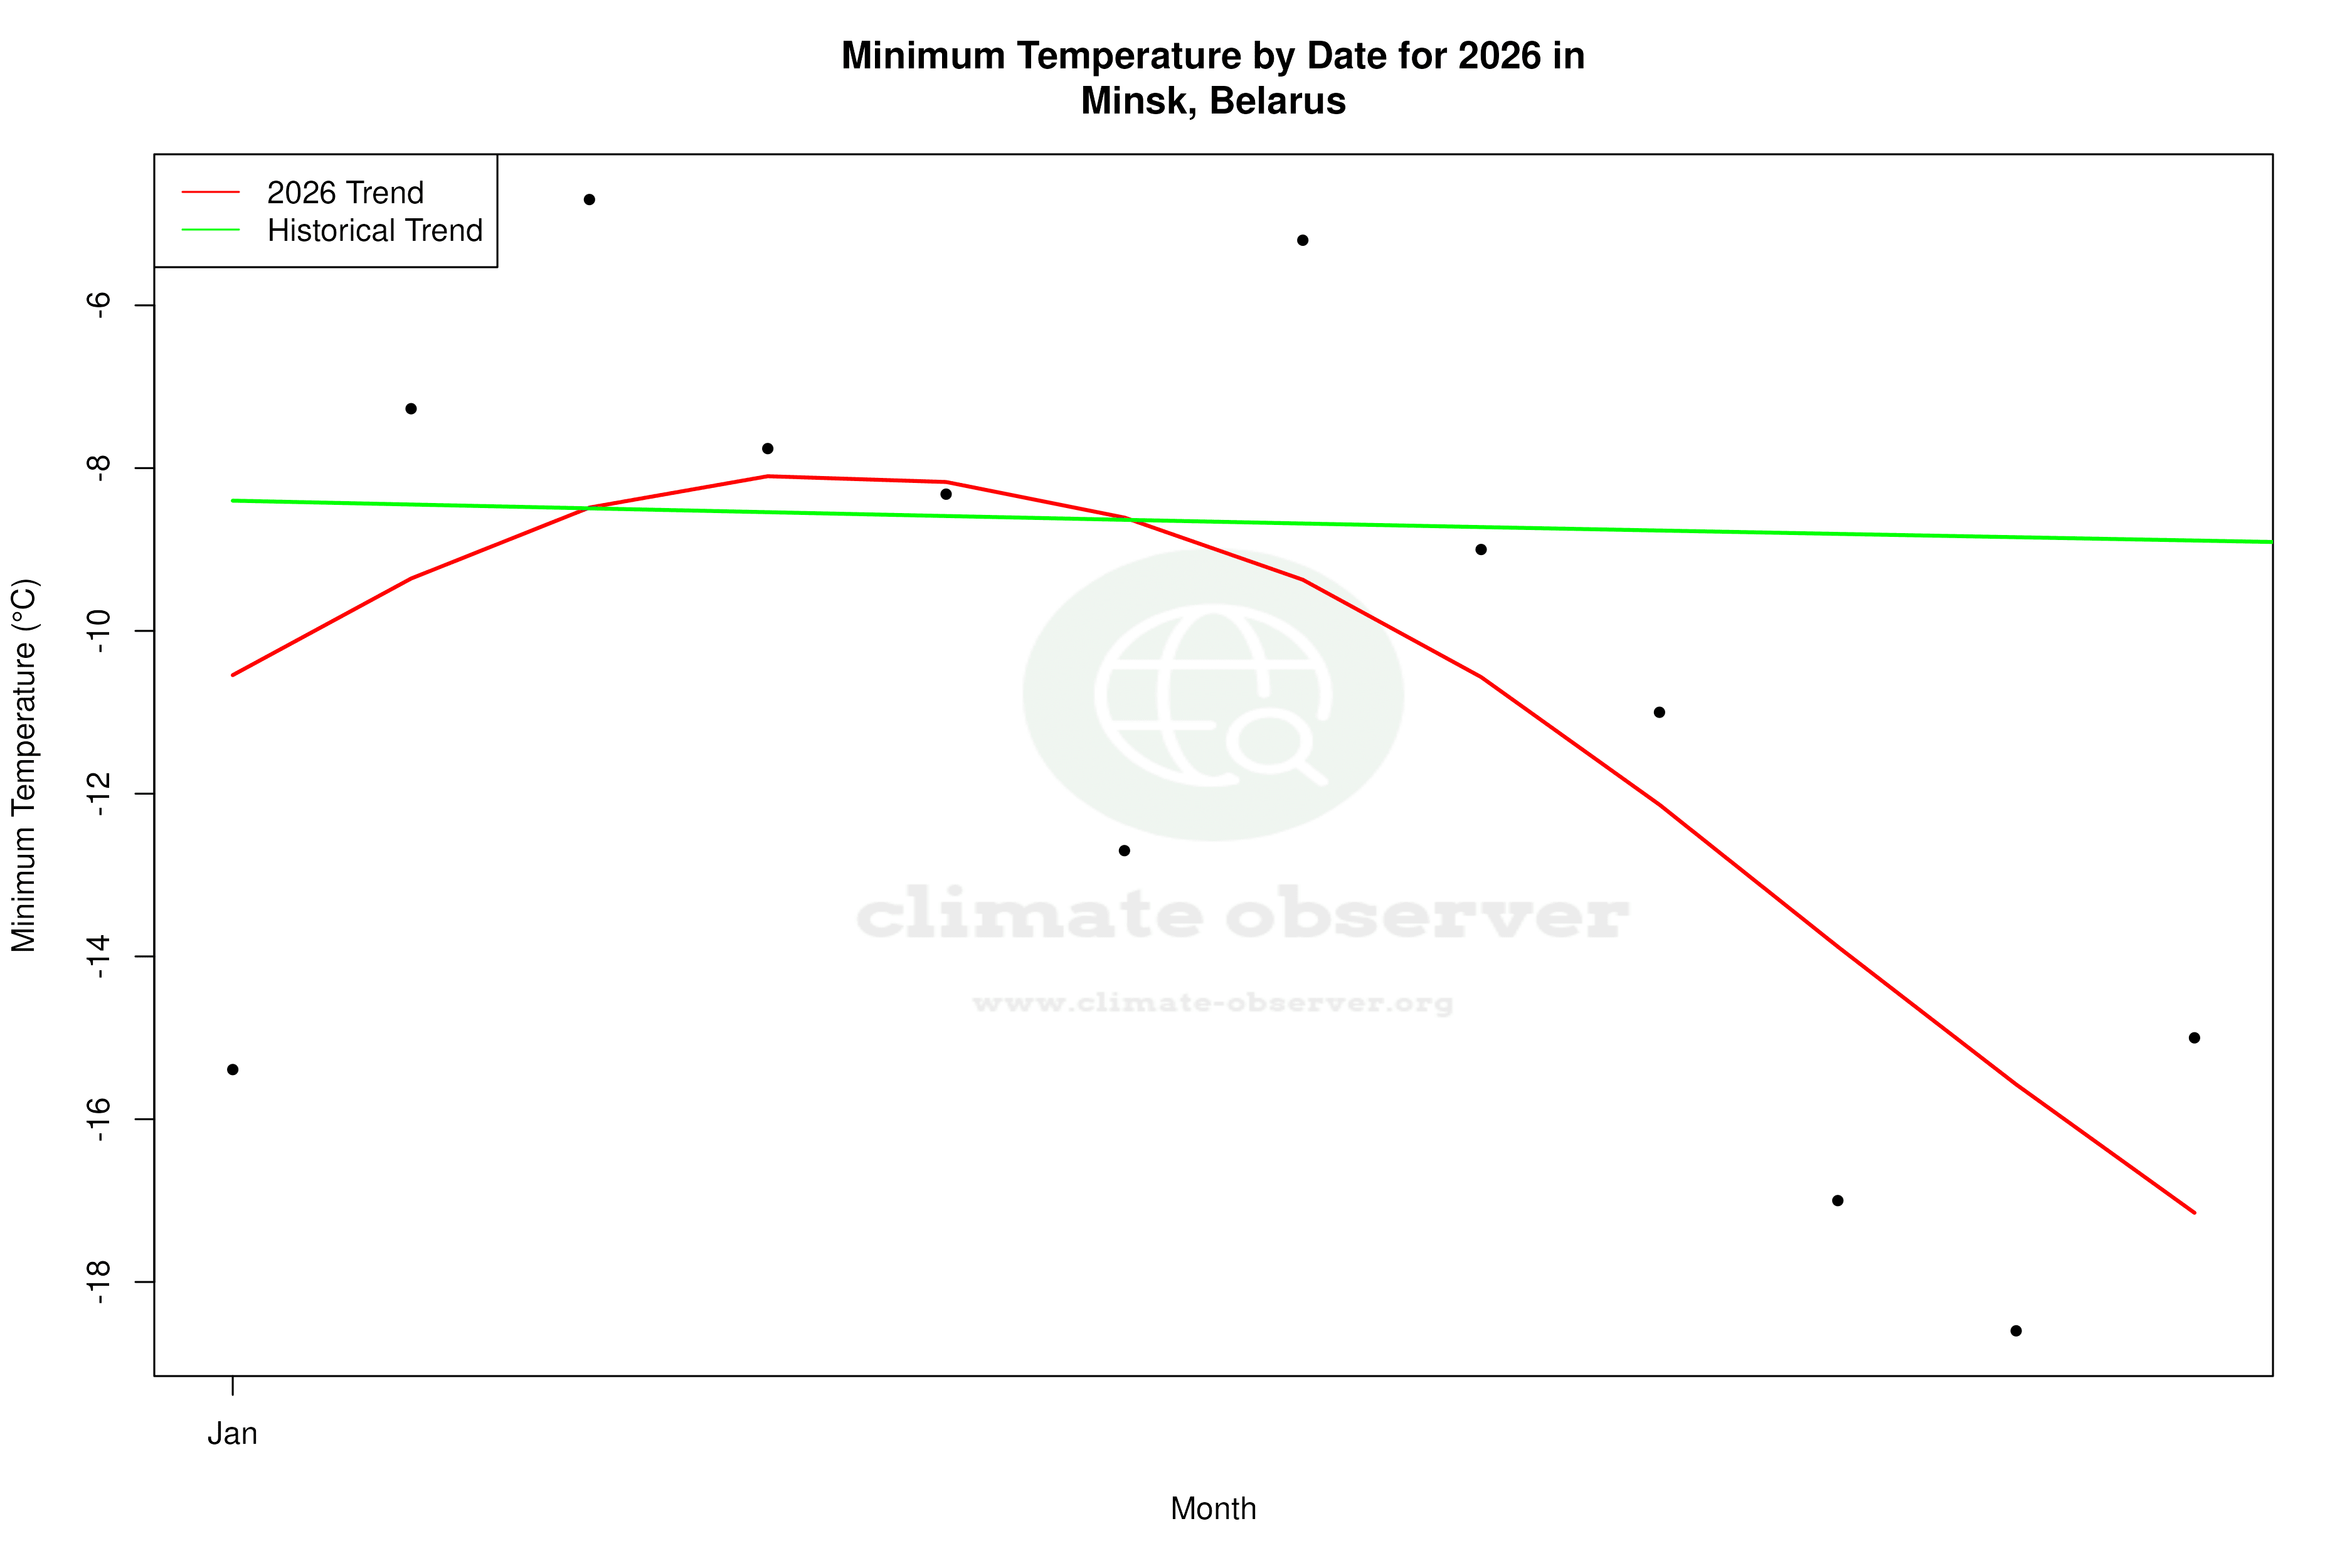
Minsk's climate is experiencing a nuanced shift with a slight warming trend in high temperatures and a marginal cooling in lows over the past decade. Precipitation patterns are becoming slightly more concentrated, indicating potential changes in rainfall distribution. These shifts occur against the backdrop of Belarus's climate goals, which aim to mitigate the impacts of climate change.
Continental Climate Dynamics
Minsk, located at 53.87°N, 27.53°E, is characterised by a humid continental climate, classified under the Köppen system as Dfb. This classification denotes cold, snowy winters and warm, humid summers. The city's geography, situated in the flat plains of Belarus, lacks significant geographical barriers such as mountains or large bodies of water, which means that weather patterns are largely influenced by continental air masses.
Temperature Trends: A Tale of Two Intervals
Over the past decade, Minsk has seen a warming trend in high temperatures, with an increase of 1.04°C (1.87°F). Conversely, low temperatures have experienced a cooling trend, decreasing by 0.50°C (0.90°F). This divergence in short-term trends contrasts with the all-time data, where both highs and lows have shown a warming trend of 0.26°C (0.47°F) and 0.22°C (0.40°F), respectively. The current maximum temperature record stands at 35.8°C (96.4°F), while the minimum is a frigid -39.1°C (-38.4°F).
Precipitation Patterns: A Subtle Shift
The Precipitation Concentration Index (PCI) for Minsk has shown a slight increase from a baseline of 11.67 to a current value of 12.07. This indicates a marginal shift towards more concentrated precipitation events, suggesting that rainfall may be occurring in fewer, more intense episodes. While this change is not drastic, it could have implications for local water management and agricultural practices.
Regional Climate Context
Belarus has been proactive in addressing climate change, with national goals aimed at reducing greenhouse gas emissions and enhancing resilience to climate impacts. The observed trends in Minsk's climate data align with broader regional patterns, where warming temperatures and changing precipitation dynamics are common themes. Recent weather events, such as heatwaves and heavy rainfall, highlight the importance of understanding these trends for future planning and adaptation strategies.
Implications for Future Climate Resilience
As Minsk continues to navigate the challenges posed by climate change, understanding the nuances of its local climate trends is crucial. The slight warming of high temperatures and the marginal increase in precipitation concentration suggest potential areas for adaptation, particularly in urban planning and infrastructure resilience. These insights are vital for informing policy and ensuring that Minsk remains prepared for the evolving climate landscape.
Station Statistics
10-Year Trend
High: +0.76 °C/decade
Low: -0.73 °C/decade
Rain: -1.00 mm/decade
25-Year Trend
High: +0.63 °C/decade
Low: +0.17 °C/decade
Rain: -0.04 mm/decade
50-Year Trend
High: +0.57 °C/decade
Low: +0.44 °C/decade
Rain: +0.04 mm/decade
All-Time Trend
High: +0.26 °C/decade
Low: +0.22 °C/decade
Rain: +0.02 mm/decade
Percentage Above-Average Days
Last 12 Months: 55.1%
This Year: 61.5%
Precipitation Concentration Index (PCI) ℹ️
Last 12 Months: 11.6
Historical Average: 11.4
Percentile Rank of Last 12 Months ℹ️
High: 87th percentile
Low: 72nd percentile
Rain: 15th percentile
Change in Variance ℹ️
High: -6.6%
Low: -20.4%
Intraday: +40.9%
Data Coverage
86.3%
First Year of Data
1891
Station Location
Historical Weather Records
| Max High | Avg High | Min High | Max Avg | Avg Avg | Min Avg | Max Low | Avg Low | Min Low | Max Precipitation | Avg Precipitation | Max Snow | Avg Snow | |
|---|---|---|---|---|---|---|---|---|---|---|---|---|---|
| Record | 35.8 °C | — | -32.4 °C | 28.6 °C | — | -34.9 °C | 22.0 °C | — | -39.1 °C | 73.5 mm | — | — | — |
| January | 10.3 °C | -3.6 °C | -32.4 °C | 8.3 °C | -6.2 °C | -34.9 °C | 5.2 °C | -9.1 °C | -39.1 °C | 24.9 mm | 1.3 mm | — | — |
| February | 13.6 °C | -2.5 °C | -26.4 °C | 8.5 °C | -5.5 °C | -29.8 °C | 6.5 °C | -8.6 °C | -35.1 °C | 23.5 mm | 1.2 mm | — | — |
| March | 24.0 °C | 2.7 °C | -15.8 °C | 14.9 °C | -1.2 °C | -20.8 °C | 9.0 °C | -4.8 °C | -30.5 °C | 53.0 mm | 1.3 mm | — | — |
| April | 28.0 °C | 10.9 °C | -5.4 °C | 22.9 °C | 6.1 °C | -10.4 °C | 13.9 °C | 1.6 °C | -18.4 °C | 32.8 mm | 1.4 mm | — | — |
| May | 30.9 °C | 18.1 °C | 2.6 °C | 26.5 °C | 12.9 °C | -0.7 °C | 18.0 °C | 7.4 °C | -5.0 °C | 61.8 mm | 2.0 mm | — | — |
| June | 35.8 °C | 21.7 °C | 5.2 °C | 27.4 °C | 16.6 °C | 2.3 °C | 20.7 °C | 11.1 °C | 0.0 °C | 72.5 mm | 2.6 mm | — | — |
| July | 35.0 °C | 23.2 °C | 12.7 °C | 27.9 °C | 18.2 °C | 9.1 °C | 22.0 °C | 13.0 °C | 3.8 °C | 73.5 mm | 2.9 mm | — | — |
| August | 35.8 °C | 22.3 °C | 10.0 °C | 28.6 °C | 17.0 °C | 6.8 °C | 21.5 °C | 12.0 °C | 1.7 °C | 61.4 mm | 2.4 mm | — | — |
| September | 31.0 °C | 16.9 °C | 2.8 °C | 24.0 °C | 12.0 °C | 1.1 °C | 16.5 °C | 7.7 °C | -4.7 °C | 43.0 mm | 1.9 mm | — | — |
| October | 24.7 °C | 9.8 °C | -6.4 °C | 18.2 °C | 6.1 °C | -8.9 °C | 14.2 °C | 2.9 °C | -12.9 °C | 36.9 mm | 1.6 mm | — | — |
| November | 16.0 °C | 3.0 °C | -11.8 °C | 12.3 °C | 0.7 °C | -15.8 °C | 11.3 °C | -1.4 °C | -20.4 °C | 43.3 mm | 1.6 mm | — | — |
| December | 11.1 °C | -1.4 °C | -24.0 °C | 8.3 °C | -3.6 °C | -27.9 °C | 7.0 °C | -6.0 °C | -30.6 °C | 41.0 mm | 1.4 mm | — | — |
Data Visualisations
Remove WatermarksCurrent Year Climate Trends vs Historical


Max Temperature this Year | 1 of 6
Climate 12-Month Moving Averages


Max Temperature 12-Month MA | 1 of 6
Daily Data Points and Averages Throughout the Year


Average Max Temperature Throughout Year | 1 of 5
