Climate for Station: Maceio (Aeroporto), Alagoas, Brazil
Loading live weather...
Climate Analysis & Overview
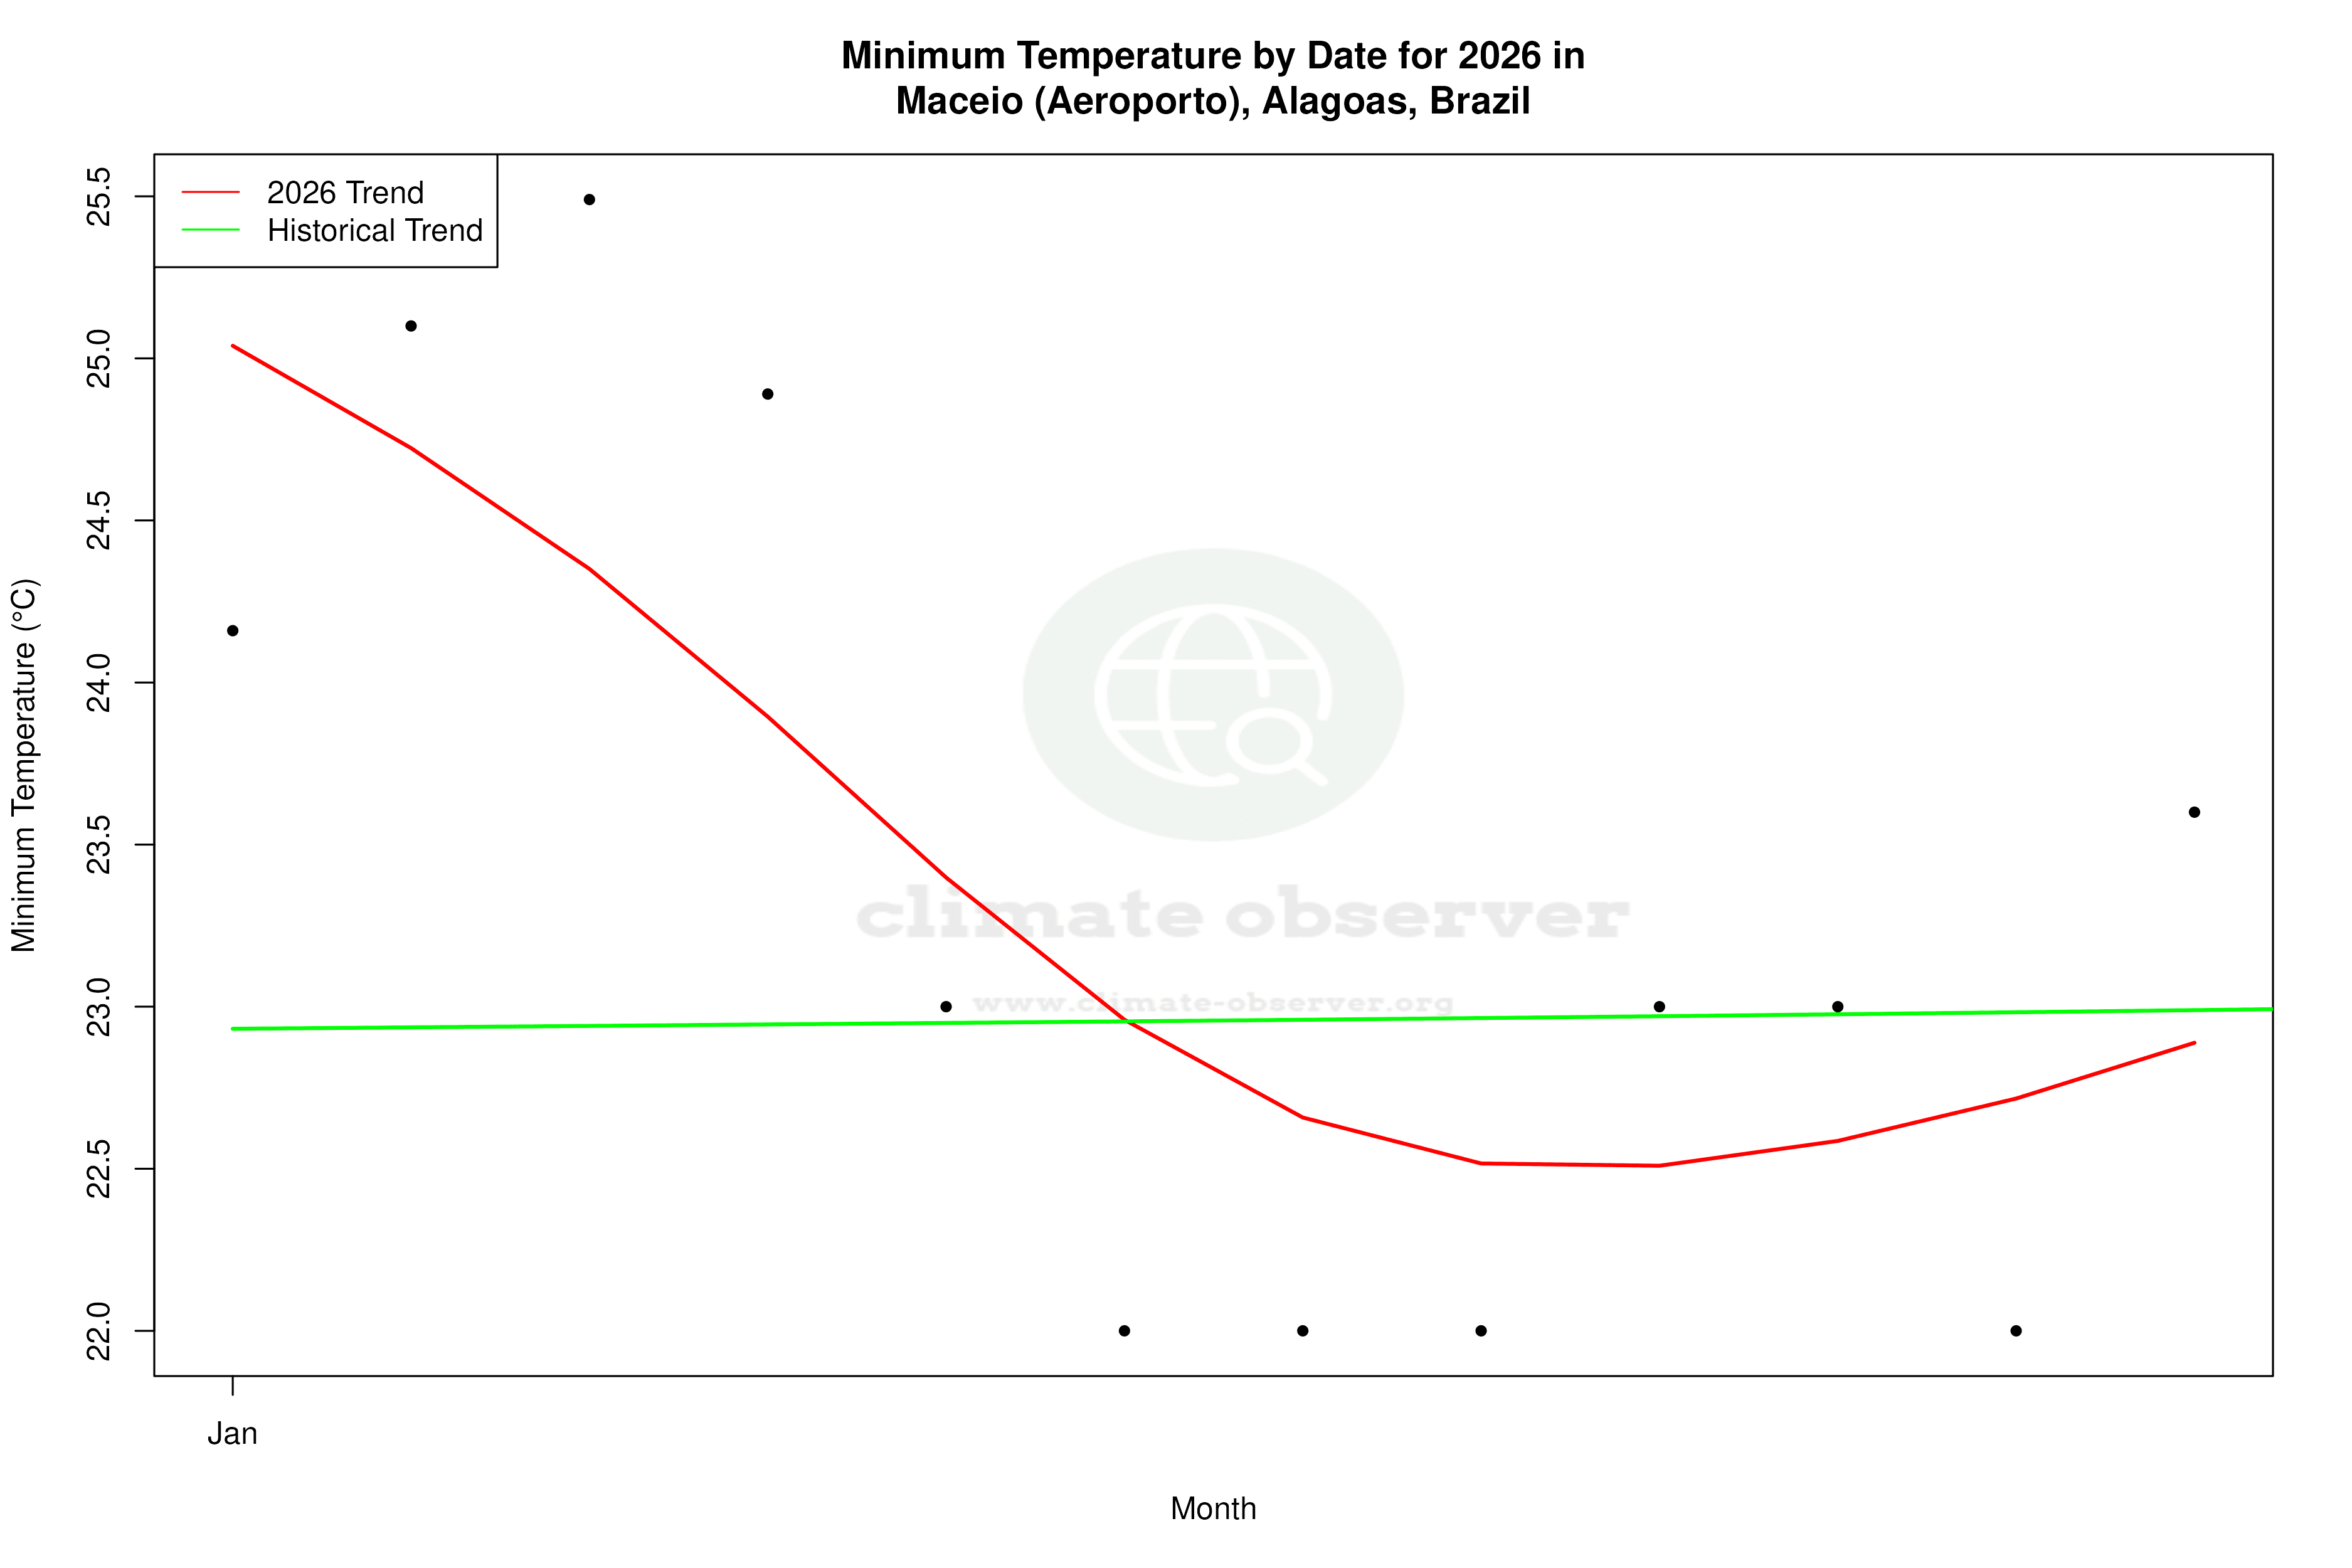
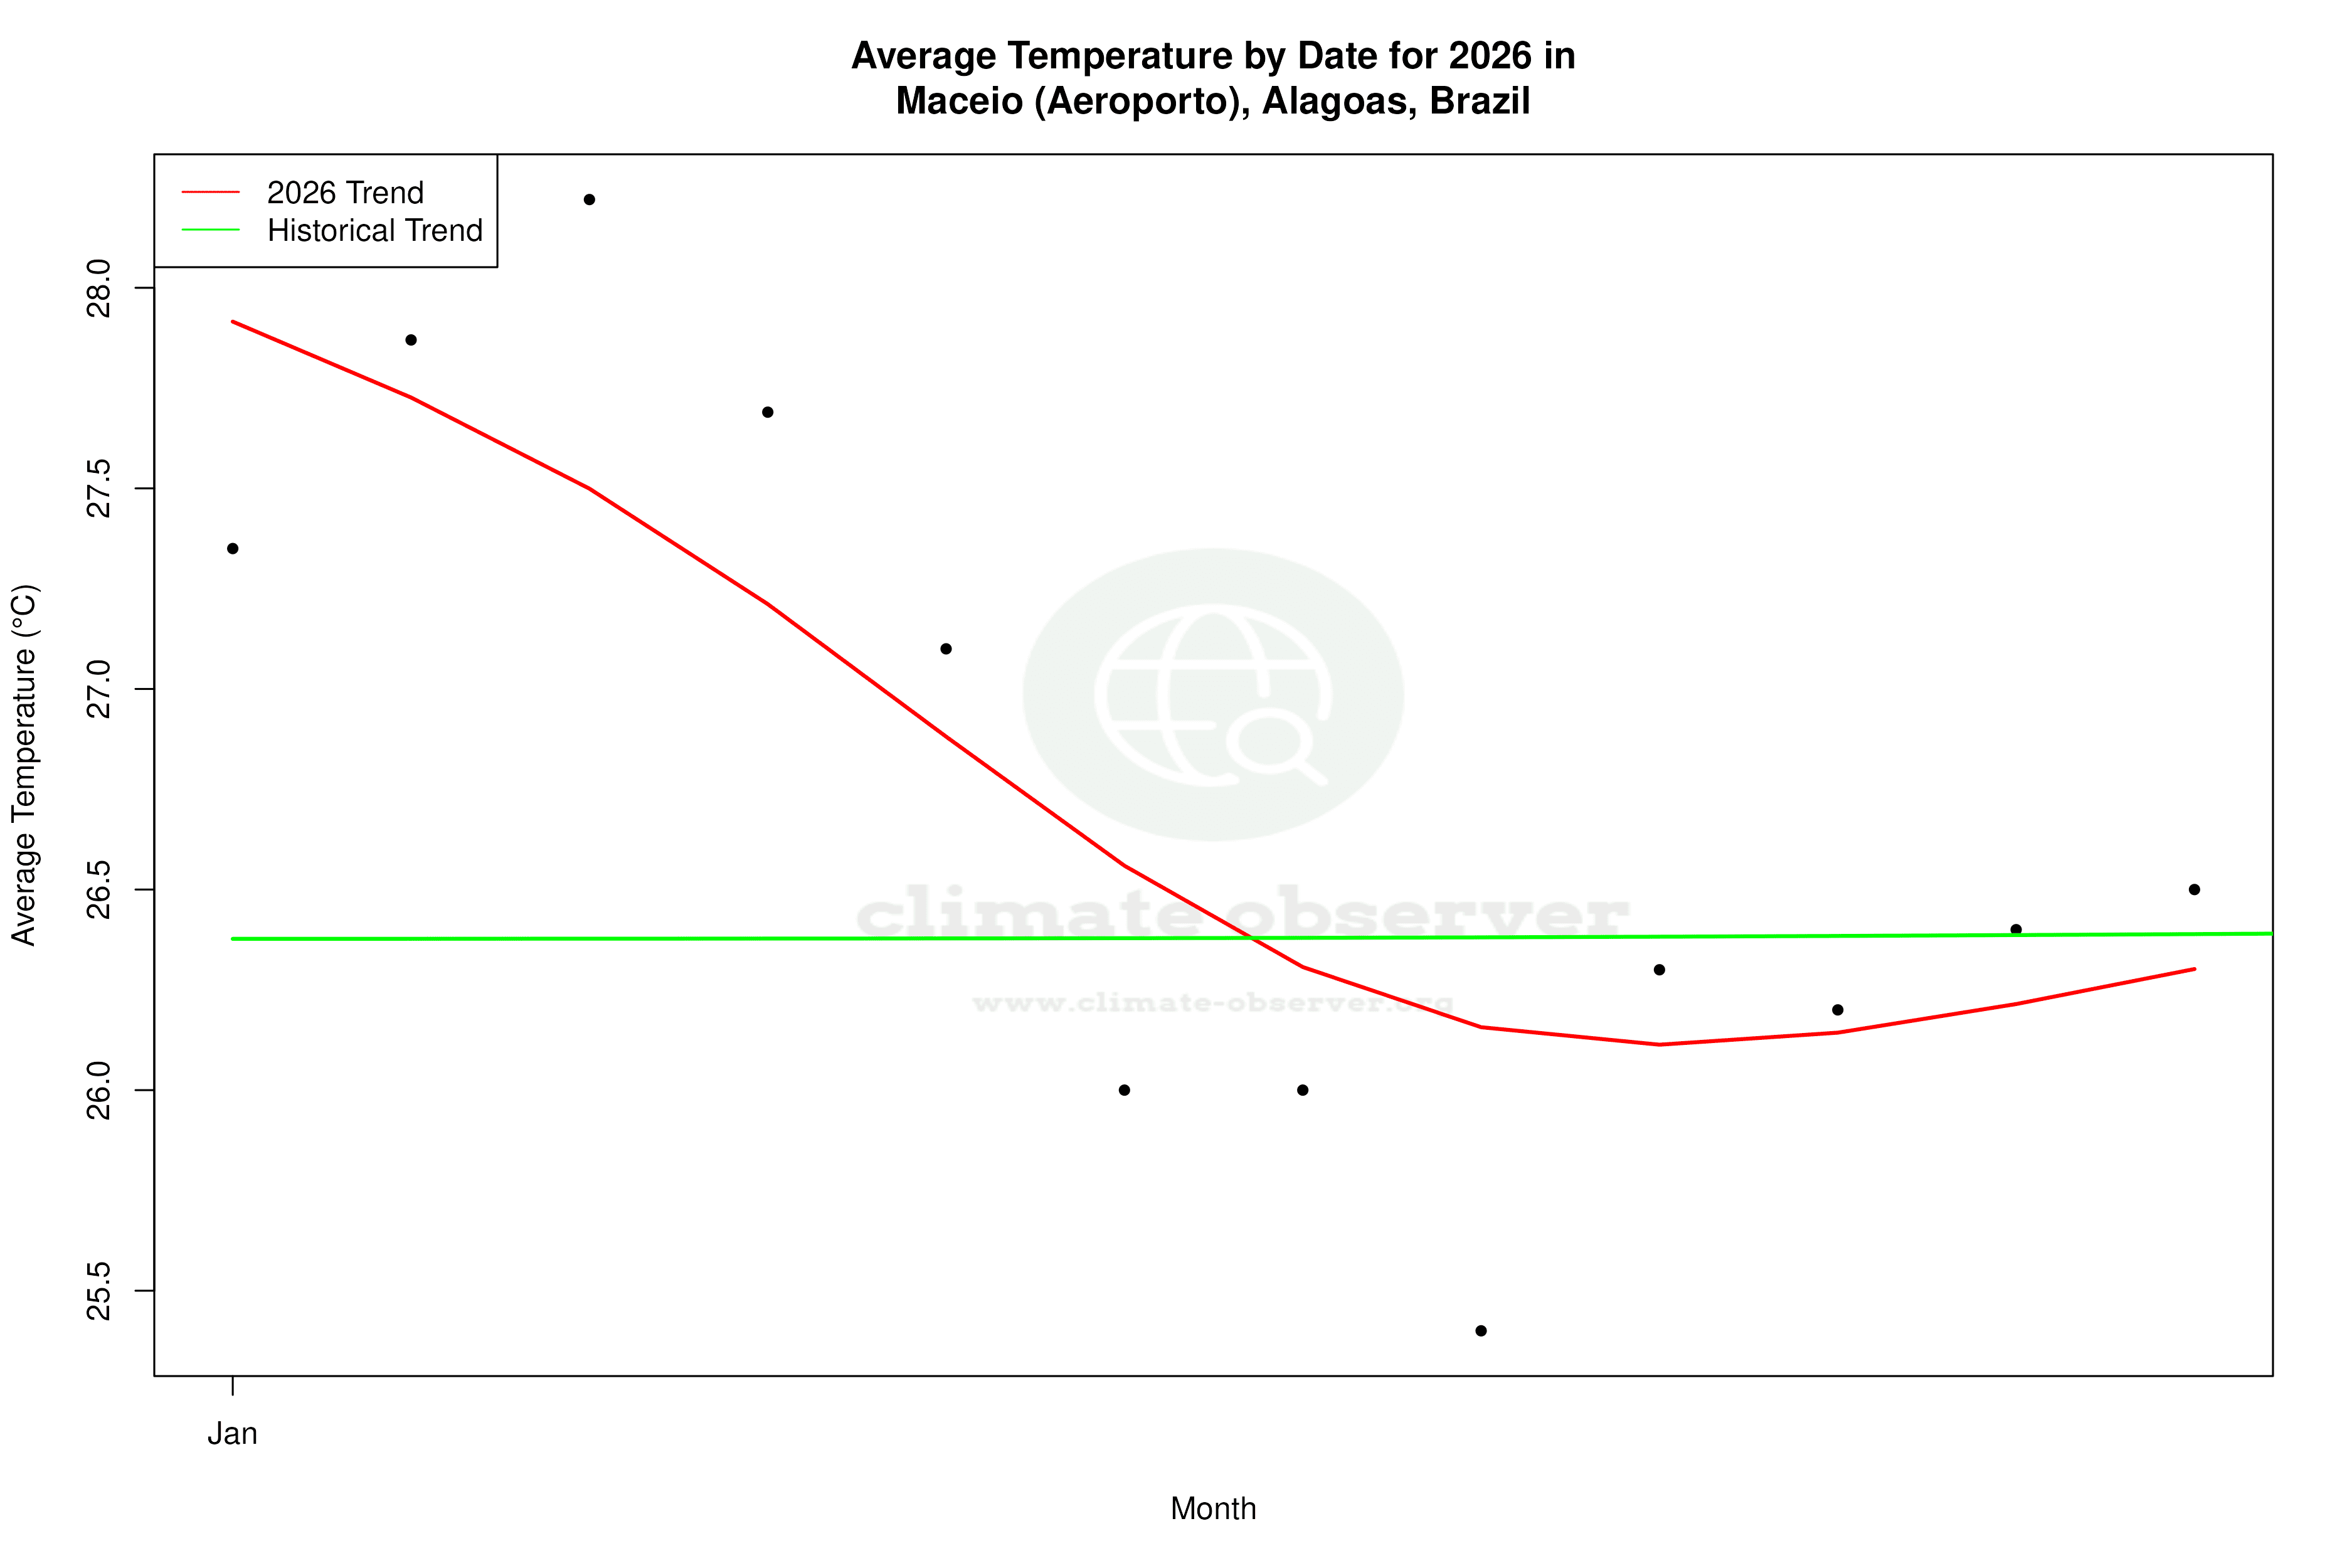
Maceio's climate is experiencing a nuanced interplay of warming and cooling trends, with a notable rise in recent high temperatures and a slight increase in precipitation concentration. While the long-term data suggest a subtle cooling, the last decade has seen a warming trend in both highs and lows, reflecting broader climate dynamics in Brazil's Nordeste region.
Tropical Climate Dynamics
Maceio, located in Brazil's Nordeste region, is characterised by a tropical climate, specifically classified under the Köppen system as Aw, denoting a tropical savanna climate with a distinct dry season. The city's coastal geography, situated near the Atlantic Ocean, plays a crucial role in moderating its climate, influencing both temperature and precipitation patterns. The proximity to the ocean often results in a humid environment with significant rainfall, although recent data indicates changes in these patterns.
Temperature Trends: A Decade of Change
Over the past decade, Maceio has experienced a noticeable warming trend. High temperatures have increased by 0.73°C (1.31°F), while low temperatures have risen by 0.50°C (0.90°F). This warming trend contrasts with the all-time data, which shows a slight cooling in low temperatures, with a fall of 0.25°C (0.45°F), and a marginal warming in high temperatures, with a rise of 0.17°C (0.31°F). These figures suggest that while the long-term trend indicates a slight cooling in lows, recent years have seen a reversal, aligning with global warming patterns.
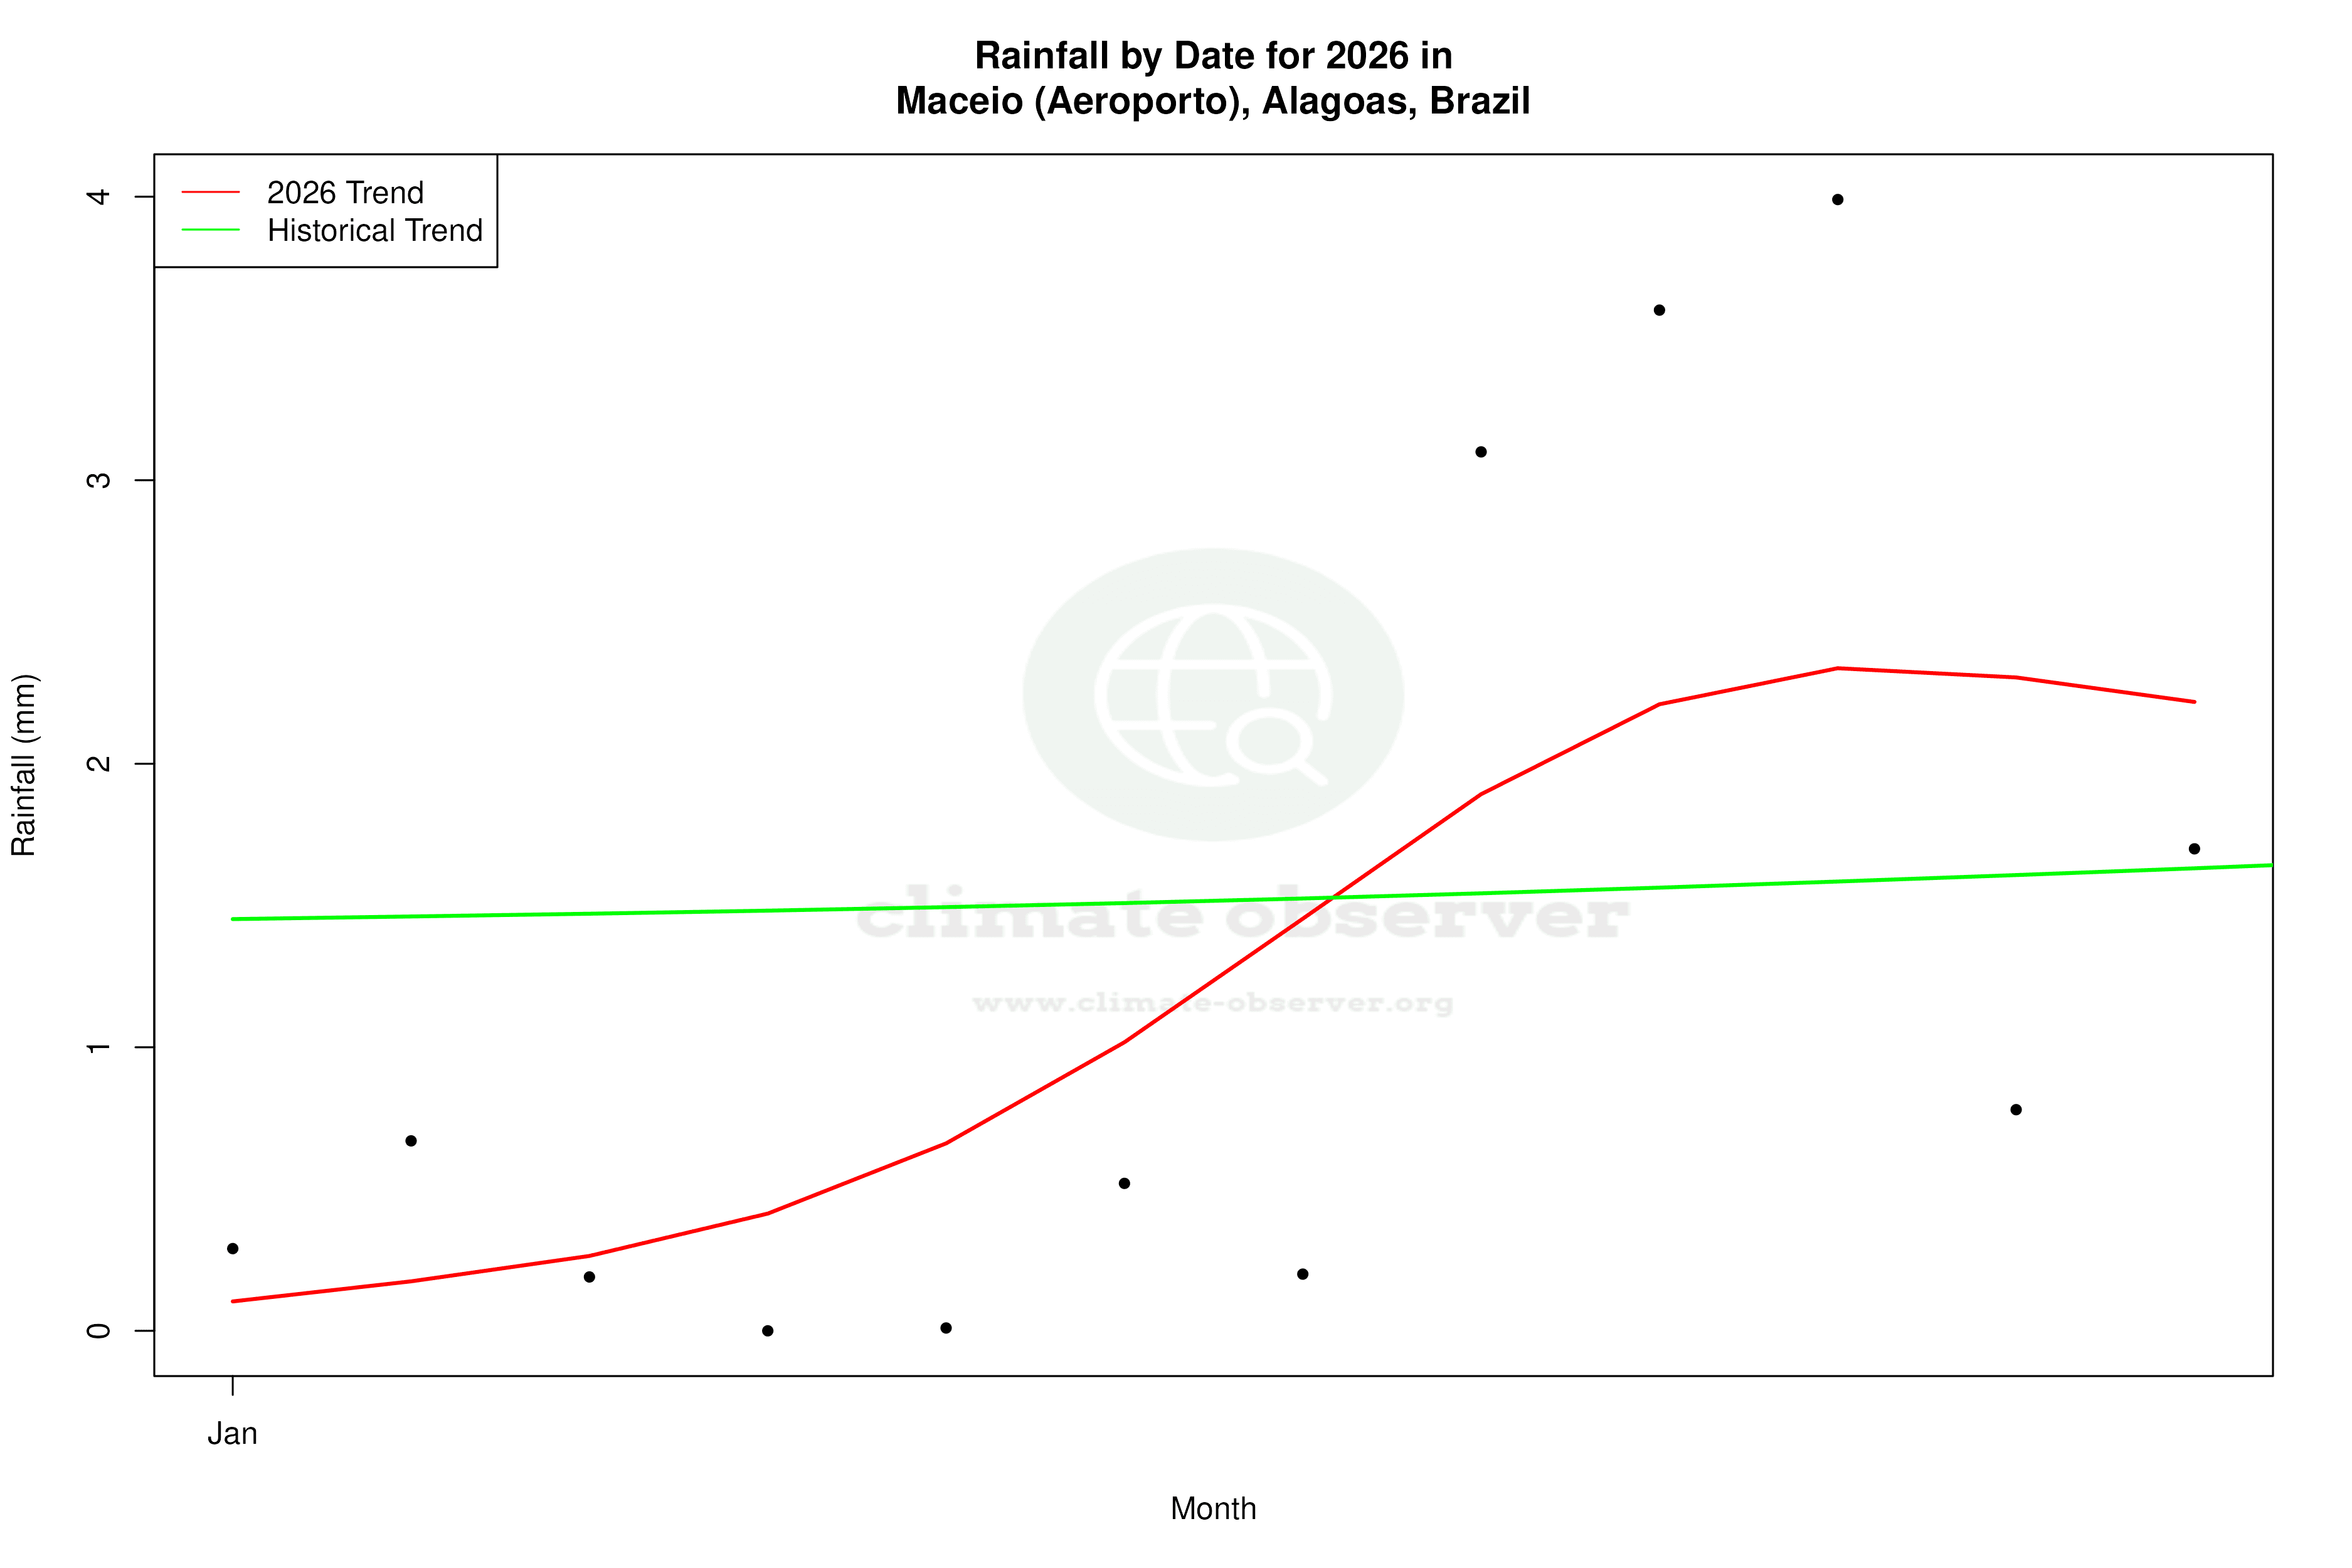
Precipitation Patterns: Concentration and Change
The Precipitation Concentration Index (PCI) for Maceio has shown a marginal increase from a baseline of 13.94 to a current value of 14.09. This suggests a slight increase in the concentration of rainfall events, meaning precipitation is becoming more concentrated in fewer, more intense events. While this change is not yet significant, it reflects a trend towards more extreme weather patterns, consistent with global climate change impacts.
Record Extremes: Temperature Benchmarks
Maceio's temperature records highlight the extremes of its climate. The highest recorded temperature is 37.6°C (99.7°F), while the lowest is 12.0°C (53.6°F). These records illustrate the range of temperatures the region can experience, although such extremes are relatively rare due to the moderating influence of the nearby ocean.
Regional Climate Goals and Implications
Brazil's regional climate goals focus on mitigating the impacts of climate change, particularly in vulnerable areas like the Nordeste. The observed warming trends in Maceio, especially over the past decade, underscore the importance of these goals. As Brazil continues to address climate challenges, understanding localised trends in places like Maceio is crucial for developing effective adaptation and mitigation strategies. The slight increase in precipitation concentration further emphasises the need for infrastructure that can handle more intense rainfall events, a key component of regional climate resilience efforts.
Station Statistics
10-Year Trend
High: +0.77 °C/decade
Low: +0.52 °C/decade
Rain: -0.29 mm/decade
25-Year Trend
High: -0.19 °C/decade
Low: -0.21 °C/decade
Rain: -0.50 mm/decade
50-Year Trend
High: +0.17 °C/decade
Low: -0.25 °C/decade
Rain: -0.22 mm/decade
All-Time Trend
High: +0.17 °C/decade
Low: -0.25 °C/decade
Rain: +0.02 mm/decade
Percentage Above-Average Days
Last 12 Months: 54.5%
This Year: 47.5%
Precipitation Concentration Index (PCI) ℹ️
Last 12 Months: 16.6
Historical Average: 15.4
Percentile Rank of Last 12 Months ℹ️
High: 77th percentile
Low: 42nd percentile
Rain: 15th percentile
Change in Variance ℹ️
High: -13.2%
Low: -18.2%
Intraday: -31.7%
Data Coverage
55.5%
First Year of Data
1923
Station Location
Historical Weather Records
| Max High | Avg High | Min High | Max Avg | Avg Avg | Min Avg | Max Low | Avg Low | Min Low | Max Precipitation | Avg Precipitation | Max Snow | Avg Snow | |
|---|---|---|---|---|---|---|---|---|---|---|---|---|---|
| Record | 38.0 °C | — | 22.0 °C | 31.3 °C | — | 18.8 °C | 27.1 °C | — | 14.6 °C | 247.0 mm | — | — | — |
| January | 38.0 °C | 31.0 °C | 24.1 °C | 31.0 °C | 26.4 °C | 21.0 °C | 27.0 °C | 23.0 °C | 18.0 °C | 83.8 mm | 1.8 mm | — | — |
| February | 37.0 °C | 31.1 °C | 26.0 °C | 31.3 °C | 26.5 °C | 21.8 °C | 26.6 °C | 23.3 °C | 18.9 °C | 105.0 mm | 2.0 mm | — | — |
| March | 37.0 °C | 31.1 °C | 26.0 °C | 30.2 °C | 26.6 °C | 22.4 °C | 26.7 °C | 23.5 °C | 19.0 °C | 98.3 mm | 3.4 mm | — | — |
| April | 36.0 °C | 30.3 °C | 25.2 °C | 29.1 °C | 26.1 °C | 22.8 °C | 27.1 °C | 23.2 °C | 20.0 °C | 125.0 mm | 5.7 mm | — | — |
| May | 35.0 °C | 29.1 °C | 23.0 °C | 28.4 °C | 25.0 °C | 21.7 °C | 25.9 °C | 22.4 °C | 18.0 °C | 247.0 mm | 8.2 mm | — | — |
| June | 34.0 °C | 27.8 °C | 23.8 °C | 27.2 °C | 24.0 °C | 20.1 °C | 24.8 °C | 21.5 °C | 16.6 °C | 166.1 mm | 7.4 mm | — | — |
| July | 32.1 °C | 27.1 °C | 22.0 °C | 26.8 °C | 23.3 °C | 19.1 °C | 24.0 °C | 20.7 °C | 15.7 °C | 120.9 mm | 6.4 mm | — | — |
| August | 32.2 °C | 27.3 °C | 23.0 °C | 26.4 °C | 23.3 °C | 18.8 °C | 23.9 °C | 20.3 °C | 14.6 °C | 115.0 mm | 4.0 mm | — | — |
| September | 34.0 °C | 28.2 °C | 24.9 °C | 27.6 °C | 24.0 °C | 20.0 °C | 25.0 °C | 20.7 °C | 16.0 °C | 128.4 mm | 2.6 mm | — | — |
| October | 35.0 °C | 29.5 °C | 24.0 °C | 28.7 °C | 24.9 °C | 20.6 °C | 24.8 °C | 21.4 °C | 16.0 °C | 199.9 mm | 1.5 mm | — | — |
| November | 37.0 °C | 30.6 °C | 26.0 °C | 29.8 °C | 25.7 °C | 20.9 °C | 25.5 °C | 22.2 °C | 18.8 °C | 52.0 mm | 0.9 mm | — | — |
| December | 36.4 °C | 31.0 °C | 25.6 °C | 30.4 °C | 26.2 °C | 22.6 °C | 25.9 °C | 22.7 °C | 19.0 °C | 68.7 mm | 1.1 mm | — | — |
Data Visualisations
Remove WatermarksCurrent Year Climate Trends vs Historical
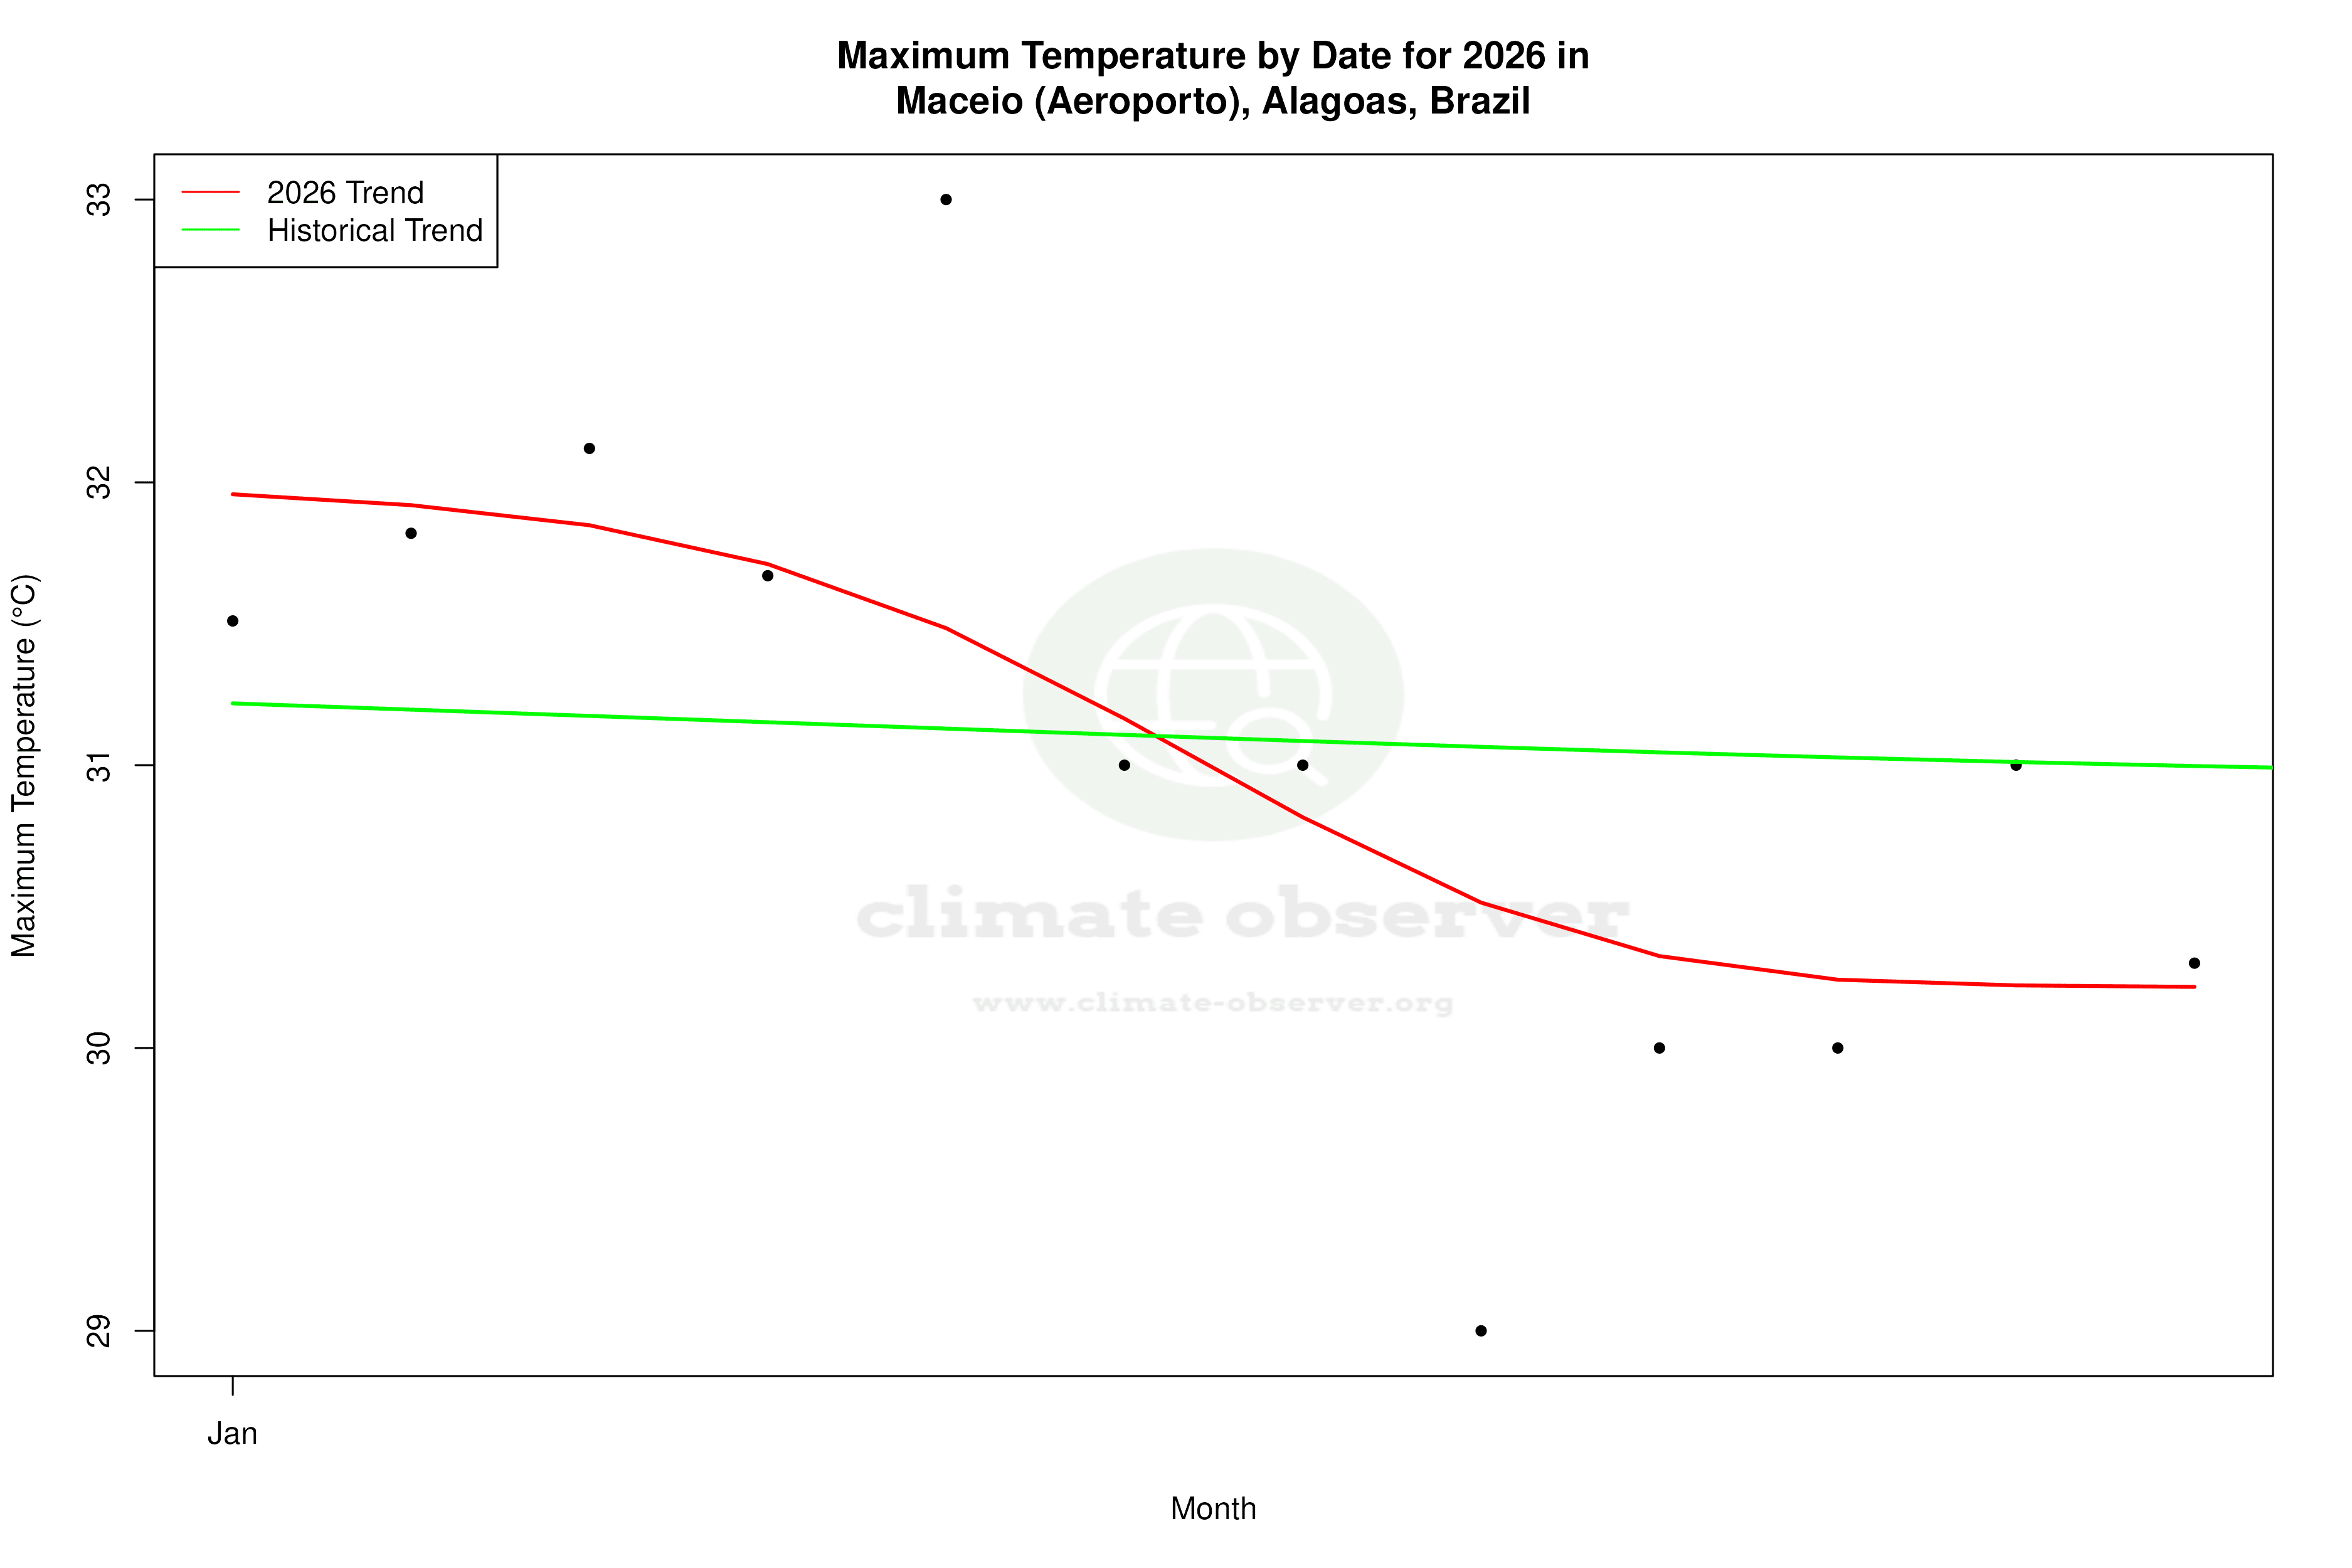


Max Temperature this Year | 1 of 6
Climate 12-Month Moving Averages


Max Temperature 12-Month MA | 1 of 6
Daily Data Points and Averages Throughout the Year
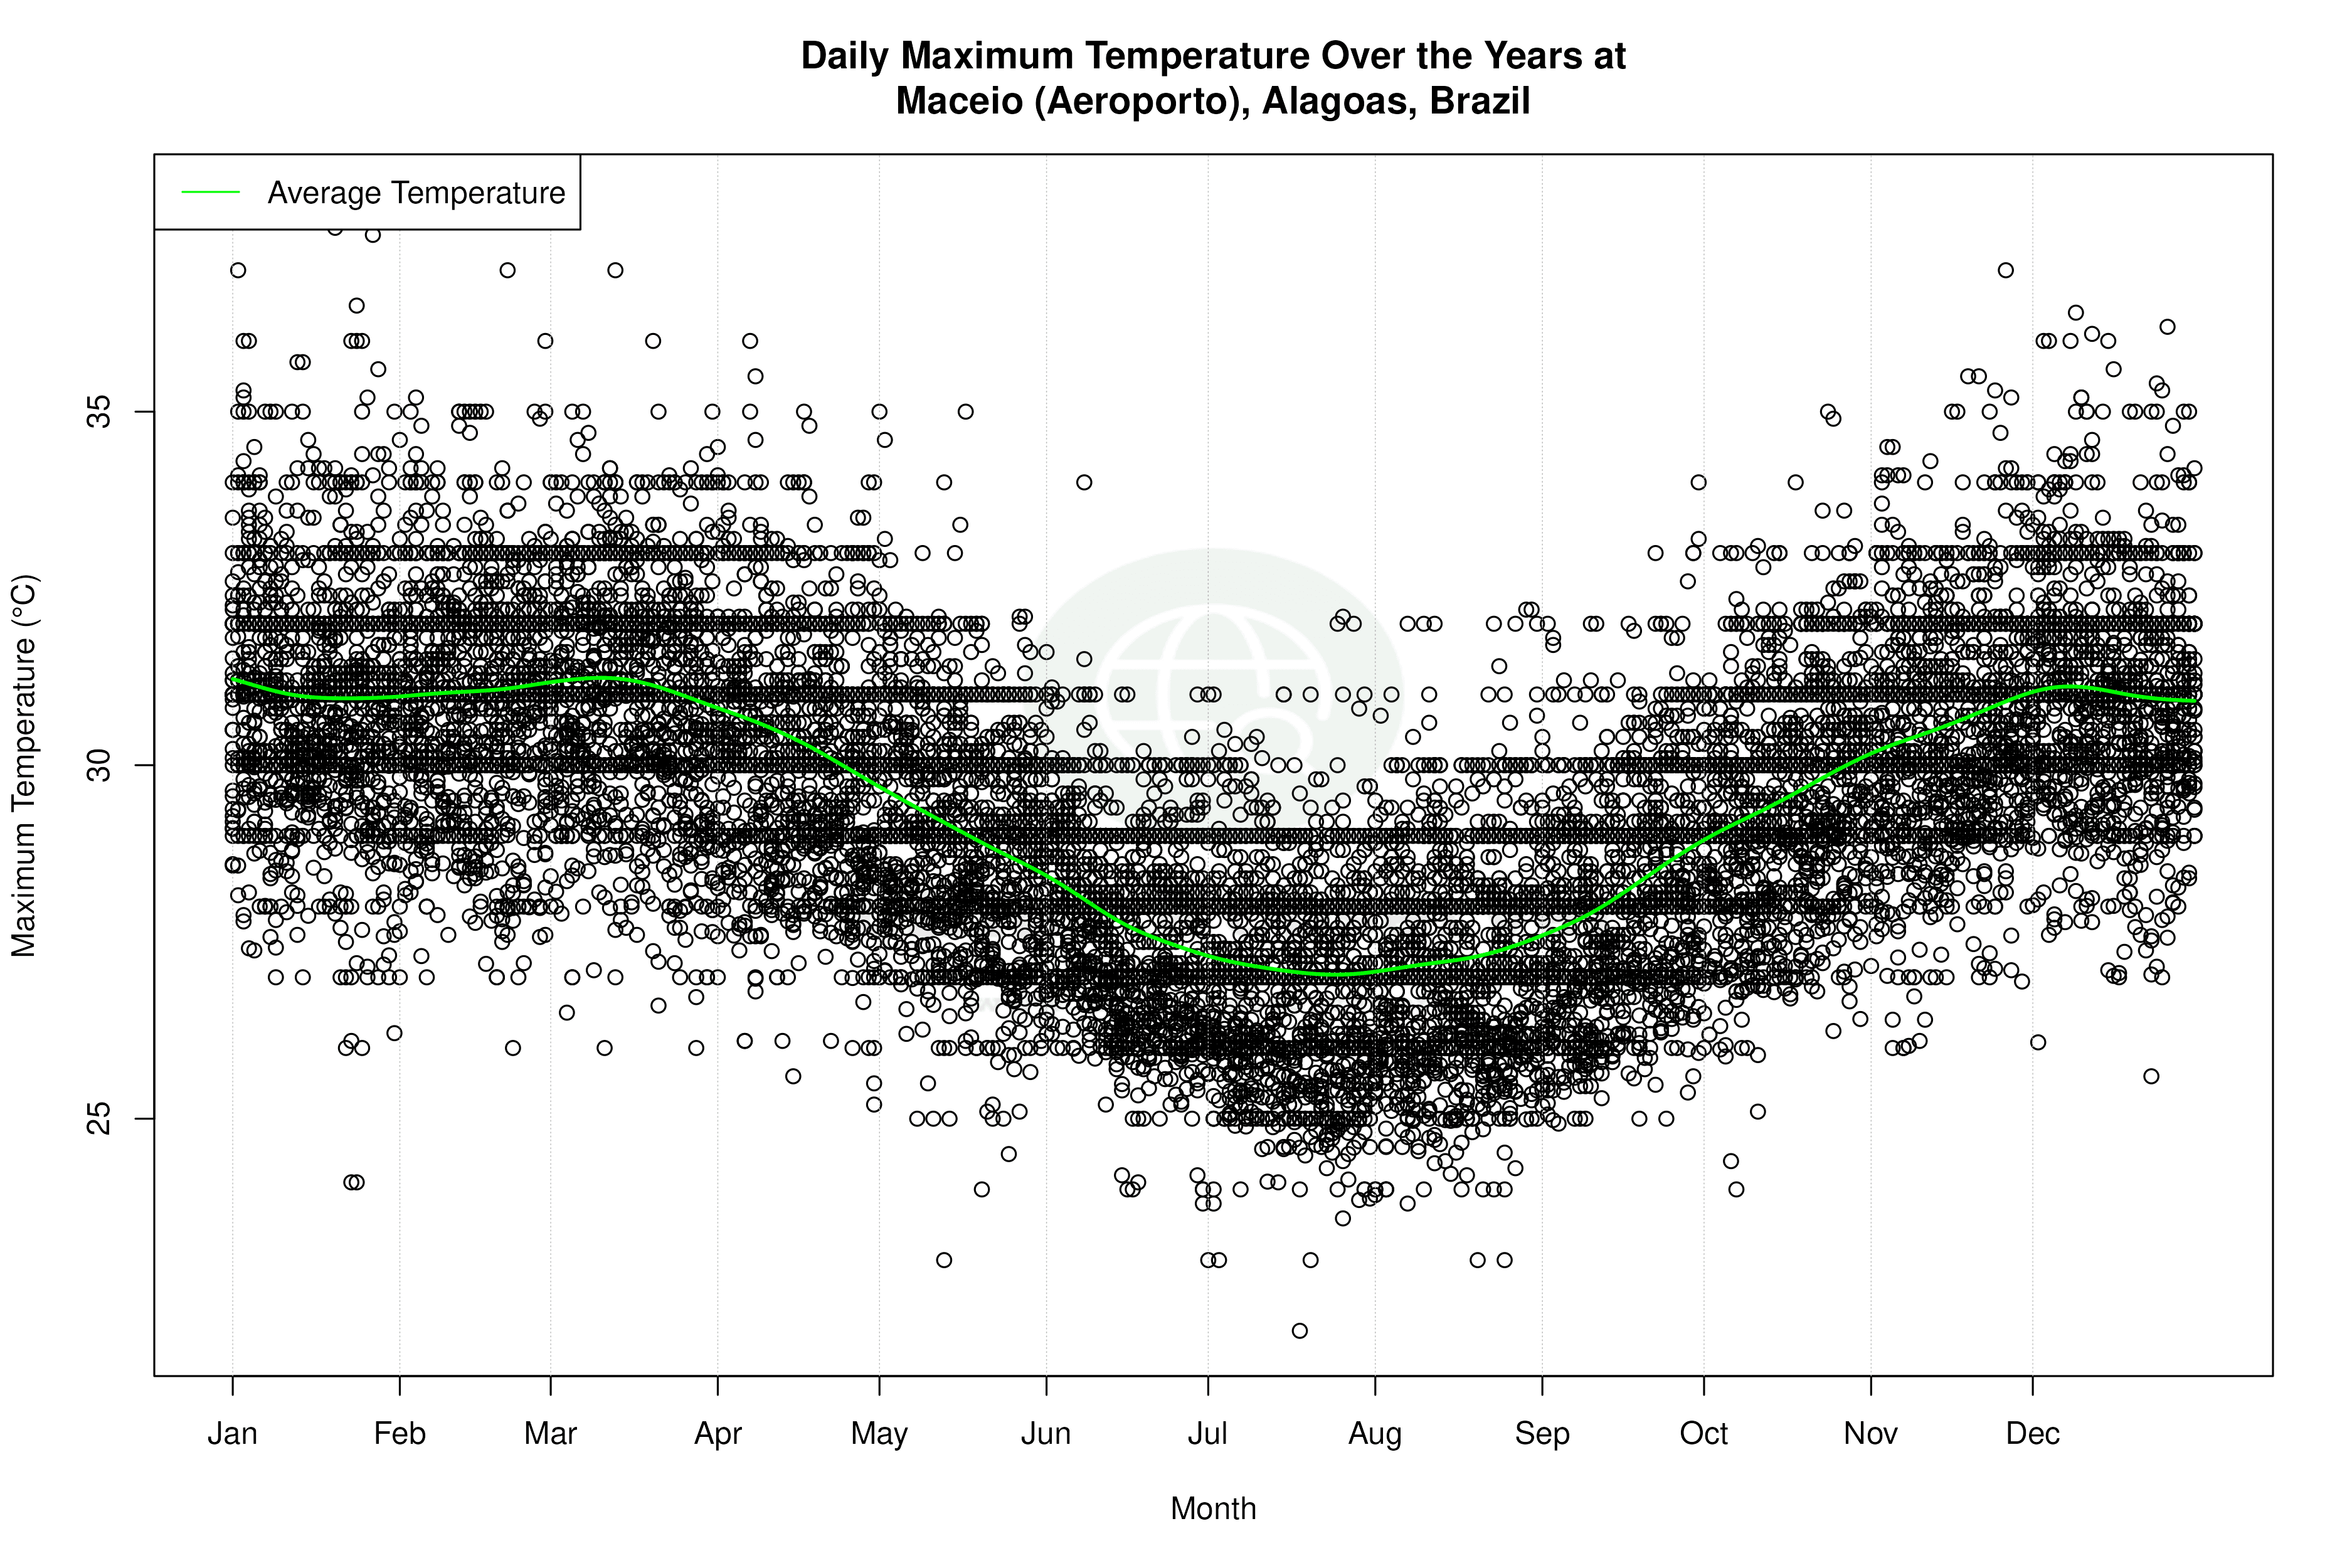

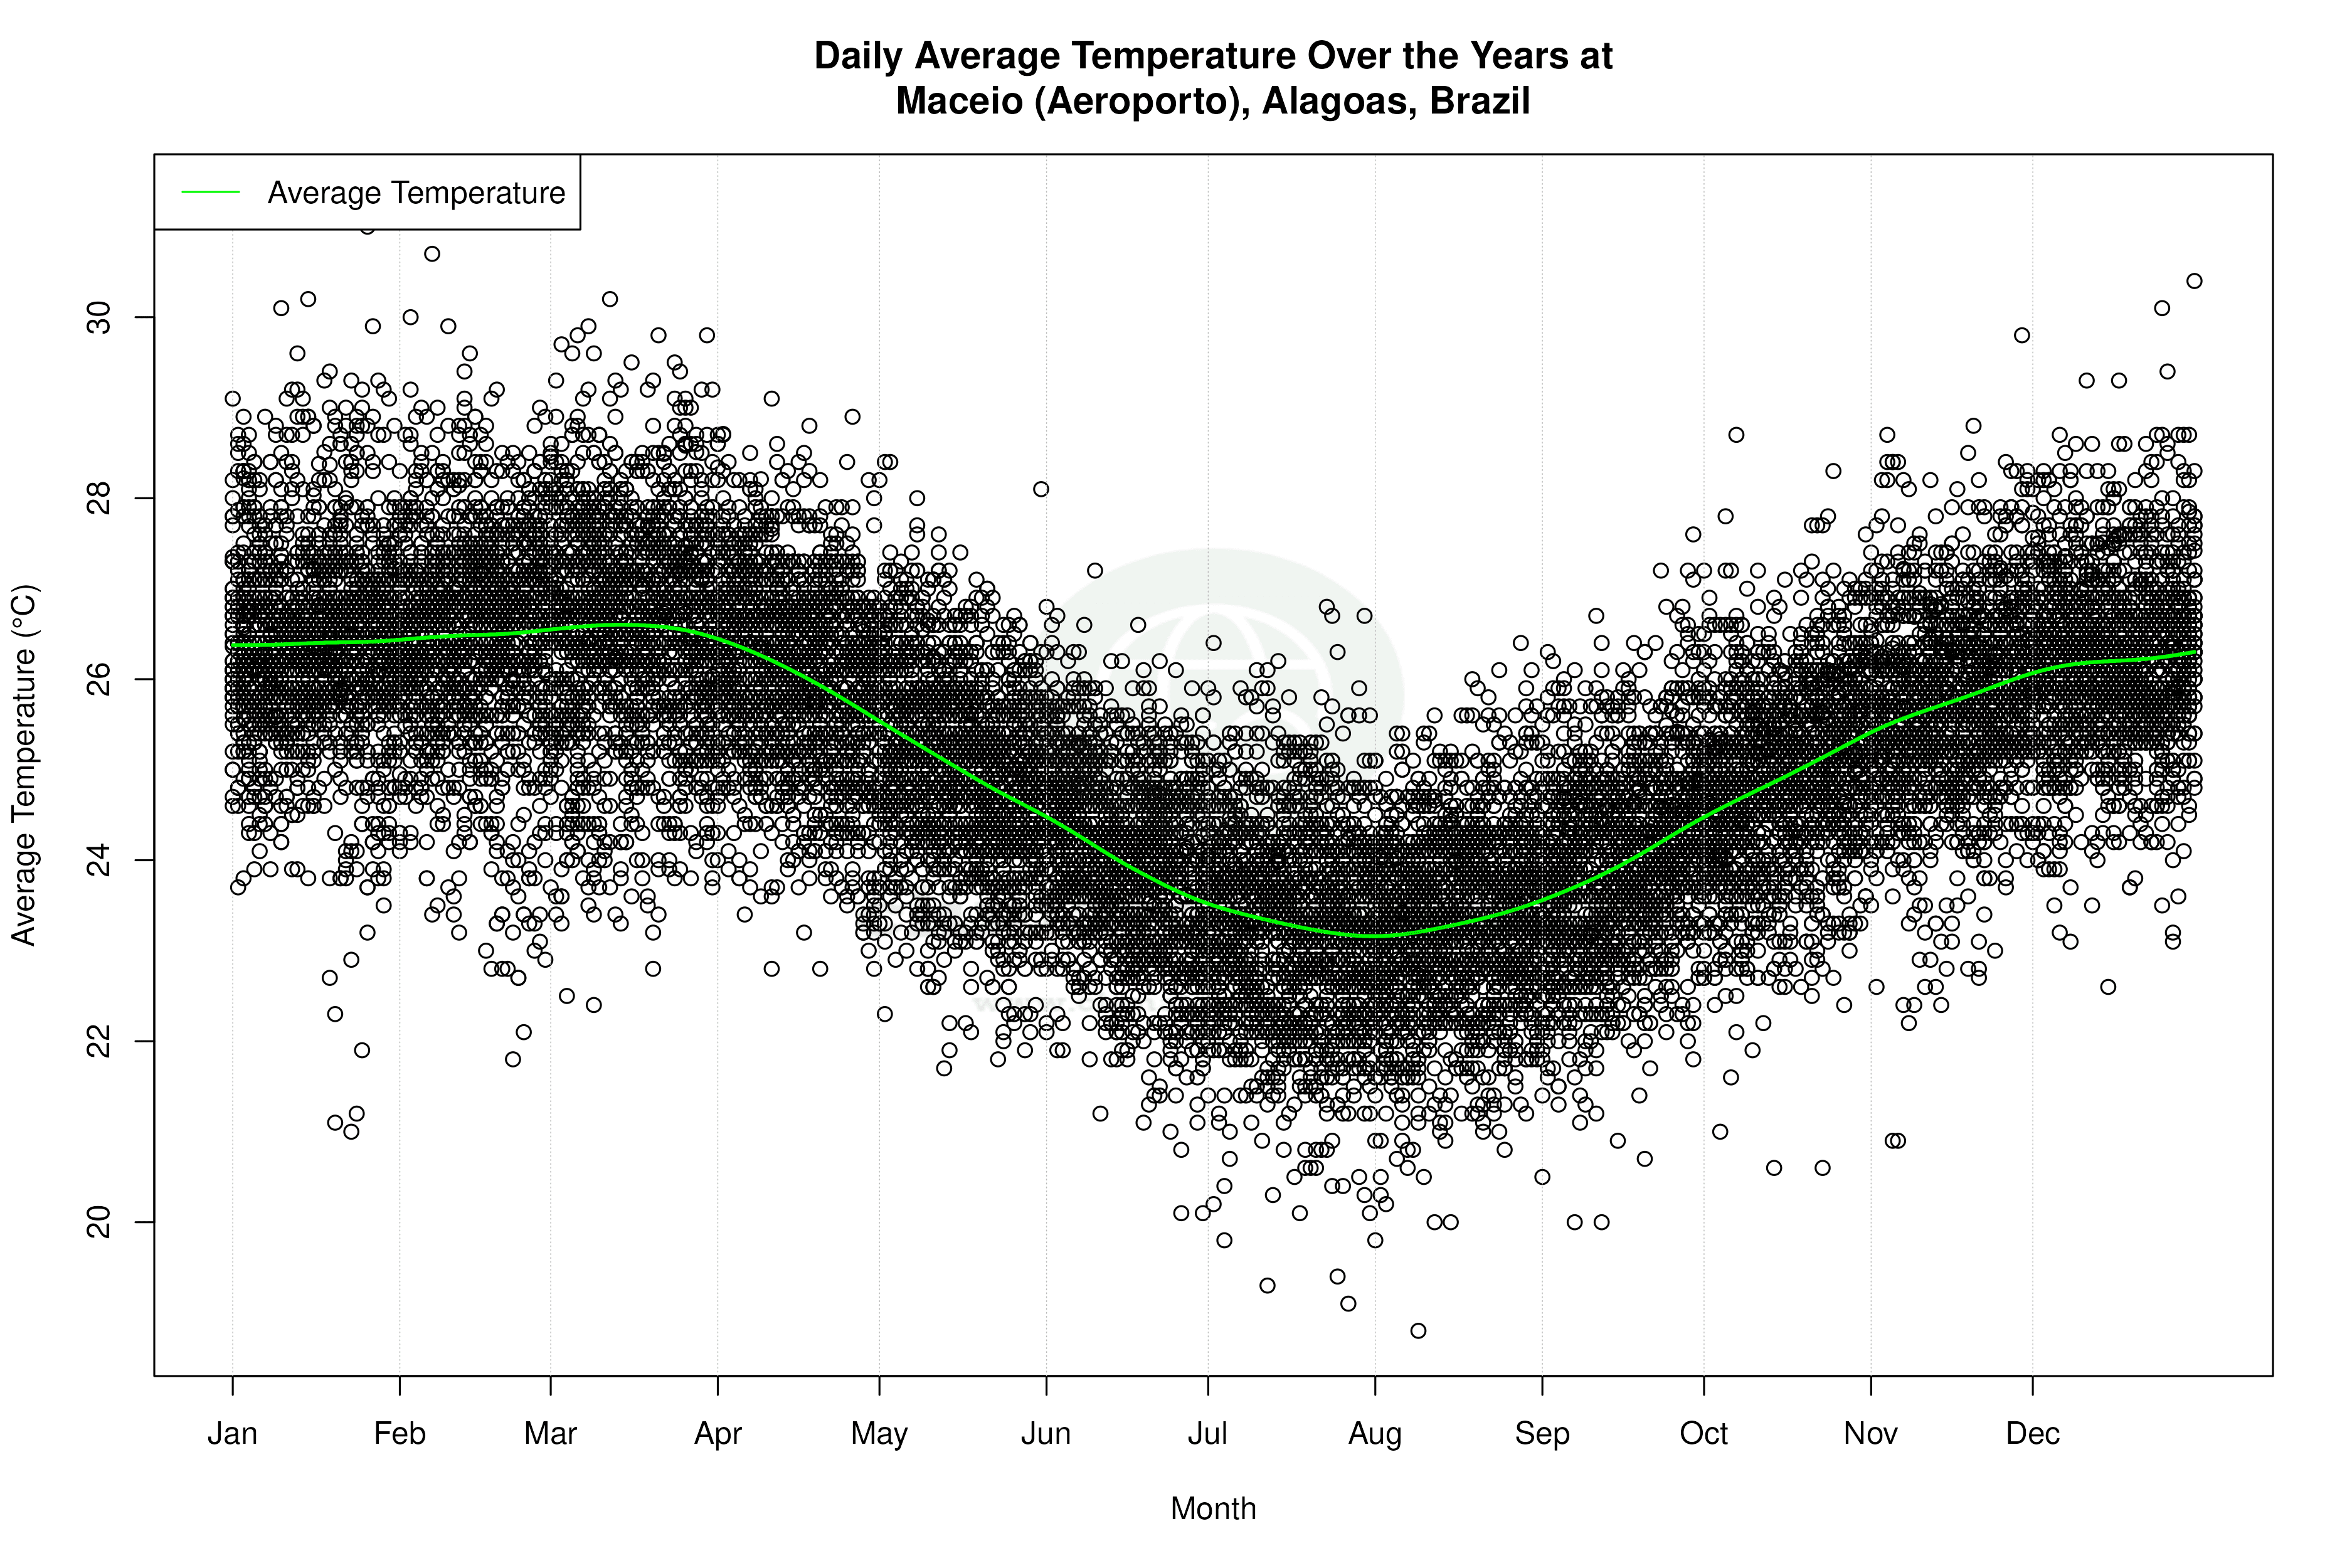


Average Max Temperature Throughout Year | 1 of 5
