Climate for Station: Macapa, Amapa, Brazil
Loading live weather...
Climate Analysis & Overview
Macapá, located near the equator in Brazil, is experiencing a warming trend with both highs and lows increasing over the past decade and all-time records. The precipitation pattern has become slightly more evenly distributed, reflecting a subtle shift in local climate dynamics.
Equatorial Climate Dynamics
Macapá, situated at the edge of the Amazon rainforest and the Atlantic Ocean, falls under the Köppen climate classification of Af, indicating a tropical rainforest climate. This geographic positioning subjects the city to high humidity and substantial rainfall throughout the year. The all-time temperature trends reveal a warming pattern, with highs rising by 0.23°C (0.41°F) and lows by 0.22°C (0.39°F). This warming is consistent with broader regional trends observed in the Amazon basin, where deforestation and climate change are significant influences.
Decadal Temperature Shifts
Over the last decade, Macapá has experienced a more pronounced warming in daily high temperatures, increasing by 0.40°C (0.72°F), while lows have seen a modest rise of 0.08°C (0.14°F). This suggests a more rapid increase in daytime temperatures, potentially impacting local ecosystems and human activities. The disparity between the 10-year and all-time trends underscores the importance of short-term climate variability, which can differ from long-term trends.
Precipitation Patterns and PCI
The Precipitation Concentration Index (PCI) for Macapá has decreased from a baseline of 12.6 to a current value of 11.9, indicating a marginal shift towards more evenly distributed rainfall events. The PCI measures how precipitation is spread over time, with lower values suggesting less concentration in a few heavy events. This subtle change may reflect adjustments in atmospheric circulation patterns, possibly influenced by regional climate initiatives aimed at mitigating extreme weather impacts.
Record Temperature Extremes
Macapá's record temperatures highlight the city's climatic extremes, with a maximum recorded temperature of 38.7°C (101.7°F) and a minimum of 19.57°C (67.2°F). These records provide context for the ongoing warming trends, serving as benchmarks for future climate assessments. The high temperatures are particularly significant given the city's proximity to the equator, where solar intensity is consistently high throughout the year.
Regional Climate Implications
The observed climatic changes in Macapá align with Brazil's broader climate goals, which focus on reducing greenhouse gas emissions and enhancing resilience to climate change. As the city continues to warm, local adaptation strategies will become increasingly important to manage the impacts on agriculture, water resources, and urban infrastructure. Recent weather events, such as intense rainfalls and heatwaves, highlight the urgency of these efforts in the face of evolving climate dynamics.
Station Statistics
10-Year Trend
High: +0.58 °C/decade
Low: +0.23 °C/decade
Rain: -0.69 mm/decade
25-Year Trend
High: +0.12 °C/decade
Low: +0.36 °C/decade
Rain: -0.51 mm/decade
50-Year Trend
High: +0.26 °C/decade
Low: +0.24 °C/decade
Rain: -0.43 mm/decade
All-Time Trend
High: +0.26 °C/decade
Low: +0.24 °C/decade
Rain: -0.43 mm/decade
Percentage Above-Average Days
Last 12 Months: 41.9%
This Year: 59.1%
Precipitation Concentration Index (PCI) ℹ️
Last 12 Months: 14.6
Historical Average: 11.8
Percentile Rank of Last 12 Months ℹ️
High: 76th percentile
Low: 89th percentile
Rain: 21st percentile
Change in Variance ℹ️
High: +43.2%
Low: +1.8%
Intraday: +26.5%
Data Coverage
95.4%
First Year of Data
1973
Station Location
Historical Weather Records
| Max High | Avg High | Min High | Max Avg | Avg Avg | Min Avg | Max Low | Avg Low | Min Low | Max Precipitation | Avg Precipitation | Max Snow | Avg Snow | |
|---|---|---|---|---|---|---|---|---|---|---|---|---|---|
| Record | 38.7 °C | — | 24.2 °C | 33.5 °C | — | 20.8 °C | 27.7 °C | — | 19.6 °C | 405.9 mm | — | — | — |
| January | 37.0 °C | 30.1 °C | 25.5 °C | 30.5 °C | 26.7 °C | 20.8 °C | 25.9 °C | 23.3 °C | 20.0 °C | 89.9 mm | 7.7 mm | — | — |
| February | 36.0 °C | 29.3 °C | 25.6 °C | 30.3 °C | 26.3 °C | 22.9 °C | 25.9 °C | 23.2 °C | 20.0 °C | 405.9 mm | 10.5 mm | — | — |
| March | 33.9 °C | 29.1 °C | 24.2 °C | 30.2 °C | 26.4 °C | 23.4 °C | 26.0 °C | 23.4 °C | 20.0 °C | 329.9 mm | 10.4 mm | — | — |
| April | 38.0 °C | 29.1 °C | 25.4 °C | 30.8 °C | 26.7 °C | 23.8 °C | 26.0 °C | 23.6 °C | 21.0 °C | 70.1 mm | 10.5 mm | — | — |
| May | 34.0 °C | 29.1 °C | 25.1 °C | 30.8 °C | 27.0 °C | 23.3 °C | 26.3 °C | 23.8 °C | 20.4 °C | 169.9 mm | 9.3 mm | — | — |
| June | 35.5 °C | 29.2 °C | 25.4 °C | 31.8 °C | 27.2 °C | 23.9 °C | 26.7 °C | 23.5 °C | 20.0 °C | 50.8 mm | 7.1 mm | — | — |
| July | 34.1 °C | 29.2 °C | 25.2 °C | 30.1 °C | 27.3 °C | 23.9 °C | 26.6 °C | 23.2 °C | 20.0 °C | 119.9 mm | 5.5 mm | — | — |
| August | 36.4 °C | 30.3 °C | 26.1 °C | 32.2 °C | 28.1 °C | 23.8 °C | 26.9 °C | 23.3 °C | 19.6 °C | 46.0 mm | 2.9 mm | — | — |
| September | 38.1 °C | 31.6 °C | 27.6 °C | 31.9 °C | 28.5 °C | 24.4 °C | 27.7 °C | 23.4 °C | 20.0 °C | 48.0 mm | 1.6 mm | — | — |
| October | 38.7 °C | 33.4 °C | 27.7 °C | 33.5 °C | 28.9 °C | 25.1 °C | 27.5 °C | 23.8 °C | 20.0 °C | 55.9 mm | 1.3 mm | — | — |
| November | 38.3 °C | 33.6 °C | 26.8 °C | 31.8 °C | 28.7 °C | 24.5 °C | 27.0 °C | 24.0 °C | 21.0 °C | 39.2 mm | 1.9 mm | — | — |
| December | 36.7 °C | 32.2 °C | 25.8 °C | 31.6 °C | 27.9 °C | 23.6 °C | 26.4 °C | 23.8 °C | 20.0 °C | 199.9 mm | 4.4 mm | — | — |
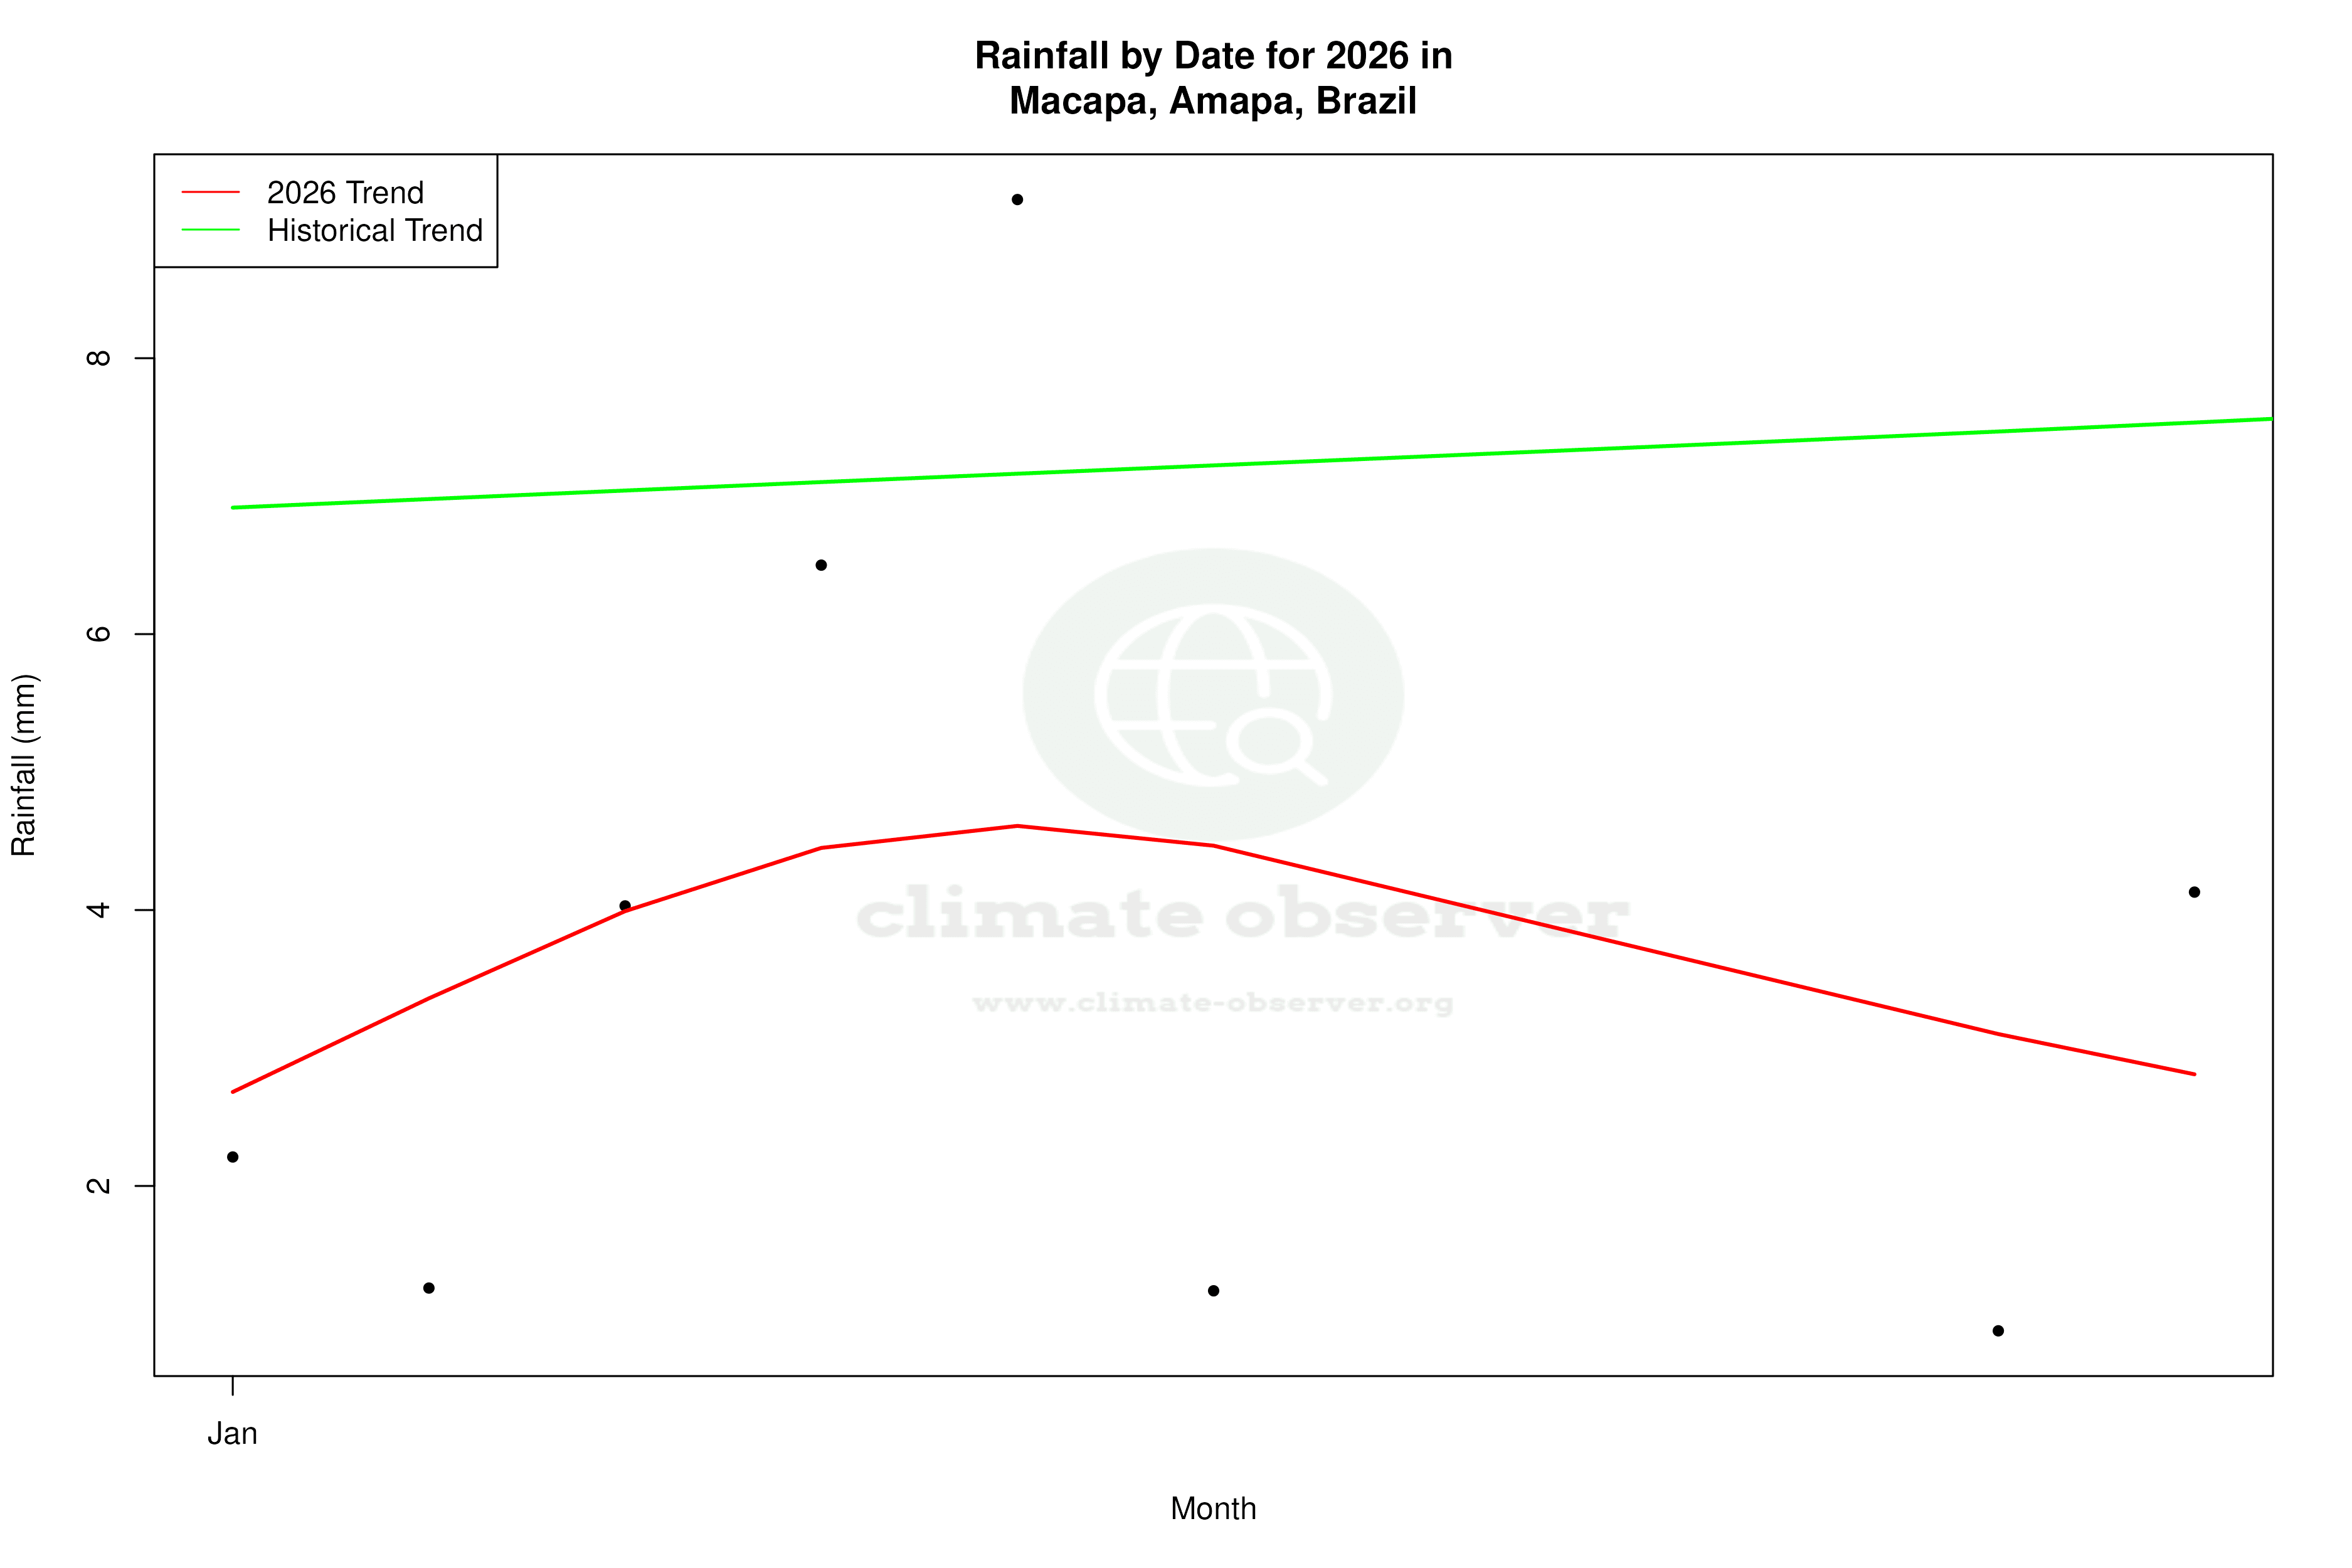
Data Visualisations
Remove WatermarksCurrent Year Climate Trends vs Historical


Max Temperature this Year | 1 of 6
Climate 12-Month Moving Averages


Max Temperature 12-Month MA | 1 of 6
Daily Data Points and Averages Throughout the Year


Average Max Temperature Throughout Year | 1 of 5
