Climate for Station: Vilhena, Rondonia, Brazil
Loading live weather...
Climate Analysis & Overview
Vilhena, nestled in Brazil's northern region, is experiencing a notable warming trend, with high temperatures rising by 0.73°C (1.31°F) over the long term. Precipitation is becoming increasingly concentrated, indicating potential challenges for water management and agriculture.
Tropical Climate Dynamics
Vilhena is situated in a region characterised by a Tropical Savanna climate (Aw) under the Köppen classification. This climate is marked by distinct wet and dry seasons, influenced by its proximity to the Amazon rainforest and the Madeira River. The geography plays a crucial role in shaping Vilhena's climate, with the surrounding forest acting as a buffer, moderating temperature extremes and influencing precipitation patterns.
Temperature Trends and Shifts
Over the past decade, Vilhena has experienced a warming trend, with average high temperatures increasing by 0.58°C (1.04°F). This is consistent with the all-time trend, where highs have risen by 0.73°C (1.31°F). In contrast, low temperatures have shown minimal change over the past decade, with a slight increase of 0.03°C (0.05°F). The all-time trend for lows is more pronounced, with an increase of 0.31°C (0.56°F). These shifts suggest a warming climate, which could have implications for local ecosystems and human activities.
Precipitation Concentration and Implications
The Precipitation Concentration Index (PCI) for Vilhena has risen from a baseline of 14.4 to a current value of 18.2. This increase indicates that rainfall is becoming more concentrated in fewer events, which can lead to challenges such as flooding and soil erosion during the wet season, and water scarcity during the dry season. A PCI above 20 would indicate highly concentrated precipitation, so while Vilhena is not yet at that level, the trend suggests increasing variability in rainfall distribution.
Record Extremes and Regional Context
Vilhena's climate records show a maximum temperature of 39.0°C (102.2°F) and a minimum of 5.6°C (42.1°F). These extremes highlight the potential for significant temperature variability, although the region's tropical climate typically moderates such fluctuations. Brazil's regional climate goals, which focus on reducing deforestation and promoting sustainable land use, are critical in managing these climatic changes. The warming trends and increasing precipitation concentration underscore the importance of these initiatives.
Future Considerations
The warming trends and changing precipitation patterns in Vilhena are reflective of broader climatic shifts occurring across the Amazon basin. These changes have significant implications for agriculture, water resources, and biodiversity. As Brazil continues to pursue its climate goals, understanding and adapting to these localised changes will be crucial in mitigating potential impacts and ensuring sustainable development in the region.
Station Statistics
10-Year Trend
High: +0.43 °C/decade
Low: +0.11 °C/decade
Rain: -2.05 mm/decade
25-Year Trend
High: +0.88 °C/decade
Low: +0.45 °C/decade
Rain: -0.87 mm/decade
50-Year Trend
High: +0.72 °C/decade
Low: +0.31 °C/decade
Rain: -0.42 mm/decade
All-Time Trend
High: +0.72 °C/decade
Low: +0.31 °C/decade
Rain: -0.42 mm/decade
Percentage Above-Average Days
Last 12 Months: 54.0%
This Year: 73.1%
Precipitation Concentration Index (PCI) ℹ️
Last 12 Months: 12.8
Historical Average: 13.4
Percentile Rank of Last 12 Months ℹ️
High: 78th percentile
Low: 84th percentile
Rain: 19th percentile
Change in Variance ℹ️
High: +16.5%
Low: +9.5%
Intraday: +16.7%
Data Coverage
86.8%
First Year of Data
1973
Station Location
Historical Weather Records
| Max High | Avg High | Min High | Max Avg | Avg Avg | Min Avg | Max Low | Avg Low | Min Low | Max Precipitation | Avg Precipitation | Max Snow | Avg Snow | |
|---|---|---|---|---|---|---|---|---|---|---|---|---|---|
| Record | 39.0 °C | — | 15.4 °C | 32.9 °C | — | 11.6 °C | 28.0 °C | — | 5.6 °C | 230.1 mm | — | — | — |
| January | 33.0 °C | 27.6 °C | 22.5 °C | 30.0 °C | 24.3 °C | 20.7 °C | 24.0 °C | 21.0 °C | 15.9 °C | 148.1 mm | 10.0 mm | — | — |
| February | 33.0 °C | 27.7 °C | 23.0 °C | 30.1 °C | 24.3 °C | 19.4 °C | 24.5 °C | 21.0 °C | 16.0 °C | 101.1 mm | 9.9 mm | — | — |
| March | 33.4 °C | 27.8 °C | 23.2 °C | 30.1 °C | 24.6 °C | 17.2 °C | 24.8 °C | 21.1 °C | 15.3 °C | 131.1 mm | 8.7 mm | — | — |
| April | 32.6 °C | 27.8 °C | 17.1 °C | 30.3 °C | 24.8 °C | 16.1 °C | 26.5 °C | 20.7 °C | 12.2 °C | 230.1 mm | 5.6 mm | — | — |
| May | 34.0 °C | 27.2 °C | 19.8 °C | 29.3 °C | 24.3 °C | 13.8 °C | 24.8 °C | 19.3 °C | 8.4 °C | 47.1 mm | 2.1 mm | — | — |
| June | 35.8 °C | 27.1 °C | 15.4 °C | 30.1 °C | 24.0 °C | 11.6 °C | 23.8 °C | 17.9 °C | 6.3 °C | 67.1 mm | 0.6 mm | — | — |
| July | 33.7 °C | 27.9 °C | 17.7 °C | 29.6 °C | 24.2 °C | 13.5 °C | 24.0 °C | 17.0 °C | 5.6 °C | 42.3 mm | 0.2 mm | — | — |
| August | 36.5 °C | 30.1 °C | 19.3 °C | 31.9 °C | 25.7 °C | 14.3 °C | 24.8 °C | 18.6 °C | 7.8 °C | 63.4 mm | 1.2 mm | — | — |
| September | 39.0 °C | 31.2 °C | 20.7 °C | 32.6 °C | 26.2 °C | 14.9 °C | 25.5 °C | 20.5 °C | 11.6 °C | 72.9 mm | 2.9 mm | — | — |
| October | 38.4 °C | 30.2 °C | 22.4 °C | 32.9 °C | 25.8 °C | 17.7 °C | 28.0 °C | 21.2 °C | 14.5 °C | 86.1 mm | 5.8 mm | — | — |
| November | 37.2 °C | 28.7 °C | 22.6 °C | 31.6 °C | 25.2 °C | 17.4 °C | 26.0 °C | 21.2 °C | 14.6 °C | 102.1 mm | 7.1 mm | — | — |
| December | 33.0 °C | 27.8 °C | 23.0 °C | 30.3 °C | 24.6 °C | 20.5 °C | 24.4 °C | 21.2 °C | 13.7 °C | 84.1 mm | 8.3 mm | — | — |
Data Visualisations
Remove WatermarksCurrent Year Climate Trends vs Historical
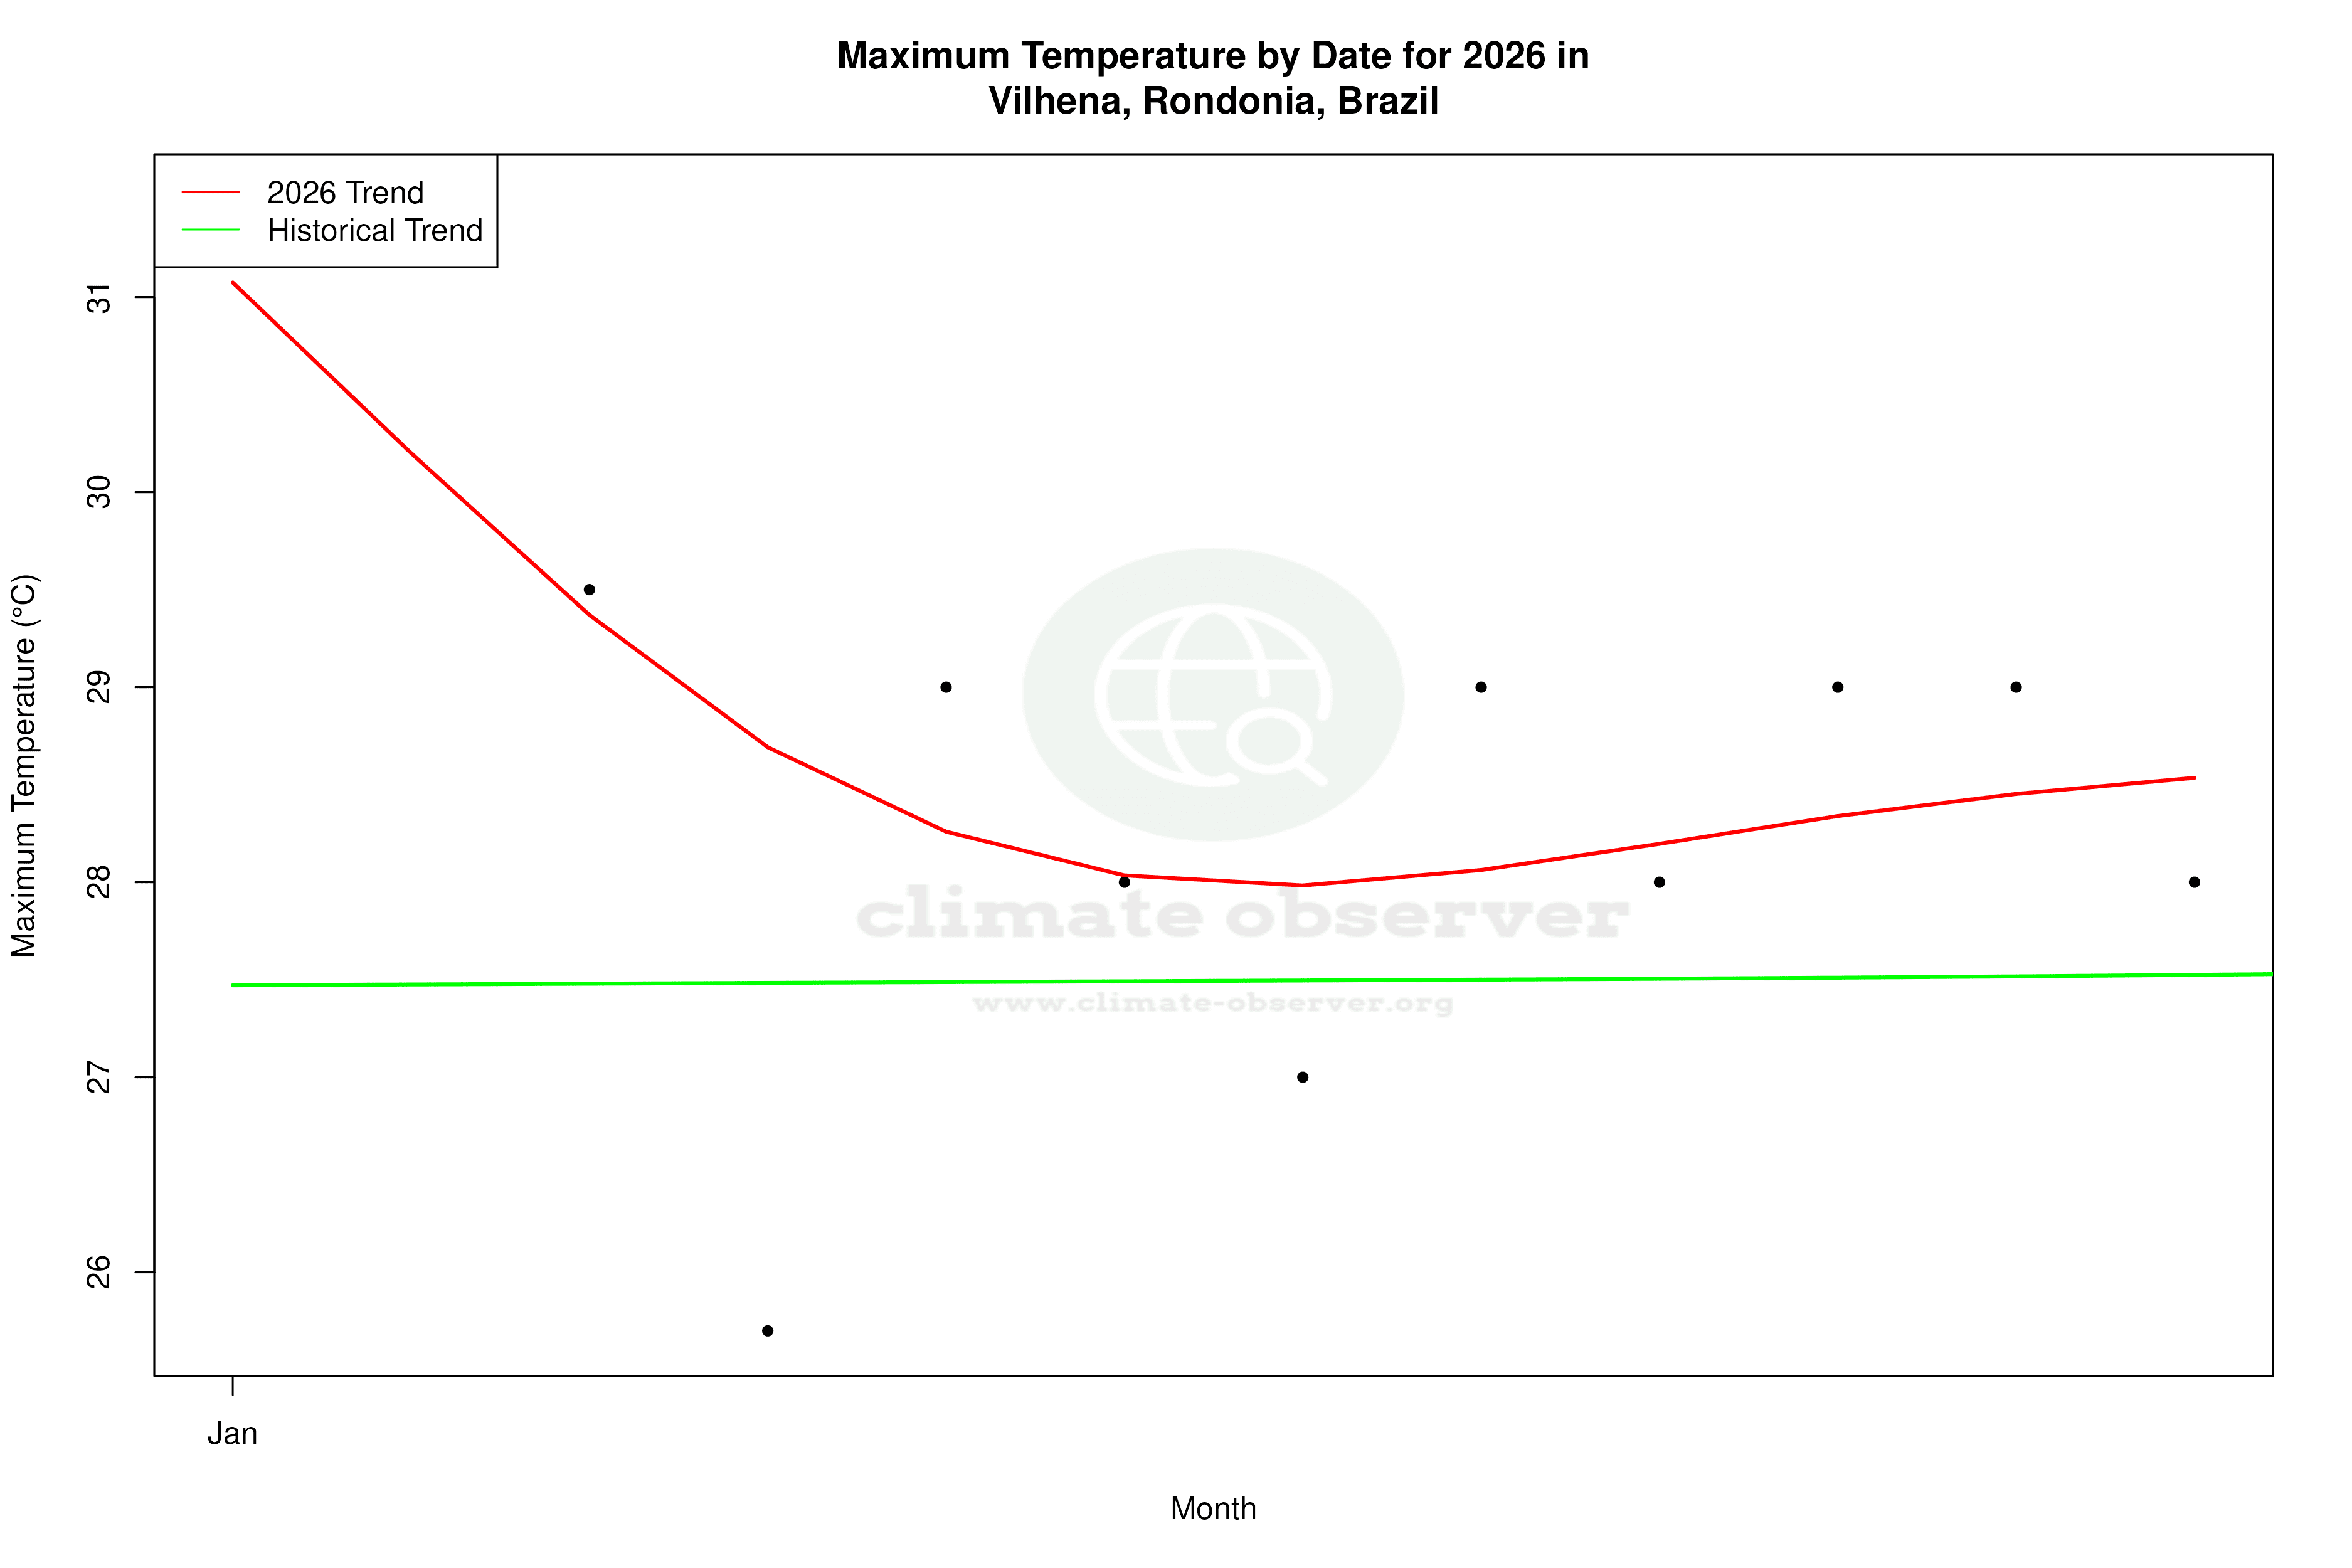


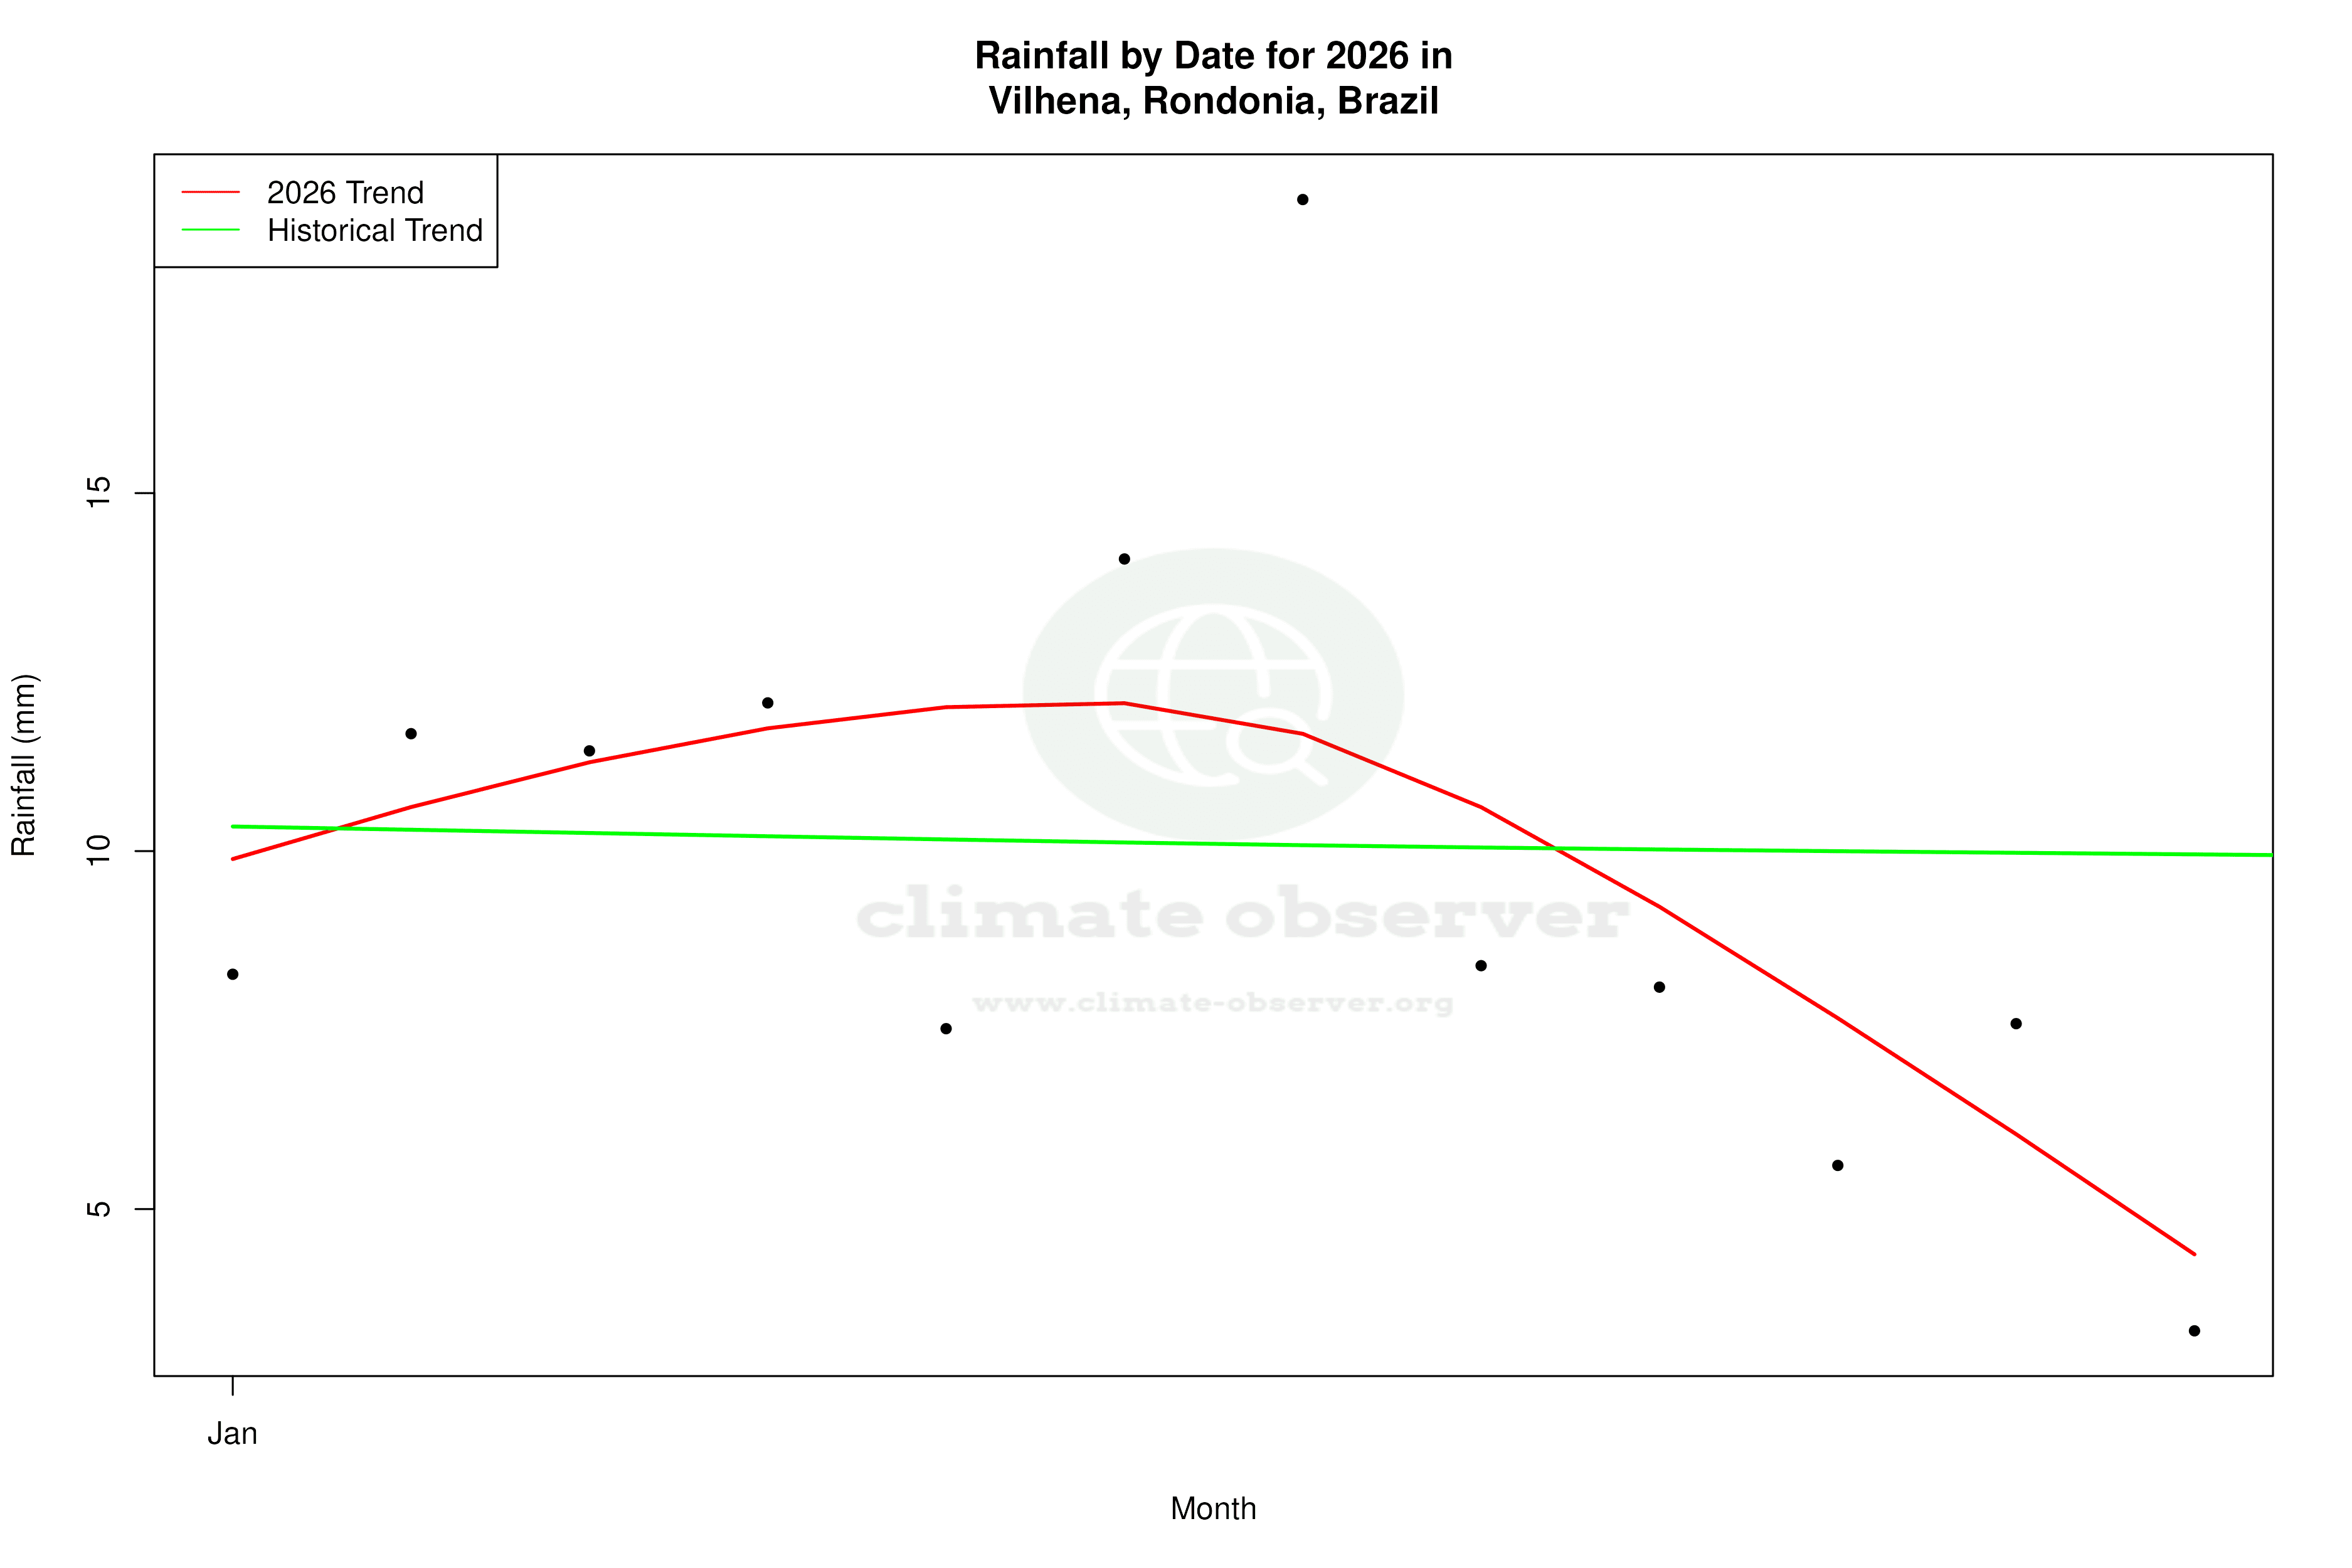


Max Temperature this Year | 1 of 6
Climate 12-Month Moving Averages


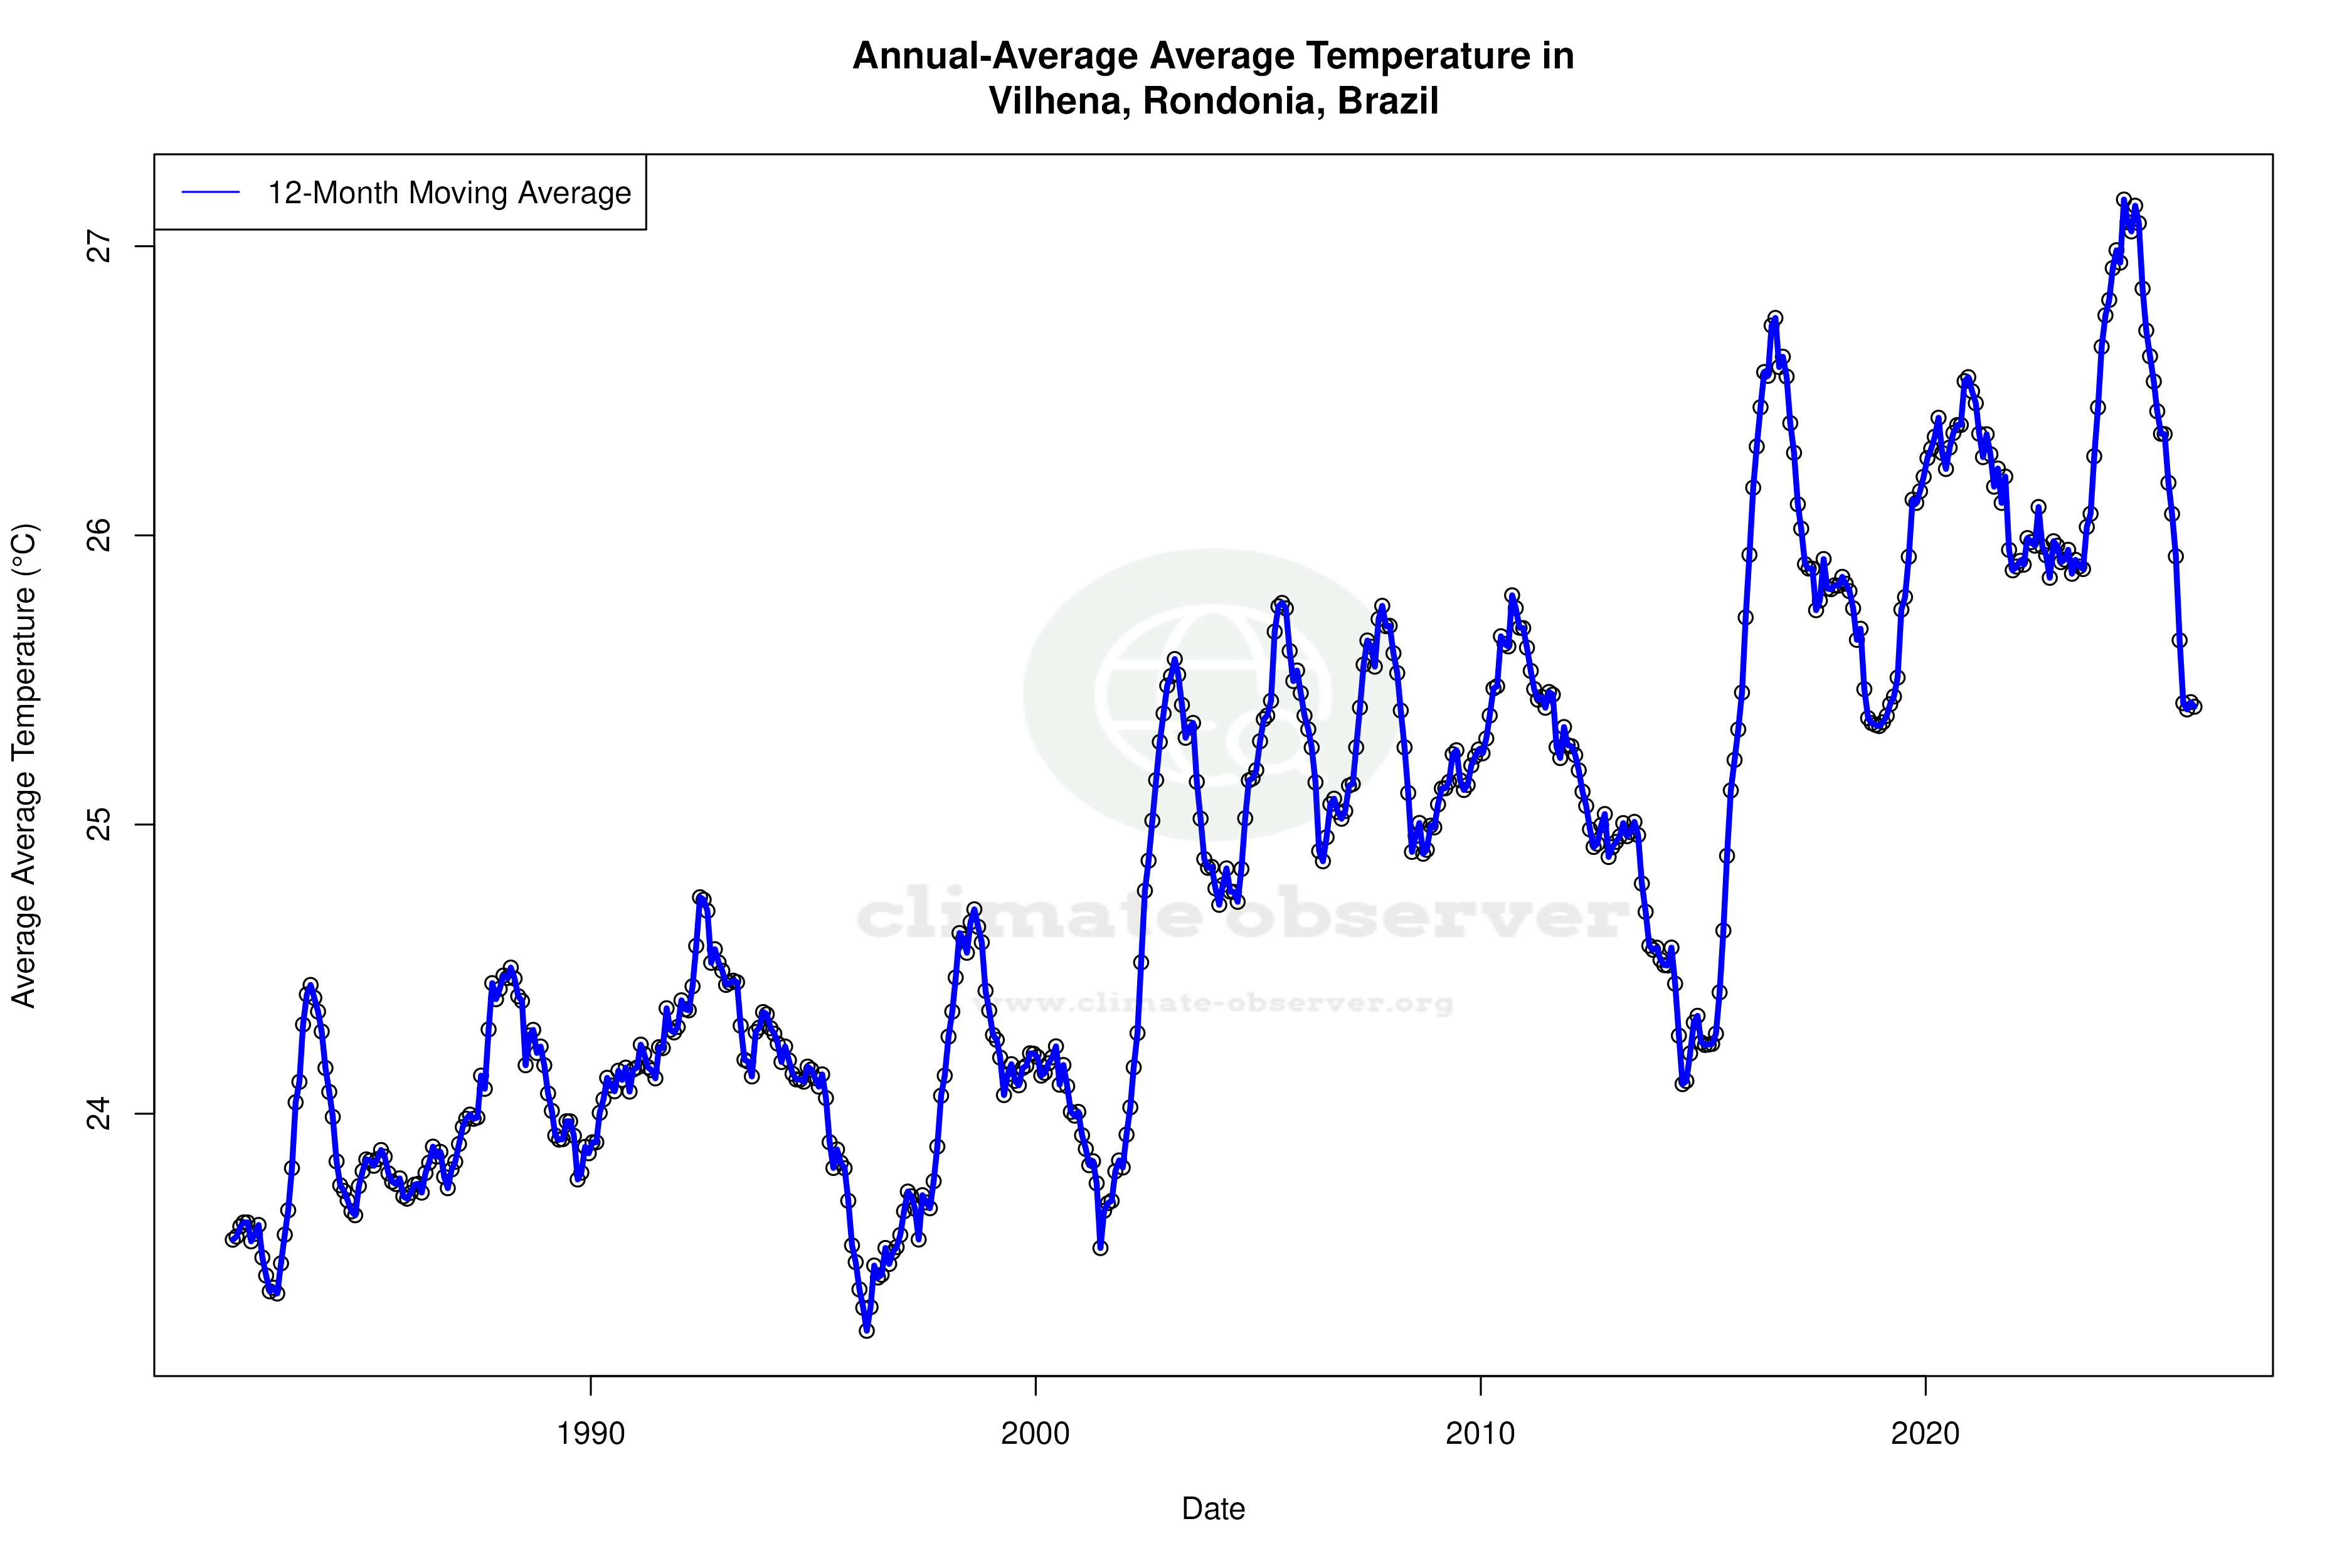
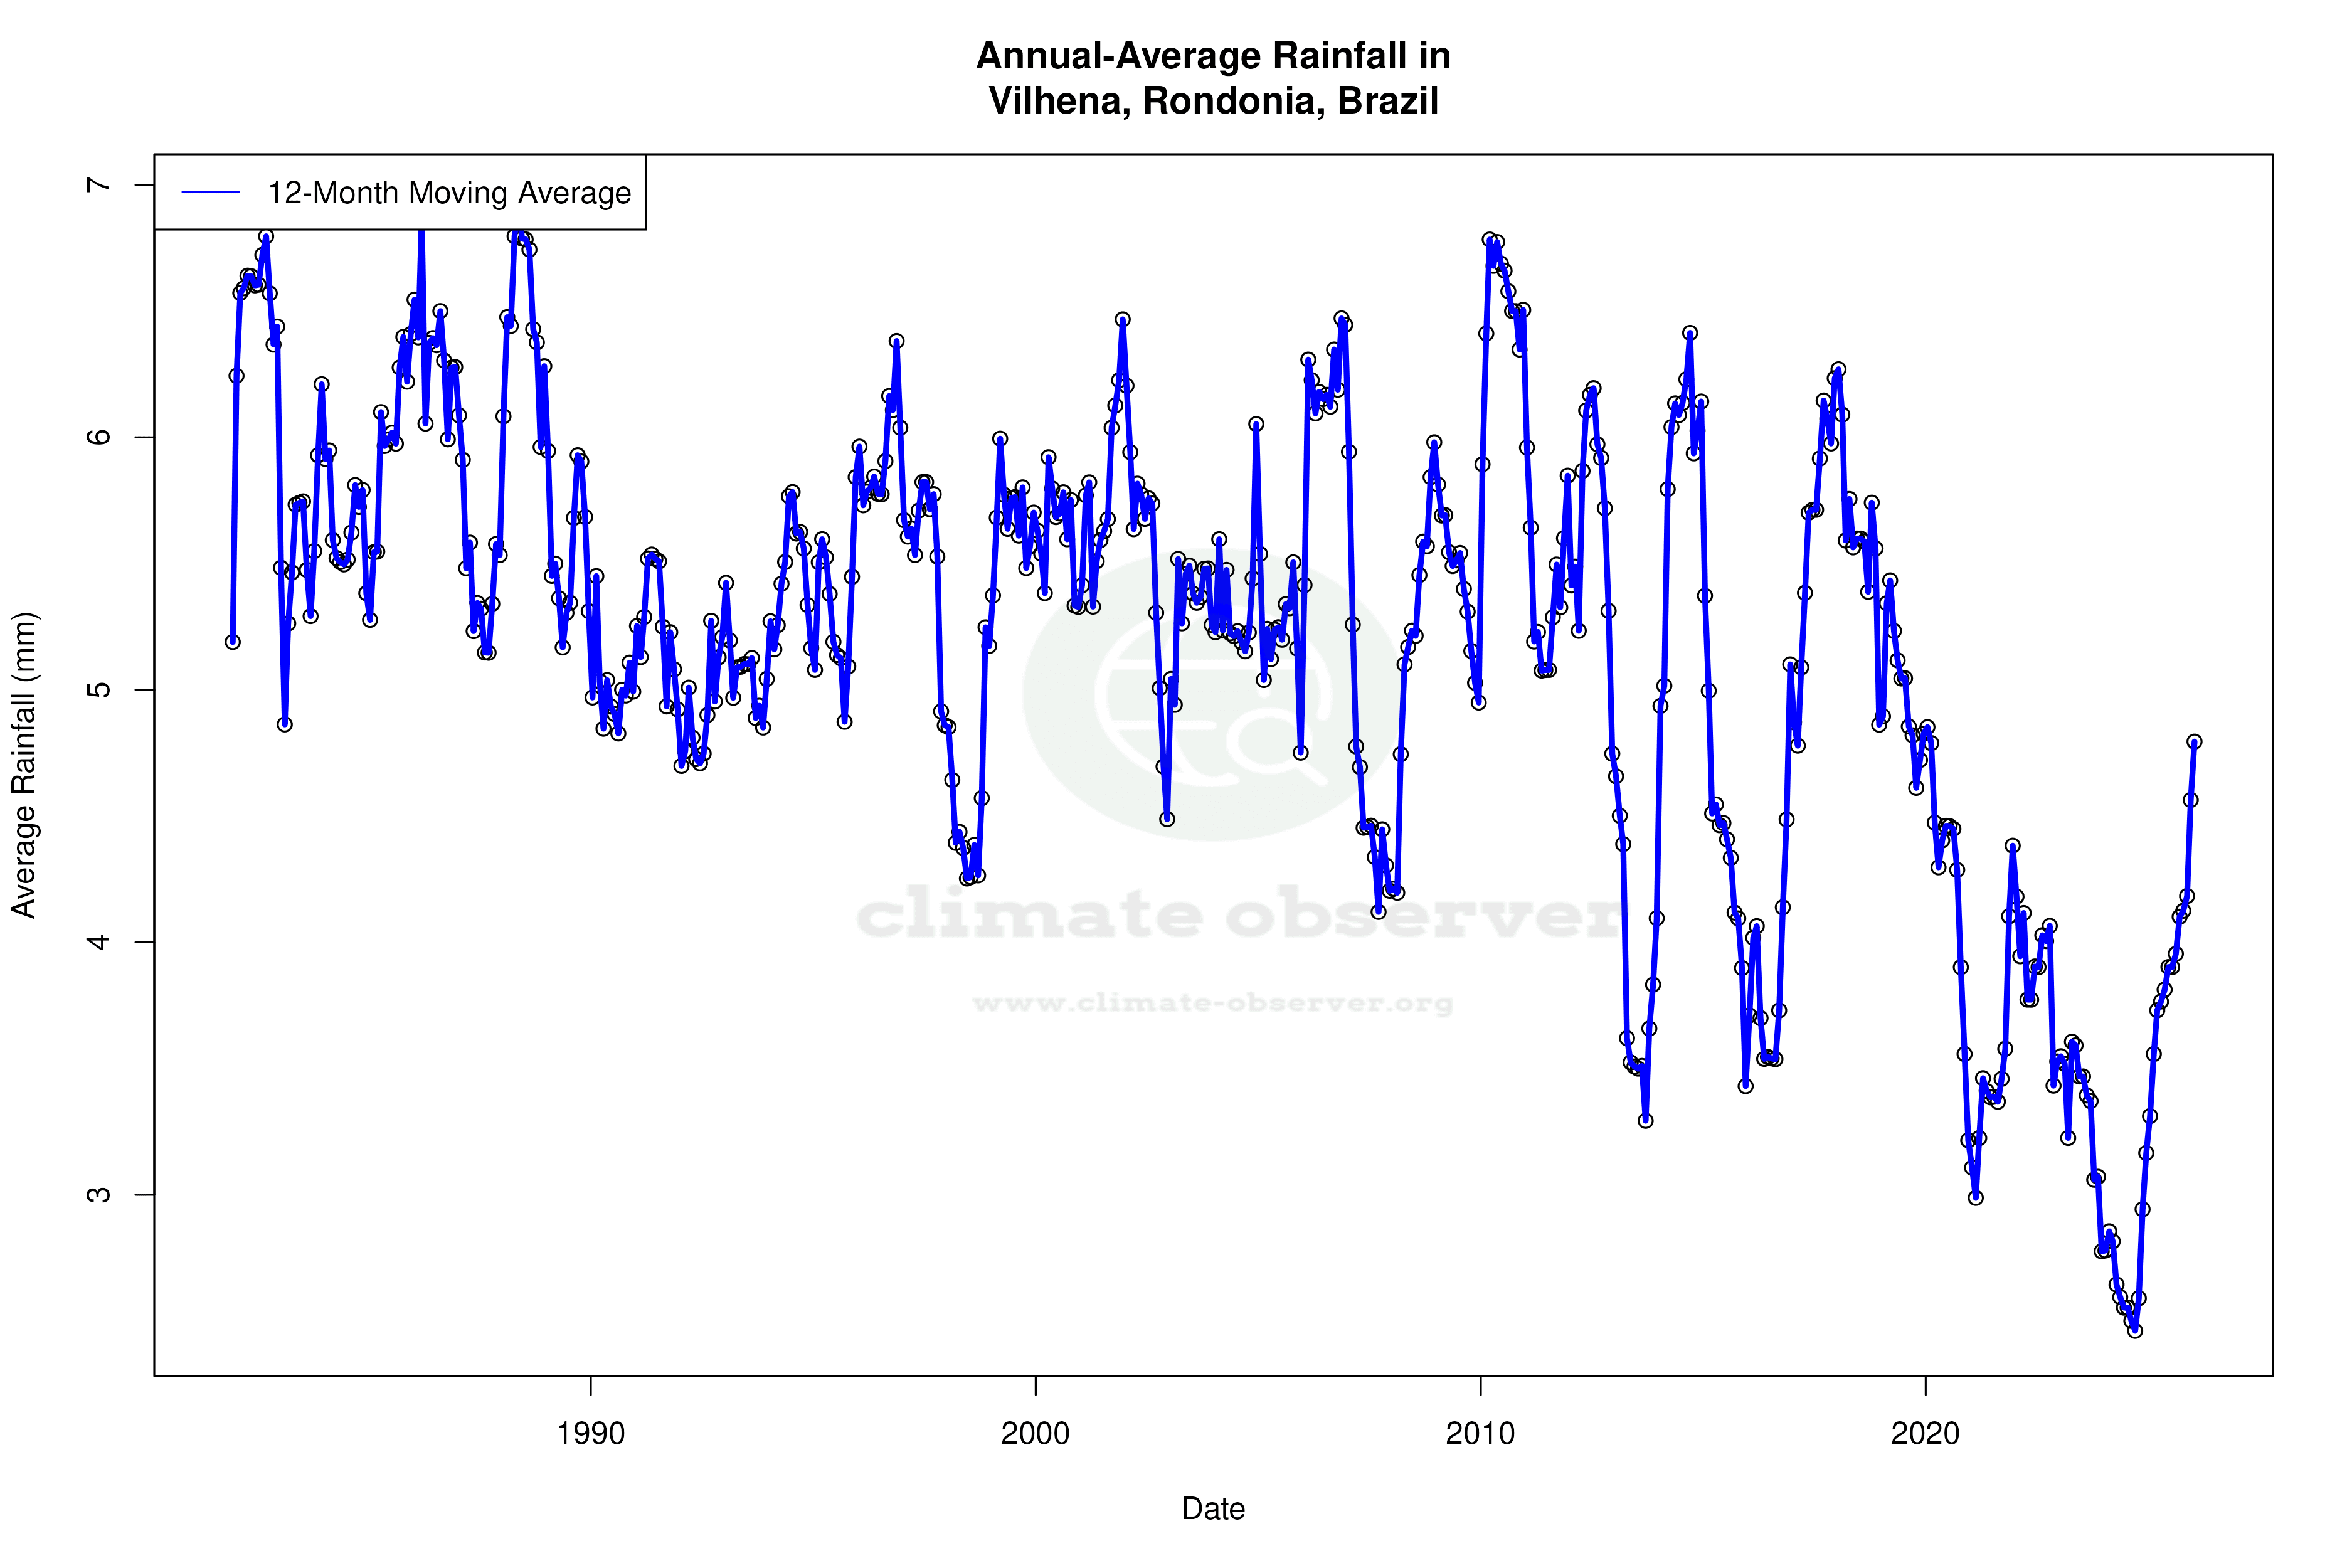


Max Temperature 12-Month MA | 1 of 6
Daily Data Points and Averages Throughout the Year
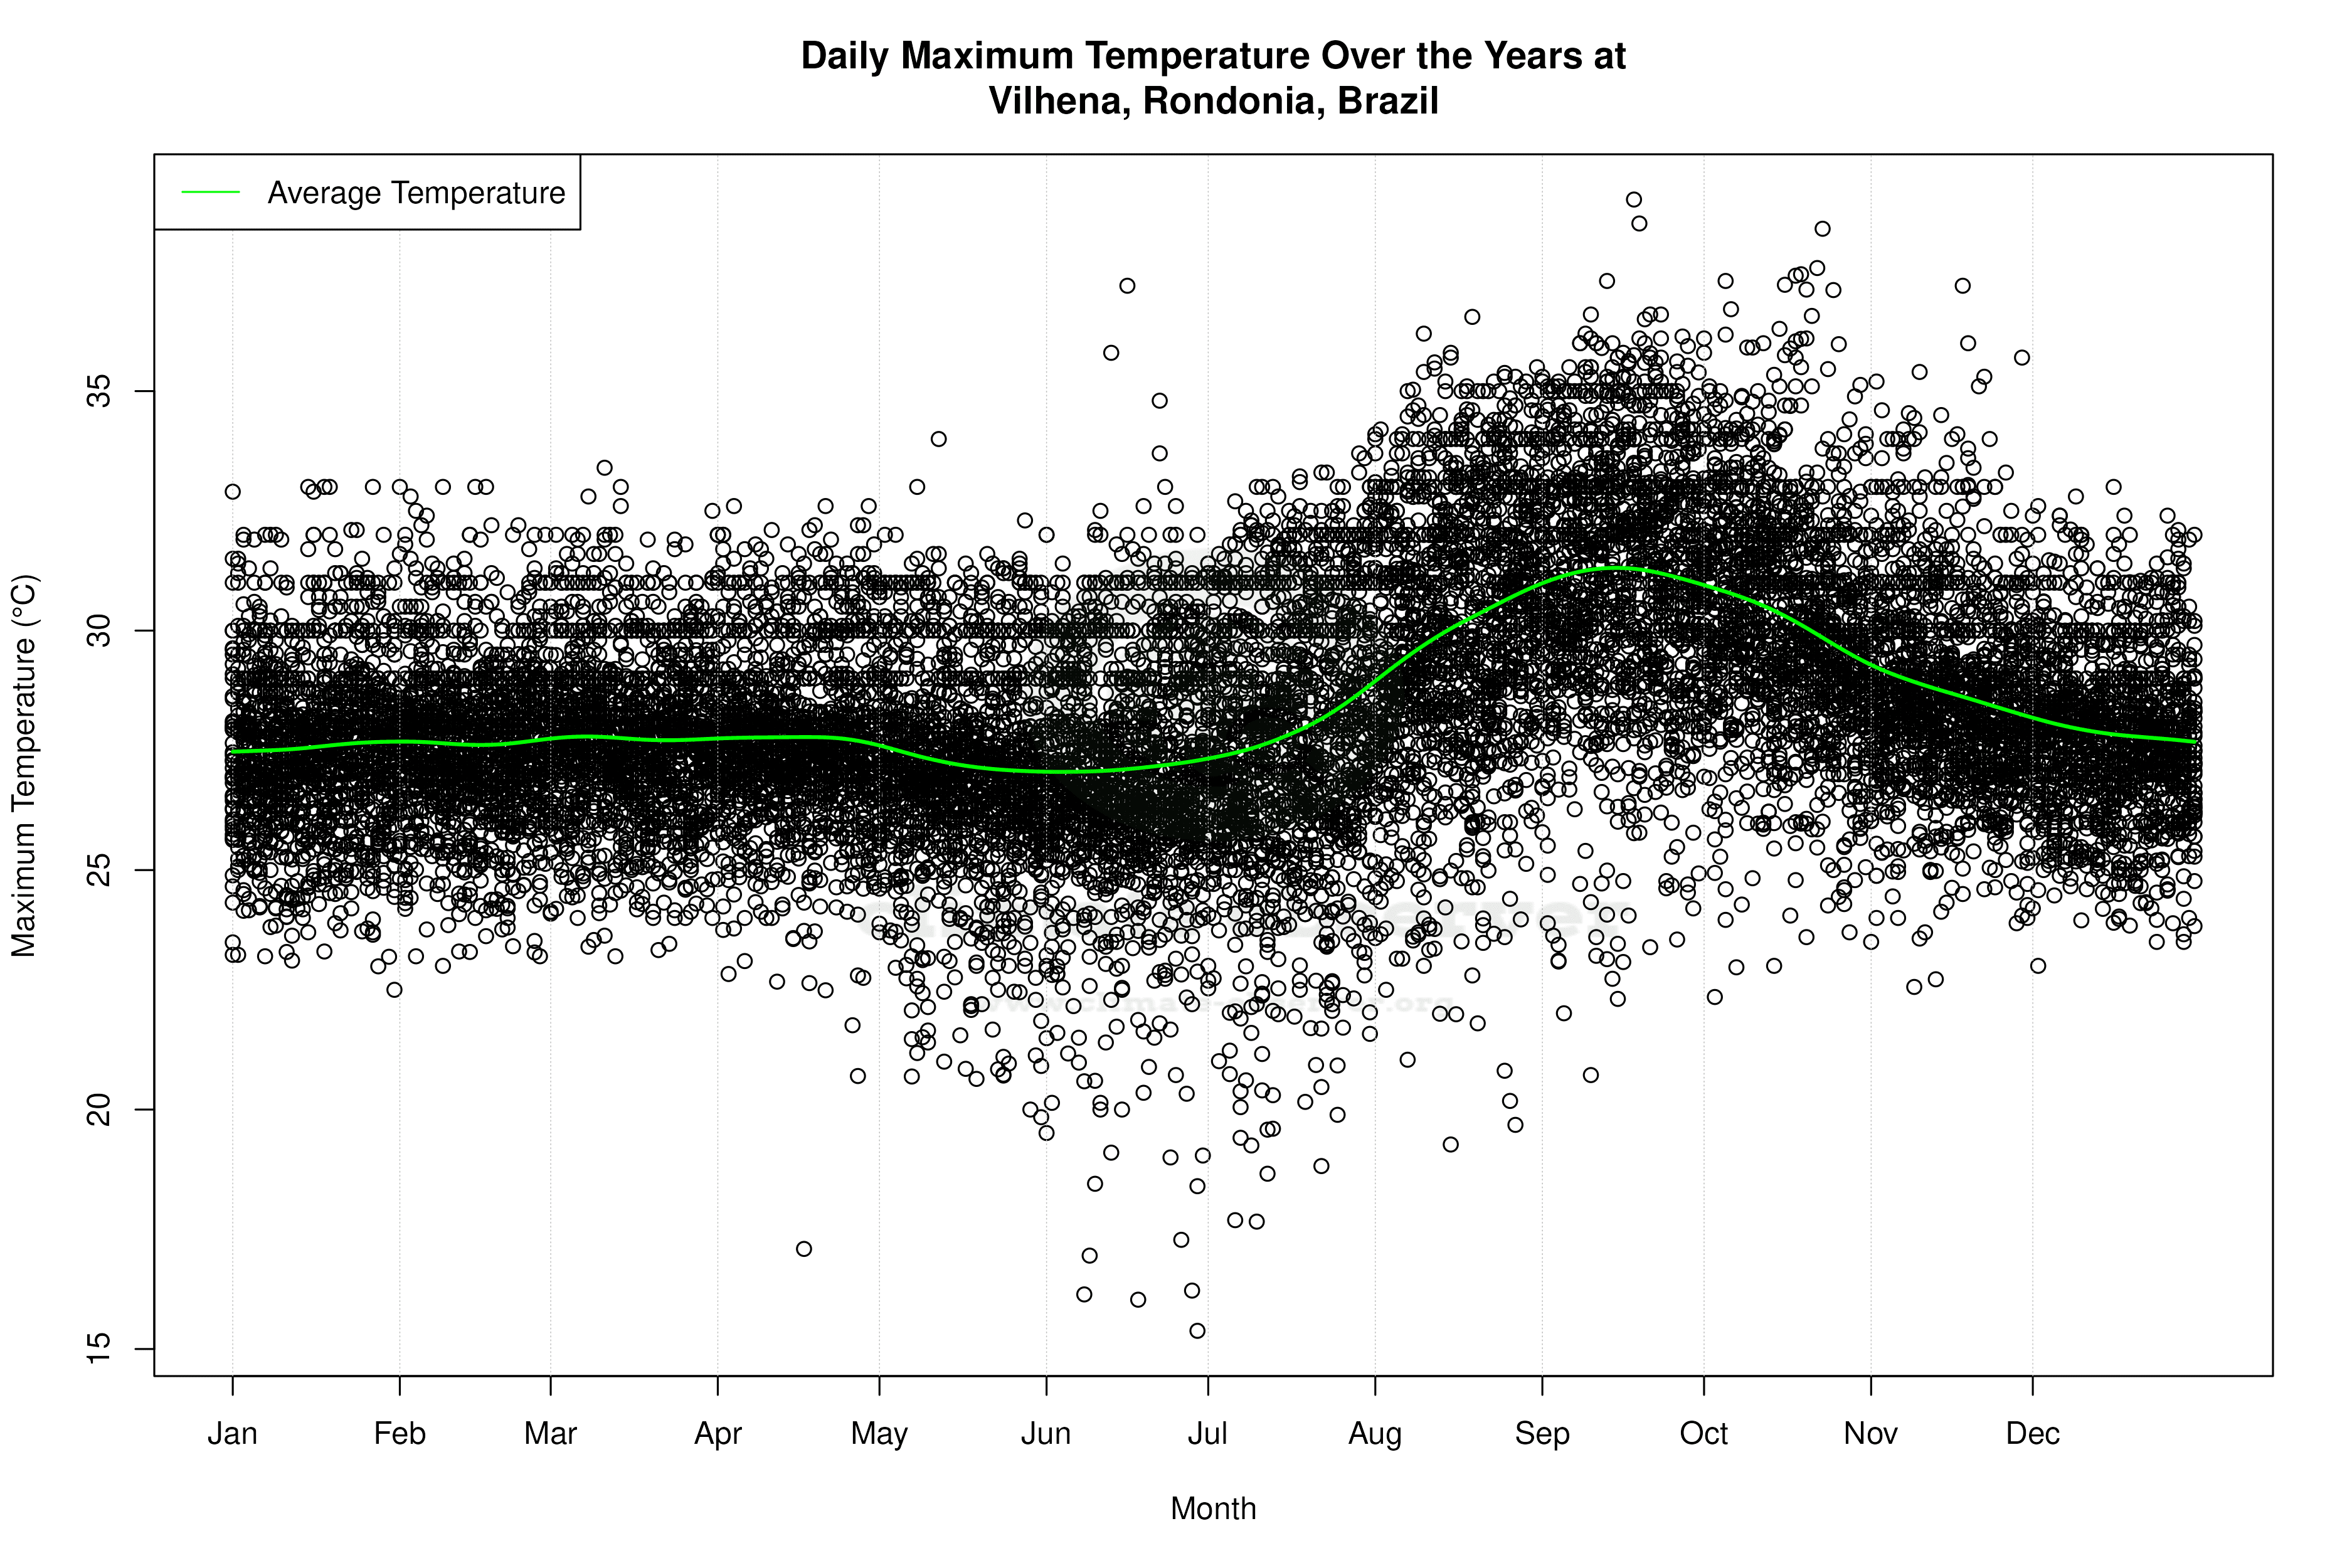
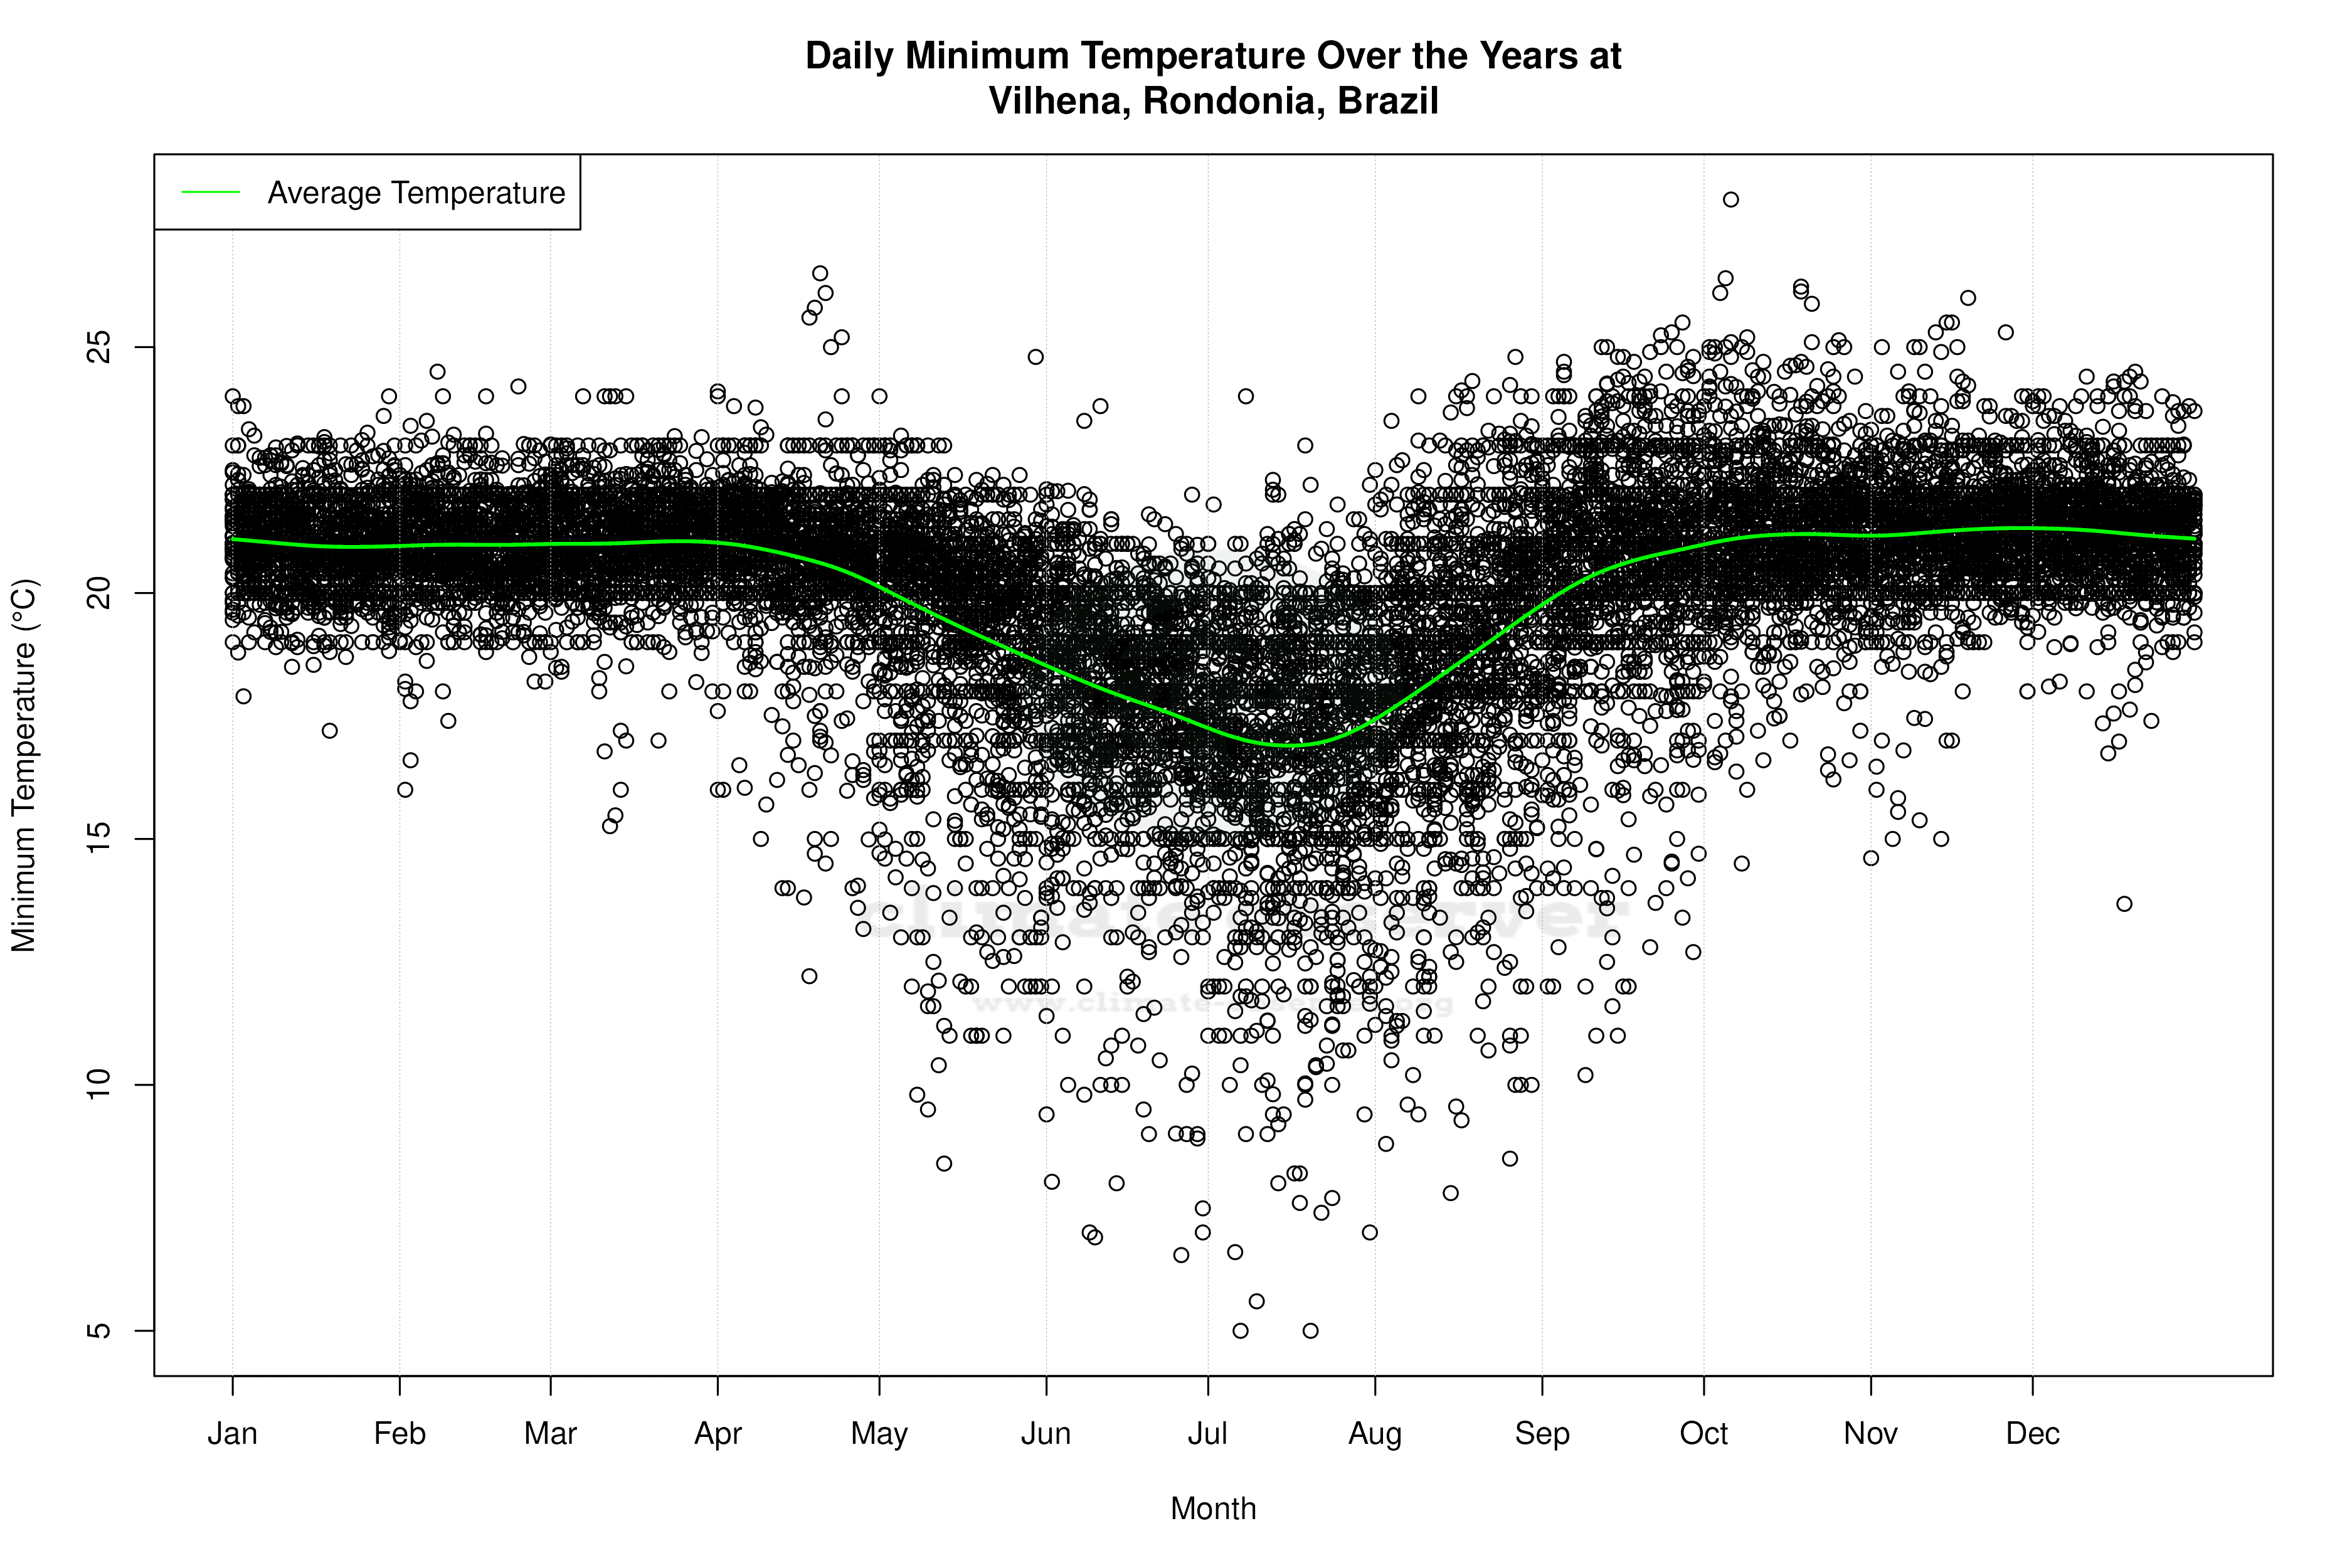
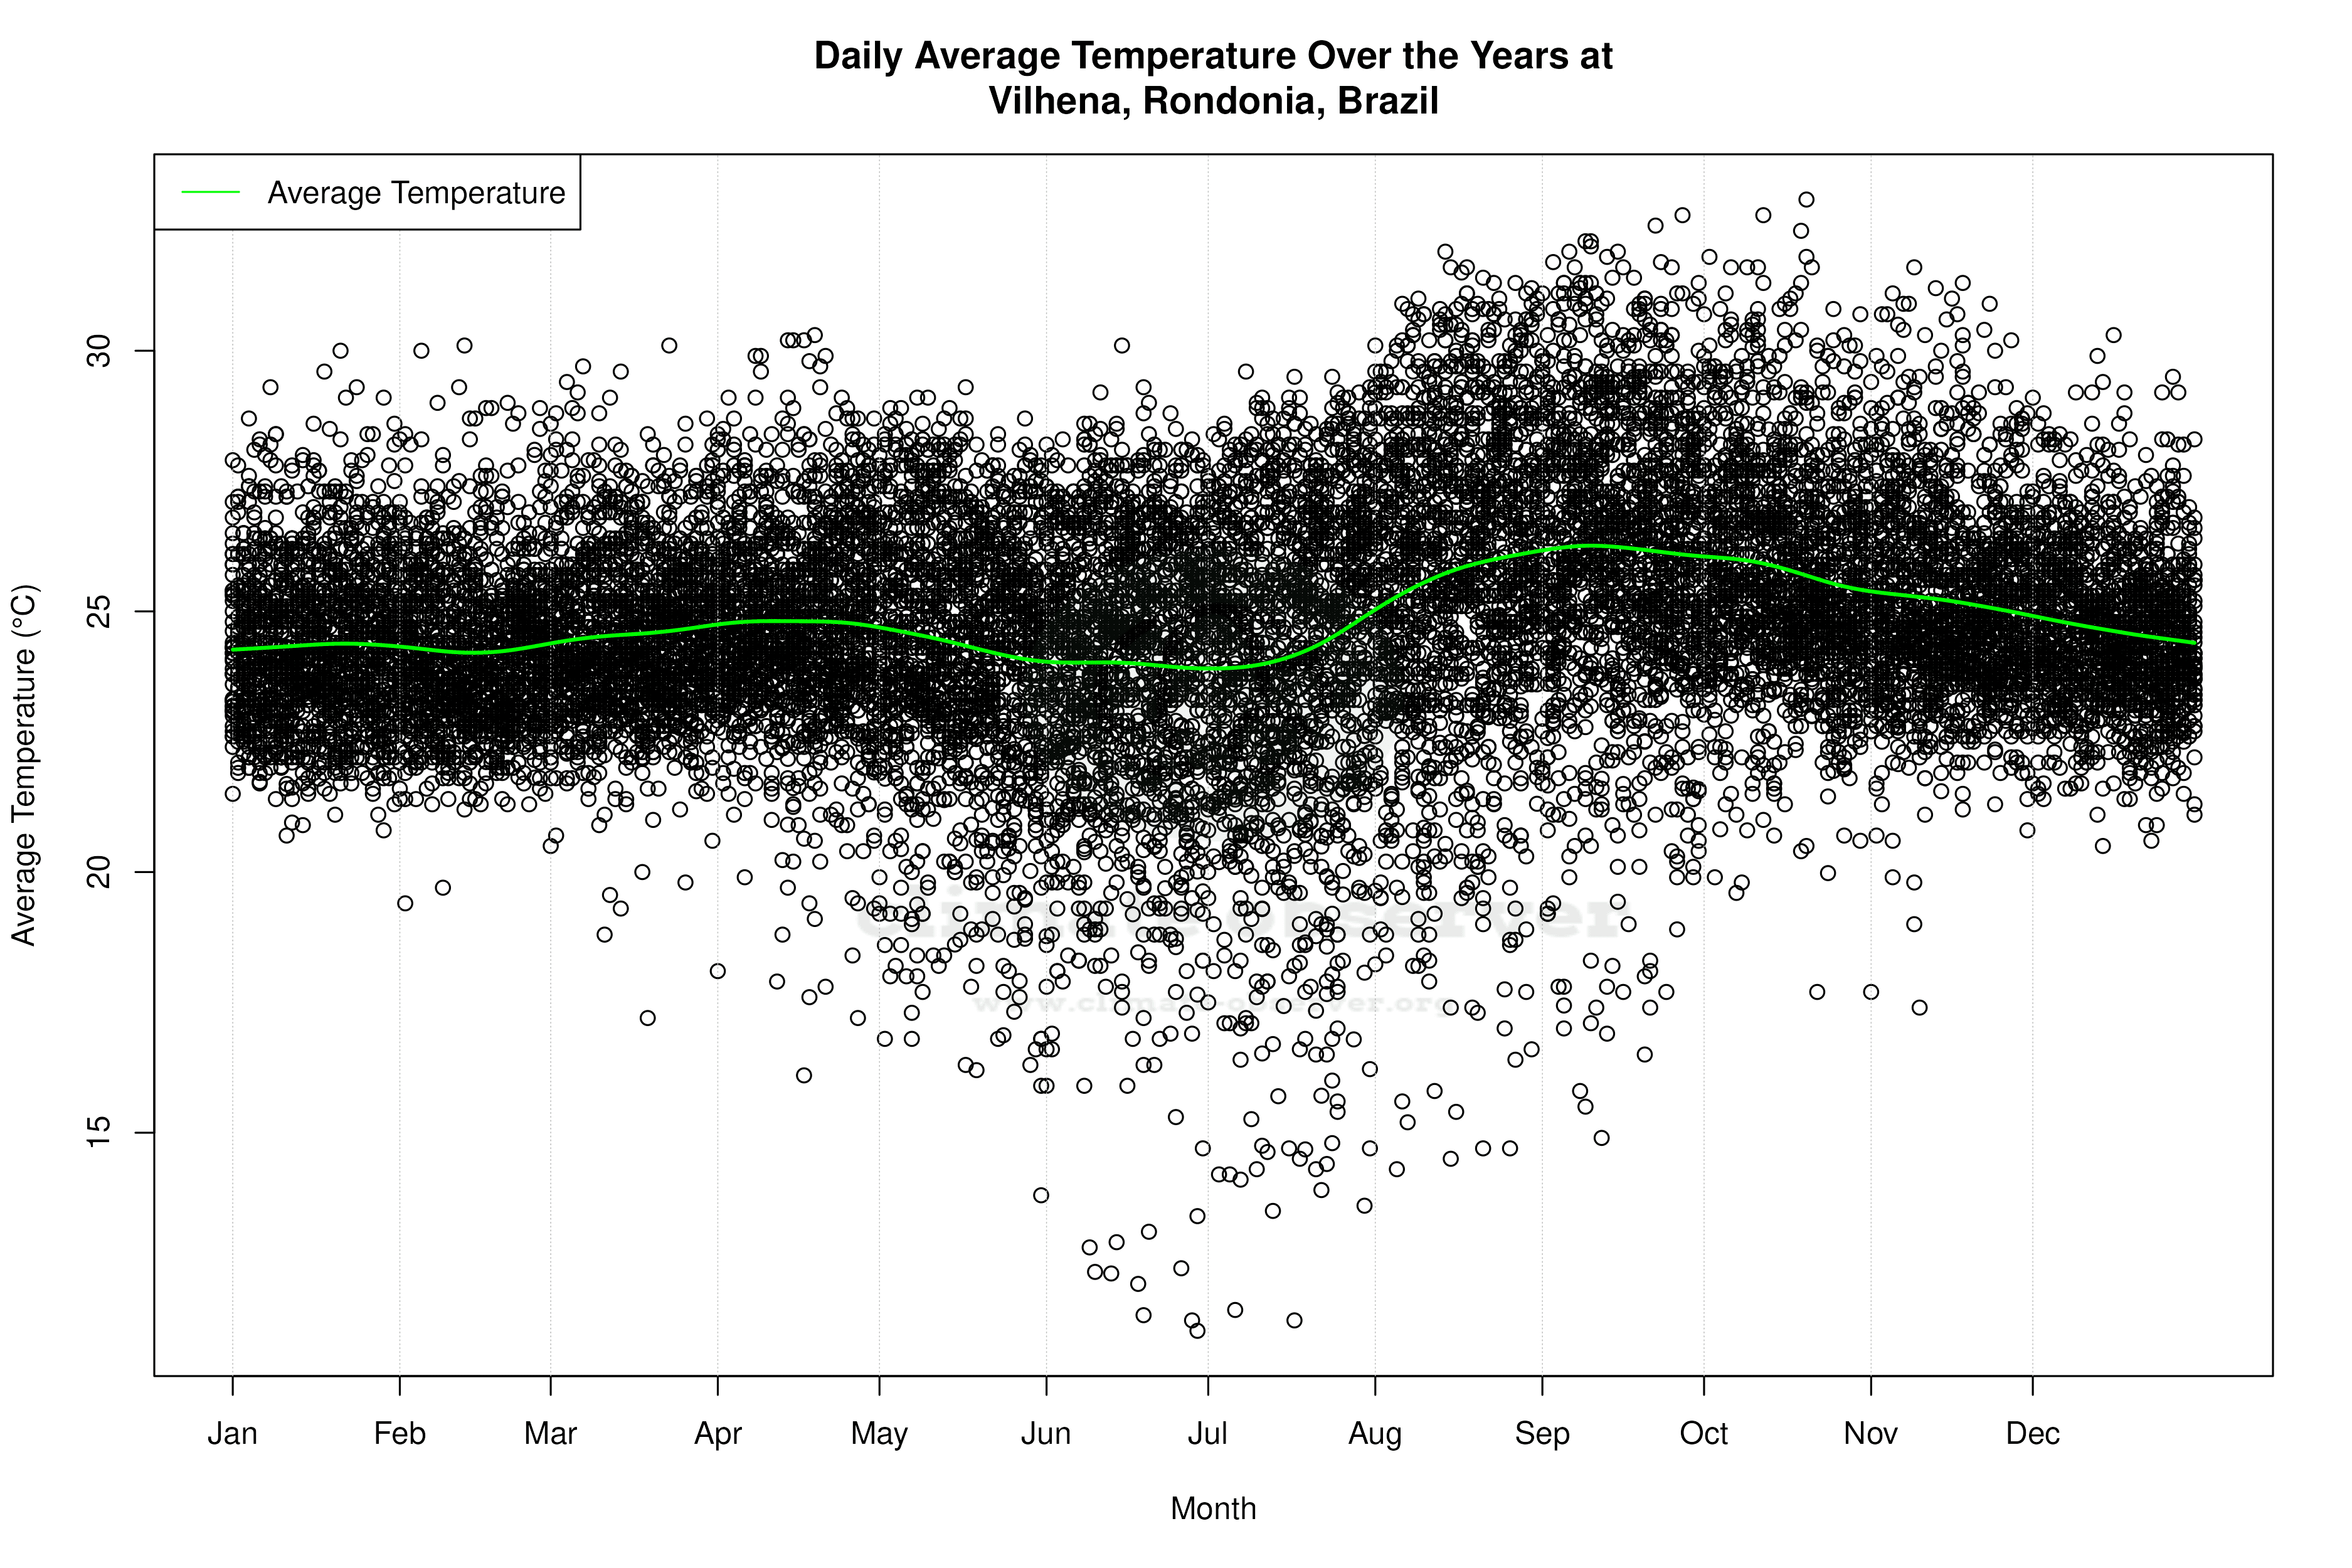


Average Max Temperature Throughout Year | 1 of 5
