Climate for Station: Tancredo Neves Intl, Minas Gerais, Brazil
Loading live weather...
Climate Analysis & Overview
Aeroporto Internacional Tancredo Neves, located in the southeastern region of Brazil, presents a complex climate profile with contrasting trends. Over the long term, temperatures are rising, but the last decade has seen a cooling trend in lows. Precipitation is becoming slightly more concentrated, indicating potential shifts in weather patterns.
Climatic Context and Geographical Influence
Tancredo Neves International Airport is situated in the Região Sudeste of Brazil, specifically within the geographical bounds of Minas Gerais. The area is characterised by a Cwa Köppen climate classification, which denotes a subtropical highland climate with dry winters and wet summers. The local geography, including its proximity to the Serra do Curral mountain range, plays a significant role in influencing weather patterns, often moderating extreme temperatures and affecting precipitation distribution.
Temperature Trends: A Dual Narrative
The temperature trends at Tancredo Neves reveal a nuanced story. Over the all-time record, there has been a 0.17°C (0.31°F) rise in high temperatures, indicating a warming trend. This aligns with broader regional climate goals focused on understanding and mitigating temperature increases. Conversely, the last decade has shown a cooling trend in low temperatures, with a notable decrease of 0.65°C (1.17°F). This divergence between long-term warming and recent cooling underscores the complexity of local climate dynamics.
Precipitation Patterns: Concentration on the Rise
The Precipitation Concentration Index (PCI) at Tancredo Neves has experienced a marginal increase from a baseline of 17.75 to a current value of 17.92. PCI measures how precipitation is distributed over time, with higher values indicating more concentrated rainfall events. While the change is slight, it suggests a trend towards more intense but less frequent rainfall, a pattern that could have implications for water management and agricultural practices in the region.
Temperature Extremes: Records of Note
The station's temperature records highlight the extremes experienced in this region. The highest recorded temperature stands at 39.0°C (102.2°F), while the lowest is 1.5°C (34.7°F). These extremes provide a framework for understanding the potential range of thermal conditions that can be expected, informing both infrastructure planning and emergency preparedness.
Regional Implications and Future Considerations
The climate data from Tancredo Neves is a microcosm of the broader climatic shifts occurring in Brazil. As the country works towards its climate goals, understanding these localised trends becomes crucial. The recent cooling in lows contrasts with the long-term warming of highs, while the slight increase in precipitation concentration points to evolving weather patterns. These insights are vital for developing adaptive strategies in response to climate variability.
Station Statistics
10-Year Trend
High: -0.03 °C/decade
Low: -0.64 °C/decade
Rain: -0.18 mm/decade
25-Year Trend
High: +0.41 °C/decade
Low: +0.71 °C/decade
Rain: -0.32 mm/decade
50-Year Trend
High: +0.41 °C/decade
Low: +0.44 °C/decade
Rain: -0.30 mm/decade
All-Time Trend
High: +0.16 °C/decade
Low: +0.25 °C/decade
Rain: -0.10 mm/decade
Percentage Above-Average Days
Last 12 Months: 51.2%
This Year: 45.0%
Precipitation Concentration Index (PCI) ℹ️
Last 12 Months: 19.5
Historical Average: 18.2
Percentile Rank of Last 12 Months ℹ️
High: 83rd percentile
Low: 83rd percentile
Rain: 11th percentile
Change in Variance ℹ️
High: +1.6%
Low: -14.6%
Intraday: -28.1%
Data Coverage
80.4%
First Year of Data
1946
Station Location
Historical Weather Records
| Max High | Avg High | Min High | Max Avg | Avg Avg | Min Avg | Max Low | Avg Low | Min Low | Max Precipitation | Avg Precipitation | Max Snow | Avg Snow | |
|---|---|---|---|---|---|---|---|---|---|---|---|---|---|
| Record | 39.0 °C | — | 14.1 °C | 30.8 °C | — | 10.1 °C | 24.2 °C | — | 1.5 °C | 137.5 mm | — | — | — |
| January | 36.0 °C | 27.8 °C | 17.5 °C | 28.9 °C | 22.9 °C | 16.0 °C | 23.8 °C | 18.7 °C | 13.0 °C | 137.5 mm | 8.4 mm | — | — |
| February | 37.4 °C | 28.1 °C | 19.4 °C | 29.8 °C | 23.2 °C | 17.3 °C | 24.0 °C | 18.7 °C | 12.6 °C | 102.0 mm | 5.9 mm | — | — |
| March | 34.8 °C | 27.7 °C | 19.5 °C | 28.4 °C | 22.7 °C | 17.3 °C | 23.0 °C | 18.3 °C | 11.7 °C | 77.0 mm | 4.8 mm | — | — |
| April | 32.5 °C | 27.1 °C | 17.8 °C | 27.4 °C | 21.6 °C | 13.7 °C | 22.0 °C | 16.7 °C | 7.8 °C | 50.5 mm | 1.8 mm | — | — |
| May | 33.5 °C | 25.8 °C | 17.0 °C | 27.1 °C | 19.5 °C | 11.3 °C | 20.3 °C | 14.1 °C | 6.0 °C | 26.4 mm | 0.5 mm | — | — |
| June | 31.6 °C | 25.1 °C | 15.7 °C | 25.0 °C | 18.2 °C | 10.1 °C | 19.0 °C | 12.4 °C | 1.5 °C | 30.1 mm | 0.2 mm | — | — |
| July | 32.0 °C | 25.2 °C | 14.1 °C | 23.9 °C | 18.0 °C | 10.4 °C | 19.0 °C | 12.0 °C | 2.5 °C | 19.5 mm | 0.1 mm | — | — |
| August | 34.7 °C | 27.0 °C | 16.6 °C | 28.2 °C | 19.6 °C | 12.2 °C | 20.0 °C | 13.3 °C | 4.4 °C | 21.0 mm | 0.3 mm | — | — |
| September | 38.0 °C | 28.9 °C | 17.5 °C | 29.8 °C | 21.5 °C | 14.0 °C | 23.0 °C | 15.6 °C | 6.0 °C | 30.3 mm | 1.1 mm | — | — |
| October | 38.9 °C | 29.1 °C | 17.0 °C | 29.8 °C | 22.5 °C | 13.2 °C | 23.0 °C | 17.5 °C | 9.2 °C | 111.0 mm | 3.4 mm | — | — |
| November | 39.0 °C | 28.0 °C | 16.2 °C | 30.8 °C | 22.3 °C | 13.1 °C | 24.2 °C | 18.0 °C | 9.9 °C | 81.0 mm | 6.7 mm | — | — |
| December | 37.0 °C | 27.4 °C | 17.0 °C | 29.2 °C | 22.4 °C | 15.7 °C | 23.1 °C | 18.6 °C | 12.2 °C | 111.5 mm | 9.5 mm | — | — |
Data Visualisations
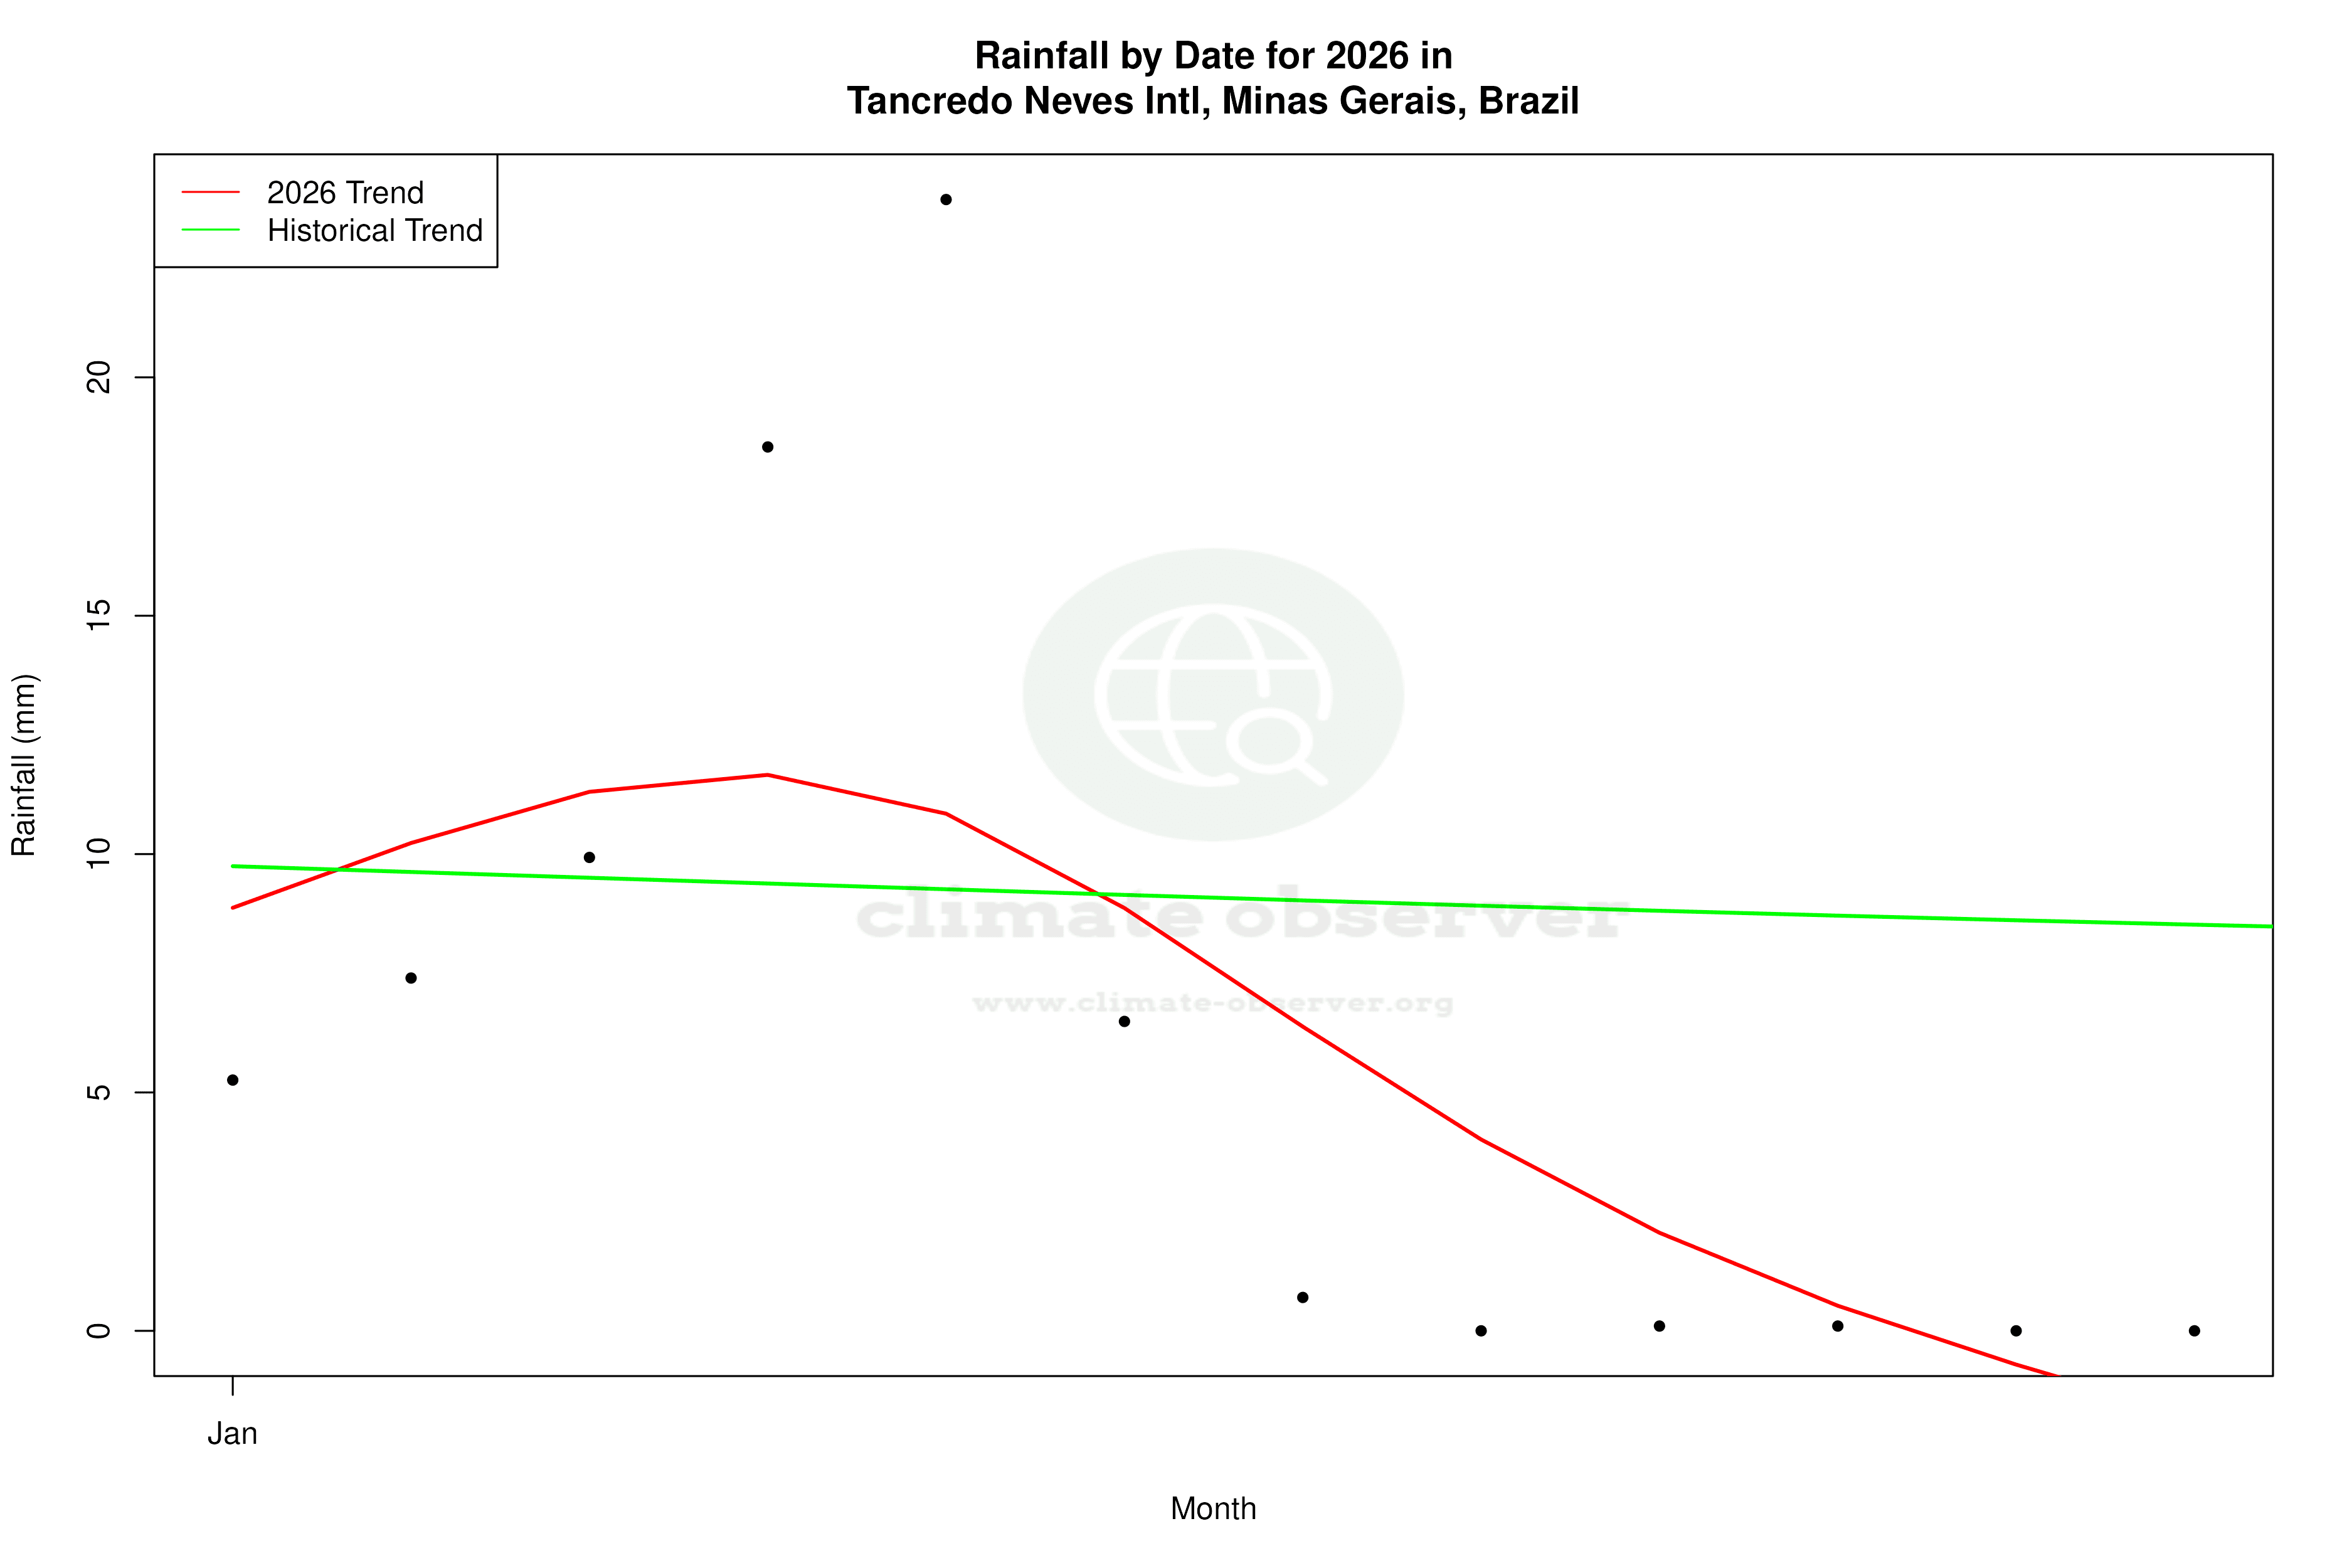
Remove WatermarksCurrent Year Climate Trends vs Historical


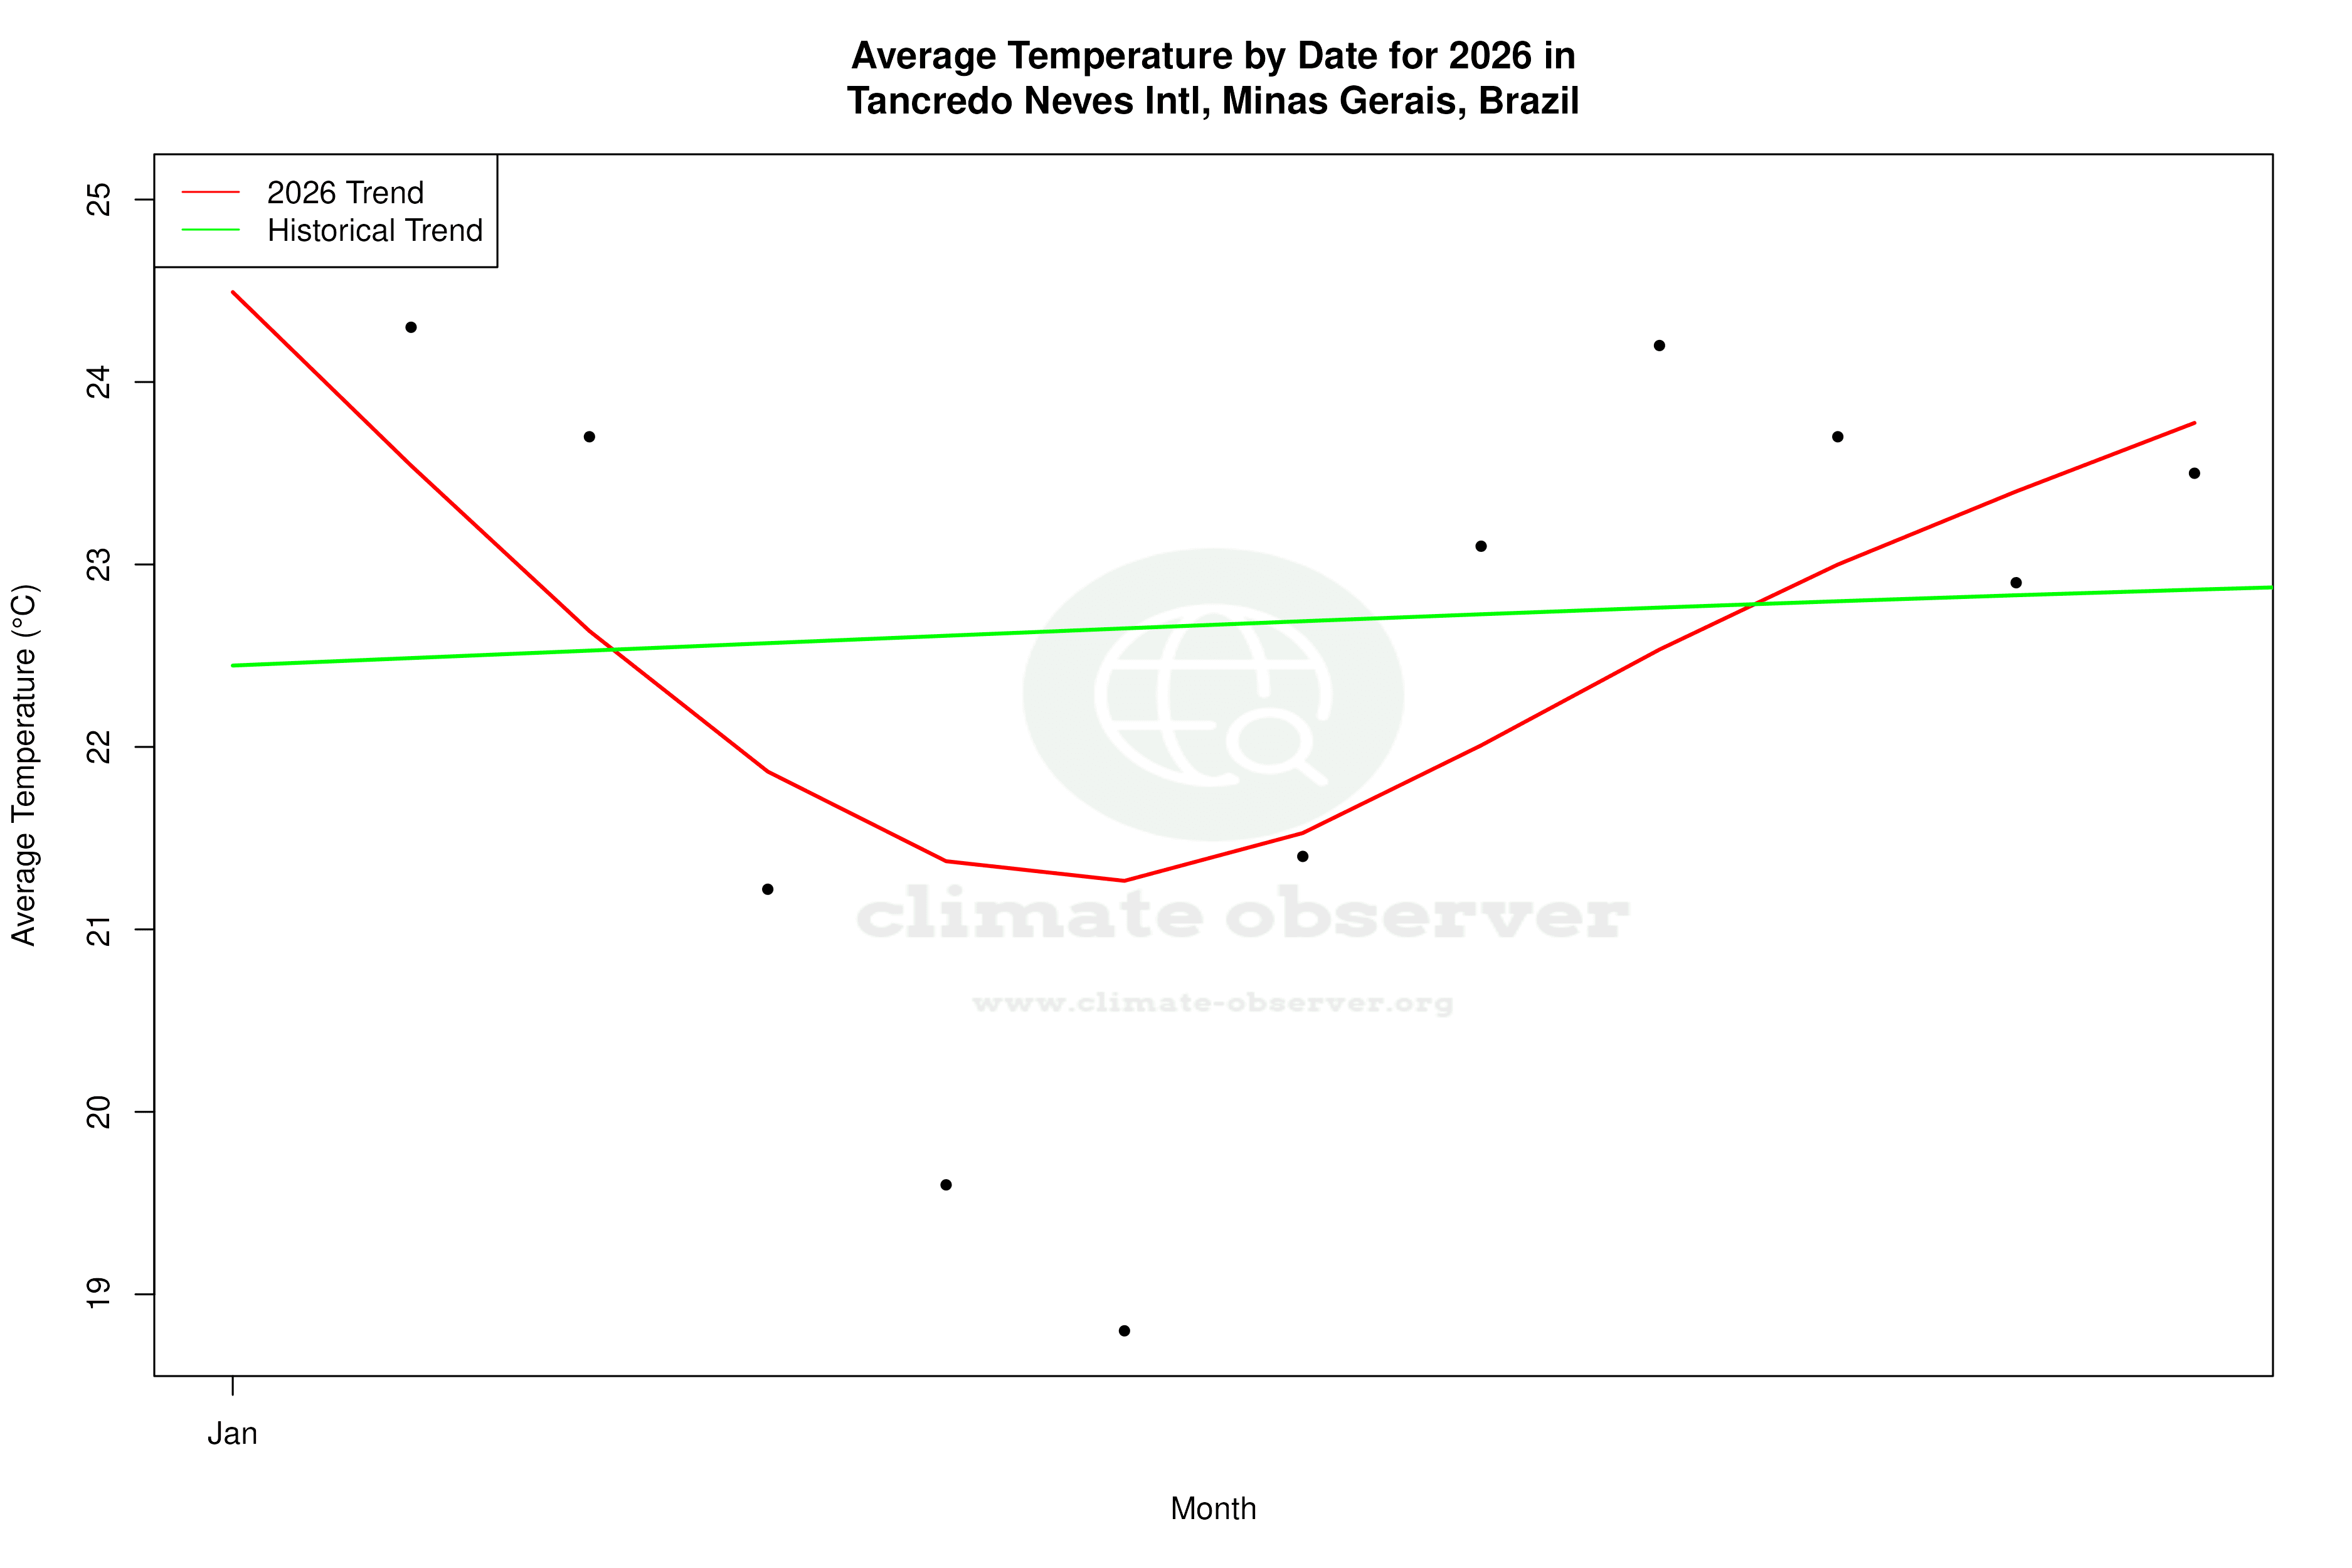


Max Temperature this Year | 1 of 6
Climate 12-Month Moving Averages


Max Temperature 12-Month MA | 1 of 6
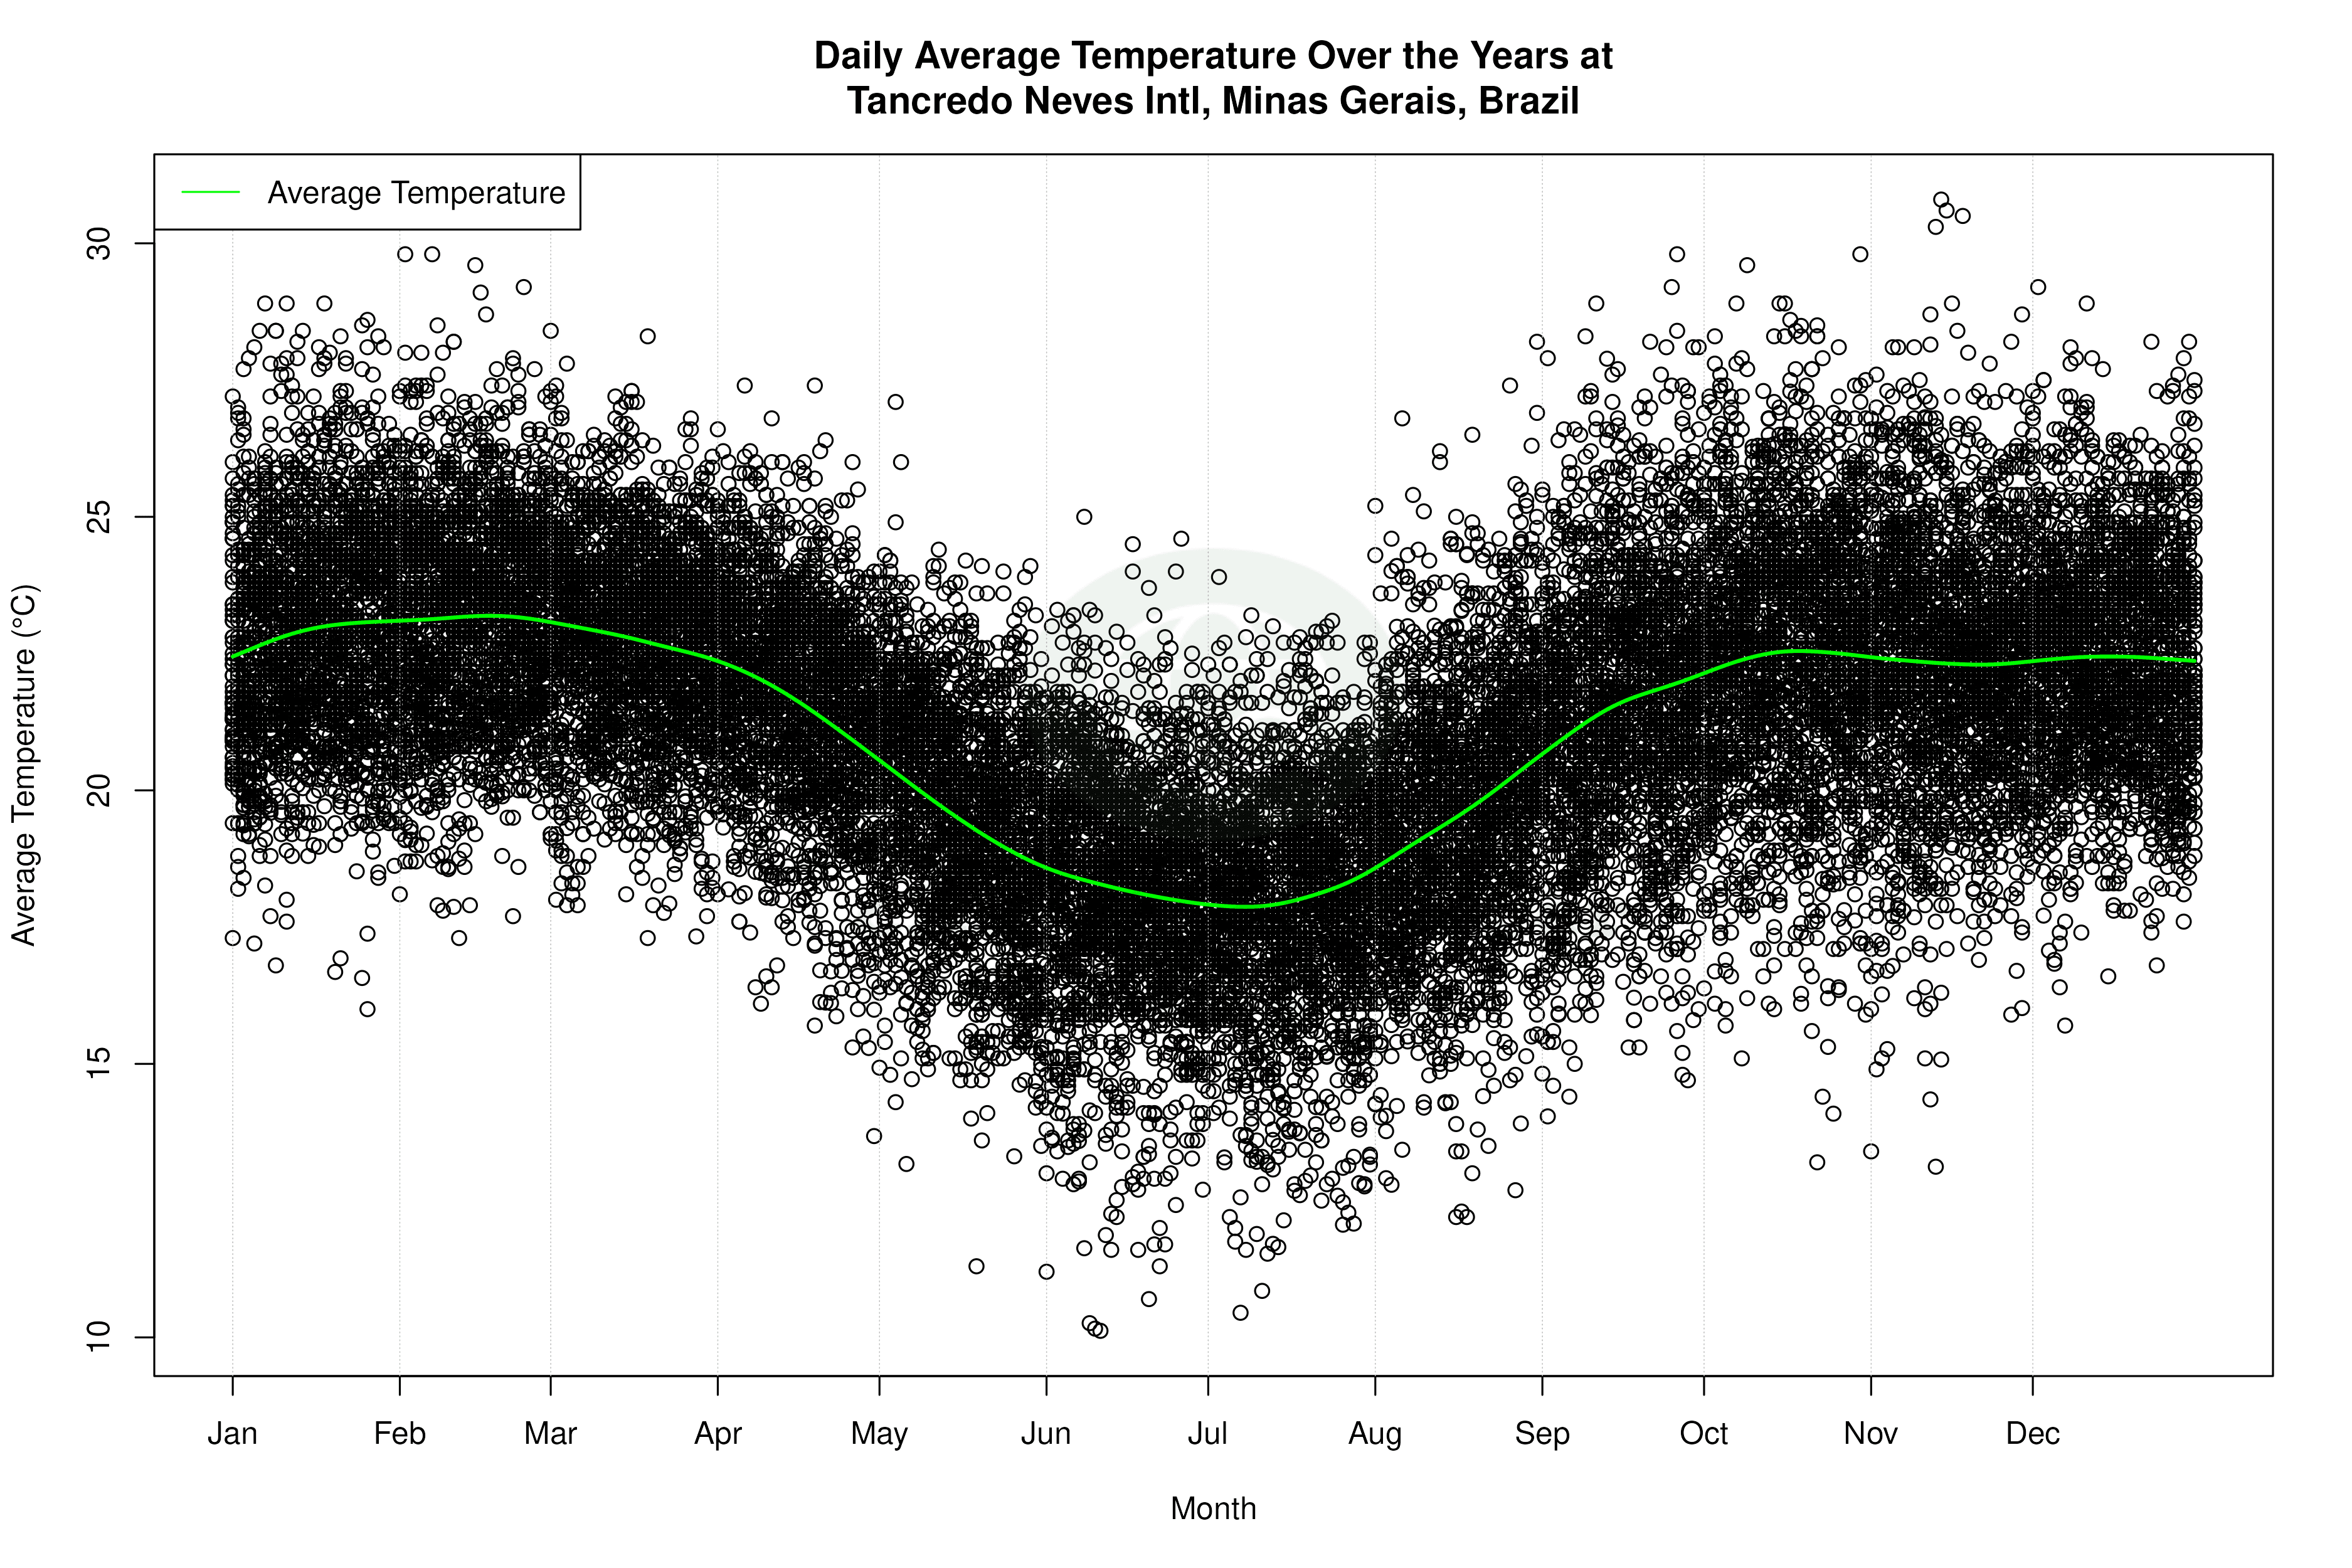
Daily Data Points and Averages Throughout the Year
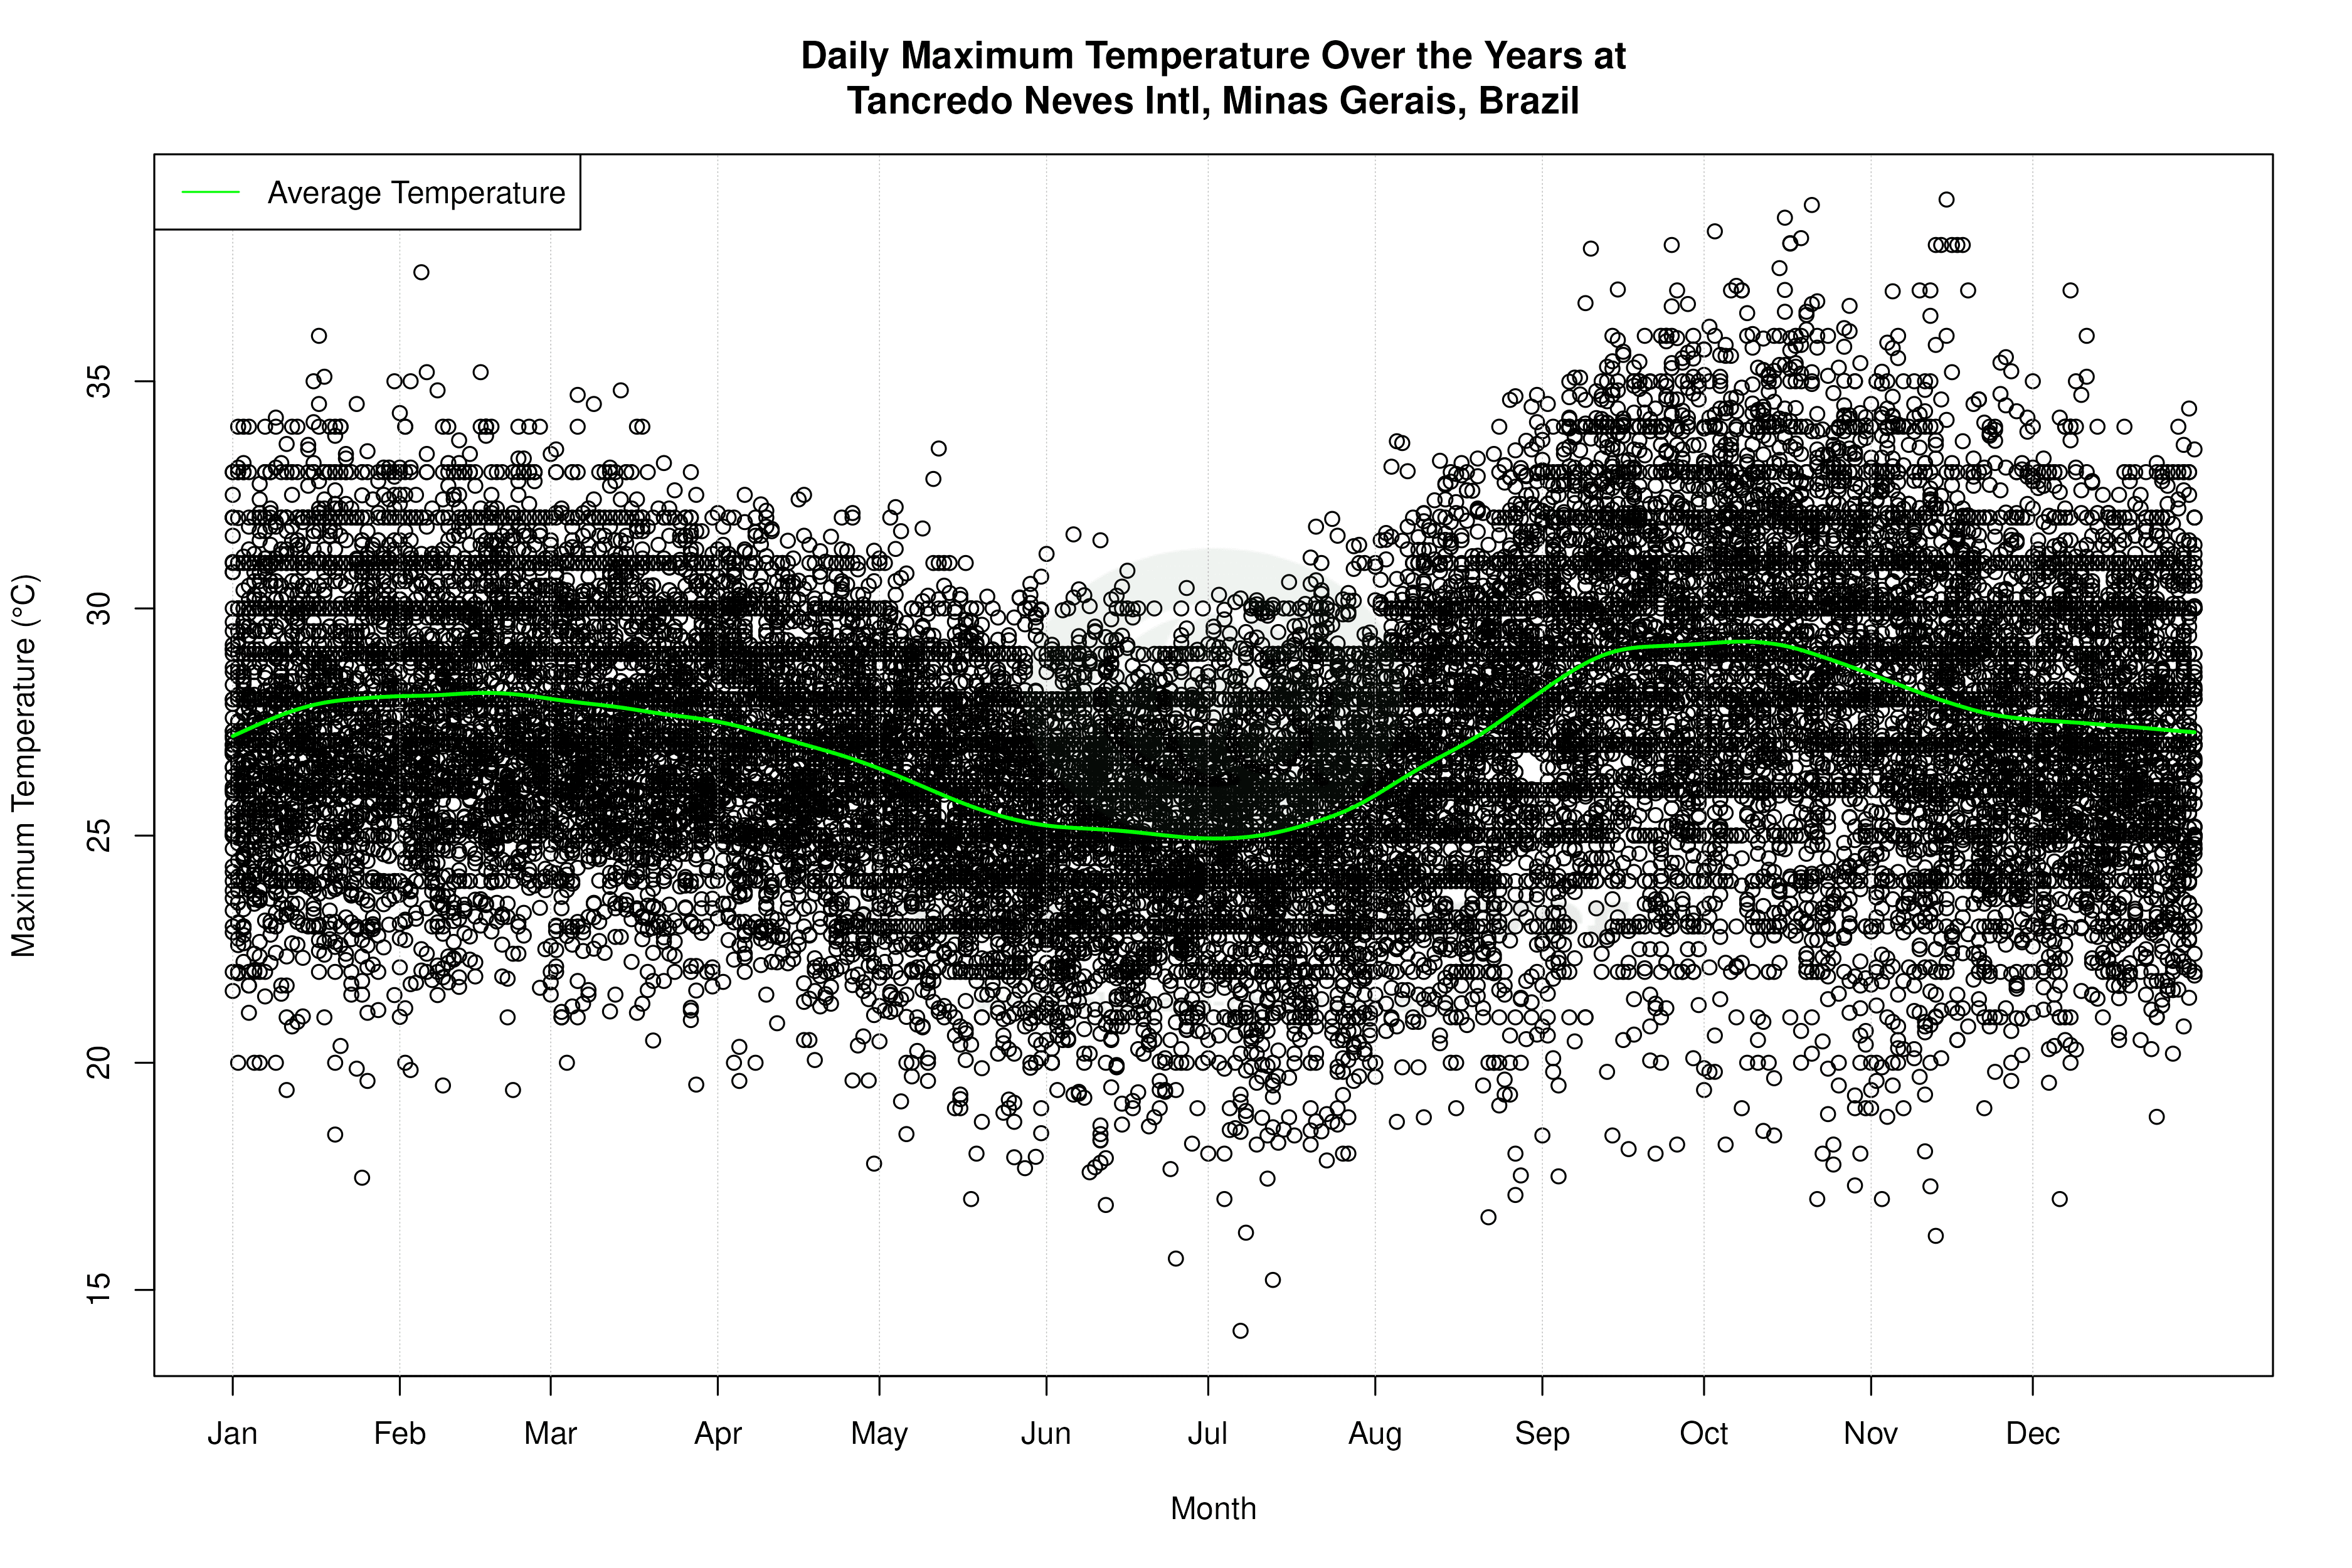


Average Max Temperature Throughout Year | 1 of 5
