Climate for Station: Bartolomeu Lisandro, Rio de Janeiro, Brazil
Loading live weather...
Climate Analysis & Overview
Aeroporto Bartholomeu Lysandro in Campos dos Goytacazes, Brazil, is experiencing a complex climate narrative with a slight all-time warming trend, juxtaposed by recent cooling in high temperatures over the past decade. Precipitation is becoming marginally more evenly distributed, suggesting subtle shifts in local weather patterns.
Subtle Thermal Shifts in the Tropics
Situated in the Southeast of Brazil, Campos dos Goytacazes falls under the Köppen climate classification of Aw, indicating a tropical savanna climate with a distinct dry season. The geographical proximity to the Atlantic Ocean moderates temperatures, yet the region is experiencing nuanced thermal shifts. Over the all-time record, high temperatures have shown a modest warming trend of 0.12°C (0.22°F), while low temperatures have increased by 0.13°C (0.23°F). However, the past decade paints a different picture, with high temperatures experiencing a cooling of 0.57°C (1.03°F), contrasting with a warming trend in low temperatures by 0.89°C (1.60°F). These dynamics suggest a more complex interplay of atmospheric conditions, possibly influenced by regional climatic policies and global weather patterns.
Precipitation Patterns: A Marginal Redistribution
The Precipitation Concentration Index (PCI) at Bartholomeu Lysandro has shown a slight decrease from a baseline of 14.37 to a current value of 14.13. This marginal change indicates that rainfall is becoming slightly more evenly distributed throughout the year. While not a dramatic shift, this could suggest a subtle transition in precipitation events, potentially influenced by broader climatic changes or local environmental policies aimed at managing water resources effectively.
Temperature Extremes: A Record of Resilience
The station's historical temperature records highlight the extremes that the region can experience. The highest recorded temperature is 41.1°C (106.0°F), while the lowest is 6.3°C (43.3°F). These extremes underline the variability inherent in the region's climate, despite the overarching trends. Such records are crucial for understanding potential impacts on agriculture and urban planning, especially as Brazil continues to navigate its climate goals.
Regional Climate Context and Implications
The broader context of Brazil's climate initiatives, which aim to mitigate the impacts of climate change, provides a backdrop to these localised observations. The slight warming trend in lows and the cooling in highs over the past decade may reflect adaptive responses to these initiatives. Moreover, the marginally more even precipitation distribution could be a positive sign for water management strategies in the region. As Brazil continues to strive towards sustainable development, the data from Bartholomeu Lysandro offers valuable insights into the effectiveness of these efforts.
The climate profile of Bartholomeu Lysandro is a testament to the nuanced and evolving nature of regional climate patterns in the face of global environmental challenges.
Station Statistics
10-Year Trend
High: -0.45 °C/decade
Low: +0.95 °C/decade
Rain: -0.71 mm/decade
25-Year Trend
High: +0.25 °C/decade
Low: +0.24 °C/decade
Rain: -0.17 mm/decade
50-Year Trend
High: +0.11 °C/decade
Low: +0.13 °C/decade
Rain: -0.03 mm/decade
All-Time Trend
High: +0.11 °C/decade
Low: +0.13 °C/decade
Rain: -0.03 mm/decade
Percentage Above-Average Days
Last 12 Months: 37.8%
This Year: 34.4%
Precipitation Concentration Index (PCI) ℹ️
Last 12 Months: 12.3
Historical Average: 13.7
Percentile Rank of Last 12 Months ℹ️
High: 29th percentile
Low: 89th percentile
Rain: 16th percentile
Change in Variance ℹ️
High: +10.9%
Low: +18.1%
Intraday: -1.5%
Data Coverage
93.9%
First Year of Data
1973
Station Location
Historical Weather Records
| Max High | Avg High | Min High | Max Avg | Avg Avg | Min Avg | Max Low | Avg Low | Min Low | Max Precipitation | Avg Precipitation | Max Snow | Avg Snow | |
|---|---|---|---|---|---|---|---|---|---|---|---|---|---|
| Record | 41.1 °C | — | 18.6 °C | 34.6 °C | — | 15.5 °C | 26.1 °C | — | 6.3 °C | 150.1 mm | — | — | — |
| January | 39.6 °C | 31.0 °C | 23.1 °C | 34.6 °C | 26.9 °C | 20.8 °C | 26.1 °C | 22.7 °C | 17.0 °C | 112.0 mm | 5.2 mm | — | — |
| February | 39.0 °C | 31.6 °C | 23.1 °C | 32.7 °C | 27.3 °C | 20.3 °C | 26.0 °C | 22.9 °C | 19.0 °C | 59.9 mm | 3.5 mm | — | — |
| March | 38.6 °C | 30.8 °C | 24.0 °C | 31.9 °C | 26.8 °C | 20.8 °C | 26.1 °C | 22.7 °C | 18.0 °C | 67.8 mm | 3.9 mm | — | — |
| April | 37.8 °C | 29.7 °C | 23.0 °C | 31.3 °C | 25.4 °C | 19.8 °C | 25.3 °C | 21.3 °C | 15.0 °C | 150.1 mm | 2.6 mm | — | — |
| May | 36.2 °C | 28.2 °C | 21.4 °C | 31.2 °C | 23.6 °C | 18.2 °C | 24.0 °C | 19.2 °C | 7.7 °C | 45.9 mm | 1.5 mm | — | — |
| June | 34.6 °C | 27.4 °C | 19.3 °C | 28.0 °C | 22.5 °C | 15.5 °C | 22.4 °C | 17.7 °C | 6.3 °C | 43.9 mm | 1.0 mm | — | — |
| July | 35.9 °C | 27.2 °C | 18.6 °C | 28.0 °C | 22.0 °C | 15.9 °C | 21.5 °C | 17.2 °C | 6.6 °C | 24.9 mm | 0.8 mm | — | — |
| August | 36.4 °C | 28.0 °C | 18.6 °C | 29.2 °C | 22.5 °C | 16.7 °C | 22.2 °C | 17.6 °C | 7.2 °C | 35.1 mm | 1.0 mm | — | — |
| September | 39.6 °C | 28.9 °C | 20.2 °C | 29.6 °C | 23.3 °C | 17.3 °C | 23.5 °C | 18.8 °C | 10.6 °C | 59.9 mm | 1.9 mm | — | — |
| October | 41.1 °C | 29.6 °C | 20.5 °C | 32.8 °C | 24.4 °C | 17.8 °C | 25.2 °C | 20.2 °C | 8.9 °C | 70.1 mm | 3.1 mm | — | — |
| November | 40.1 °C | 29.7 °C | 20.5 °C | 32.5 °C | 25.1 °C | 18.2 °C | 25.4 °C | 21.1 °C | 14.1 °C | 80.0 mm | 5.5 mm | — | — |
| December | 39.4 °C | 30.2 °C | 22.6 °C | 33.2 °C | 26.2 °C | 19.8 °C | 25.5 °C | 22.2 °C | 16.2 °C | 79.0 mm | 6.2 mm | — | — |
Data Visualisations
Remove WatermarksCurrent Year Climate Trends vs Historical


Max Temperature this Year | 1 of 6
Climate 12-Month Moving Averages


Max Temperature 12-Month MA | 1 of 6
Daily Data Points and Averages Throughout the Year

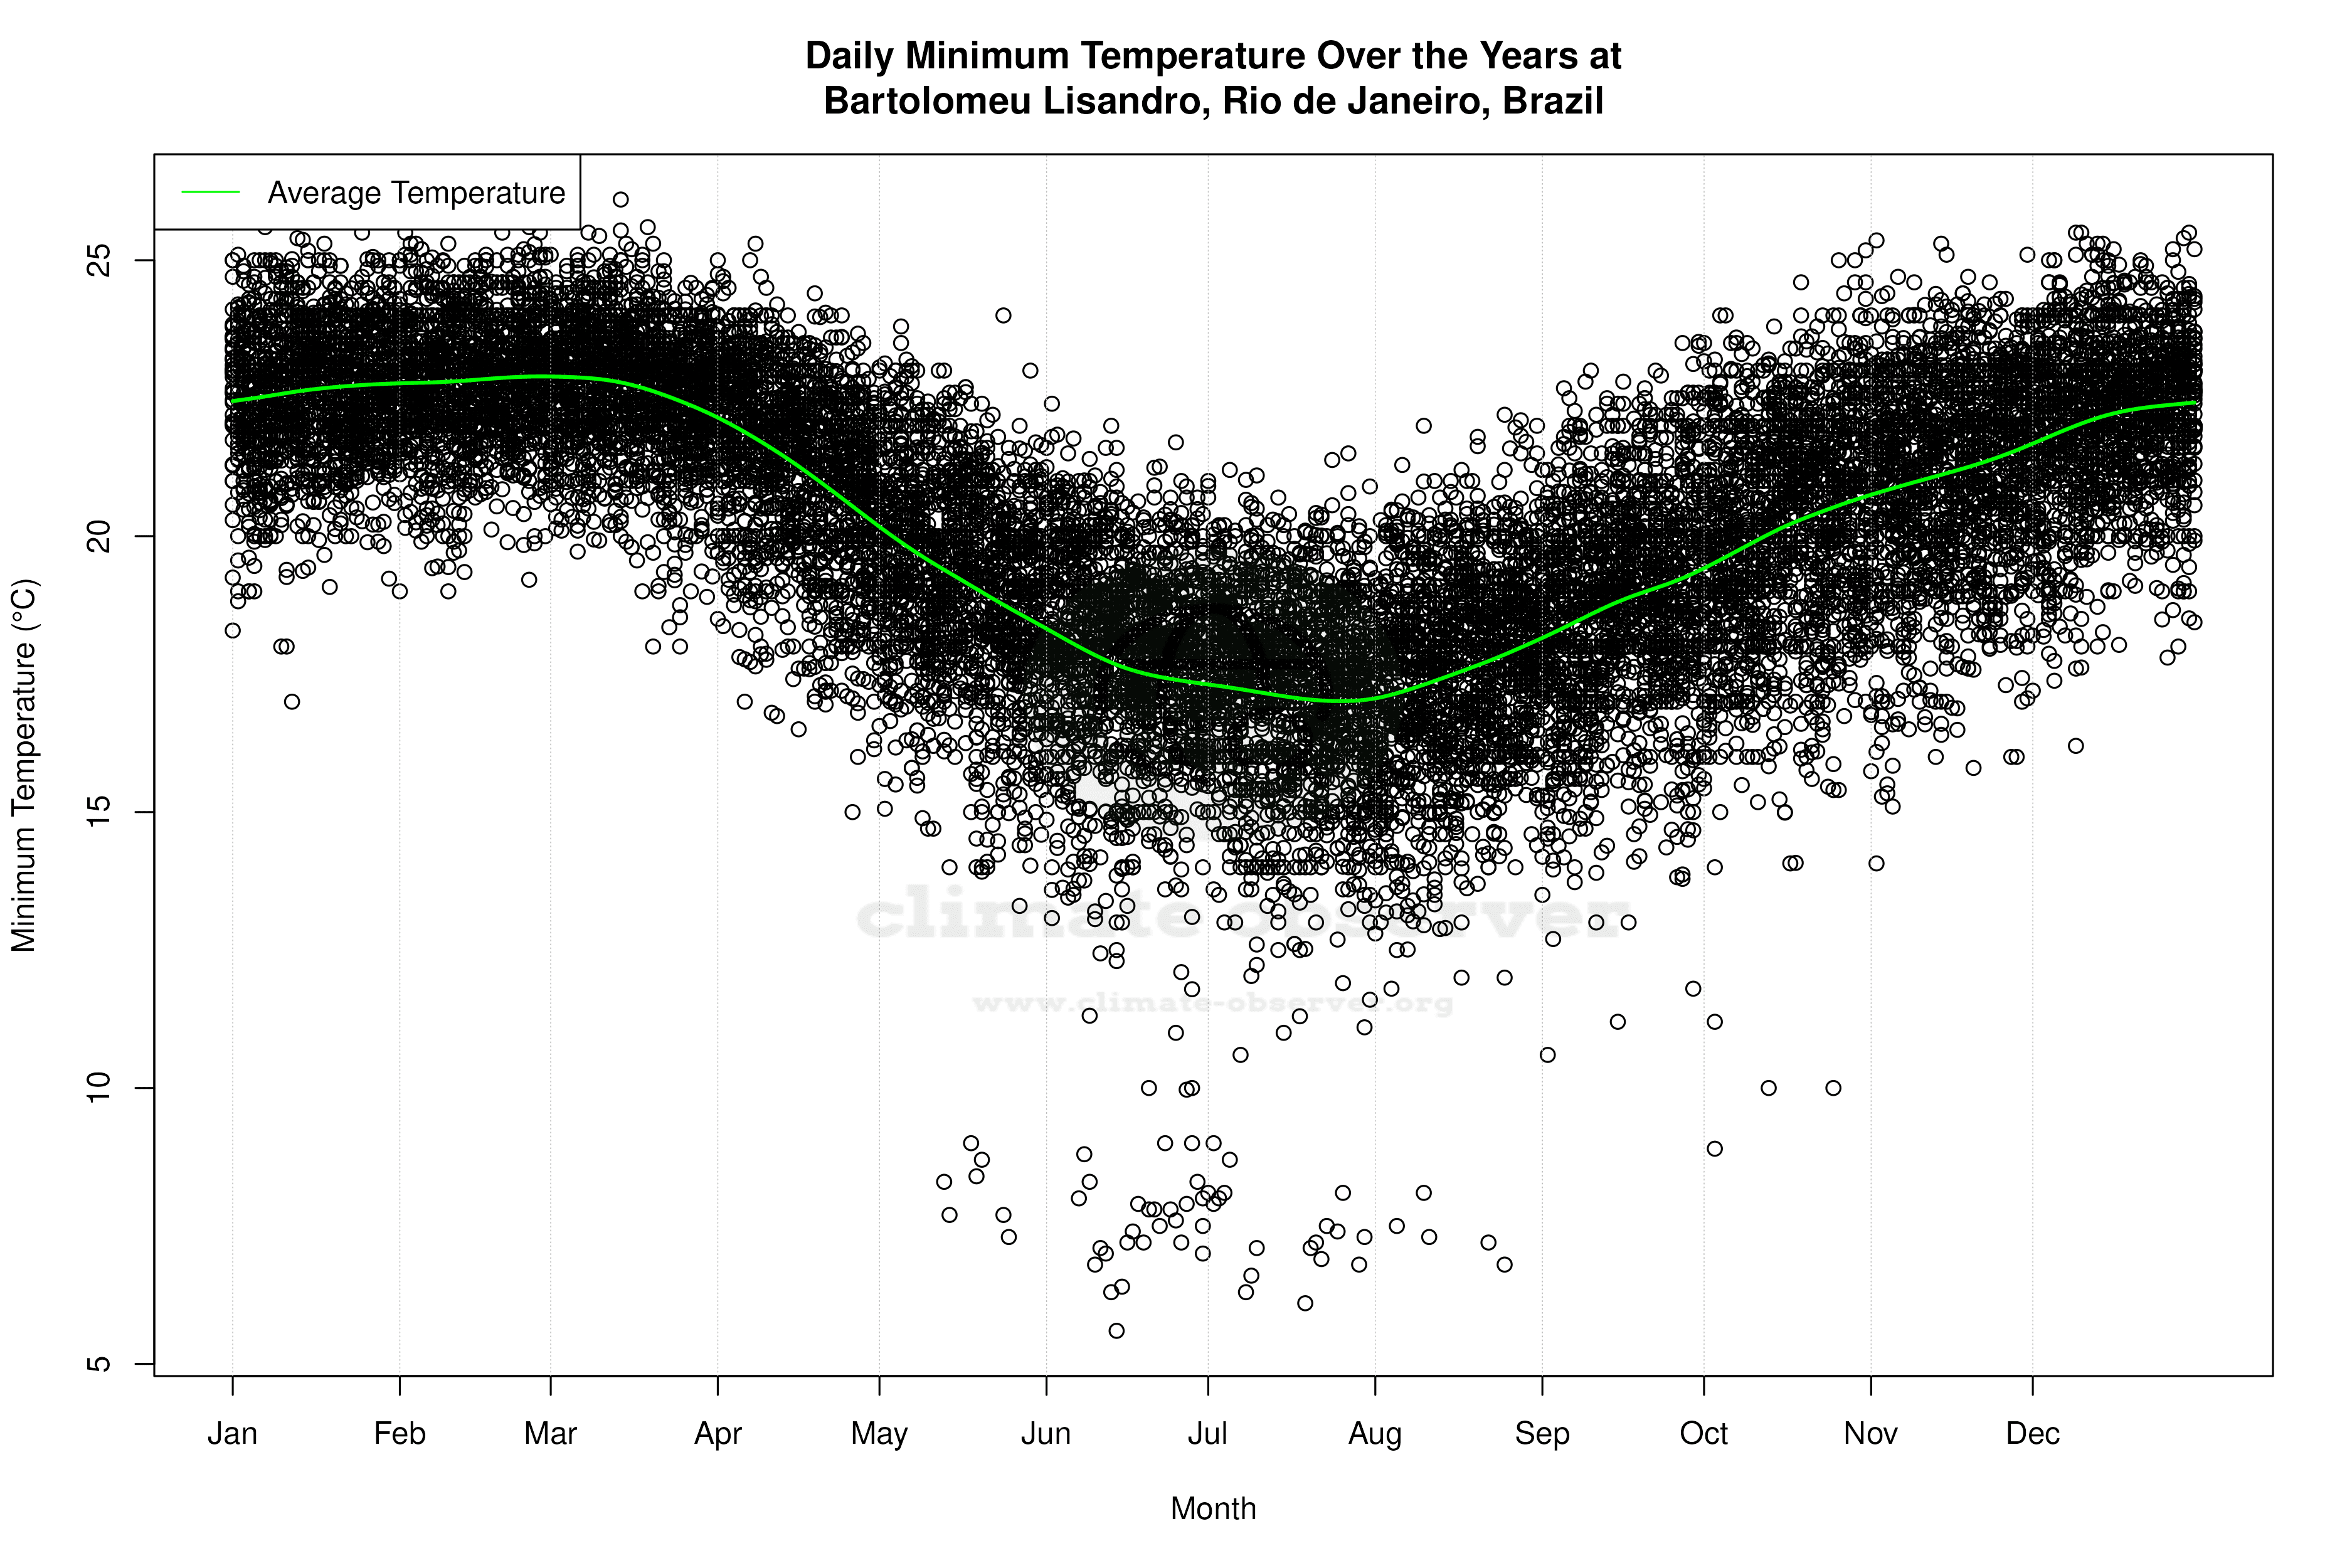


Average Max Temperature Throughout Year | 1 of 5
