Climate for Station: Cataratas Intl, Parana, Brazil
Loading live weather...
Climate Analysis & Overview
The climate at Cataratas International Airport is experiencing a notable warming trend, with recent data showing a more pronounced increase in high temperatures over the past decade compared to historical averages. Precipitation is becoming more evenly distributed, suggesting shifts in regional weather patterns.
Warming Trends and Temperature Extremes
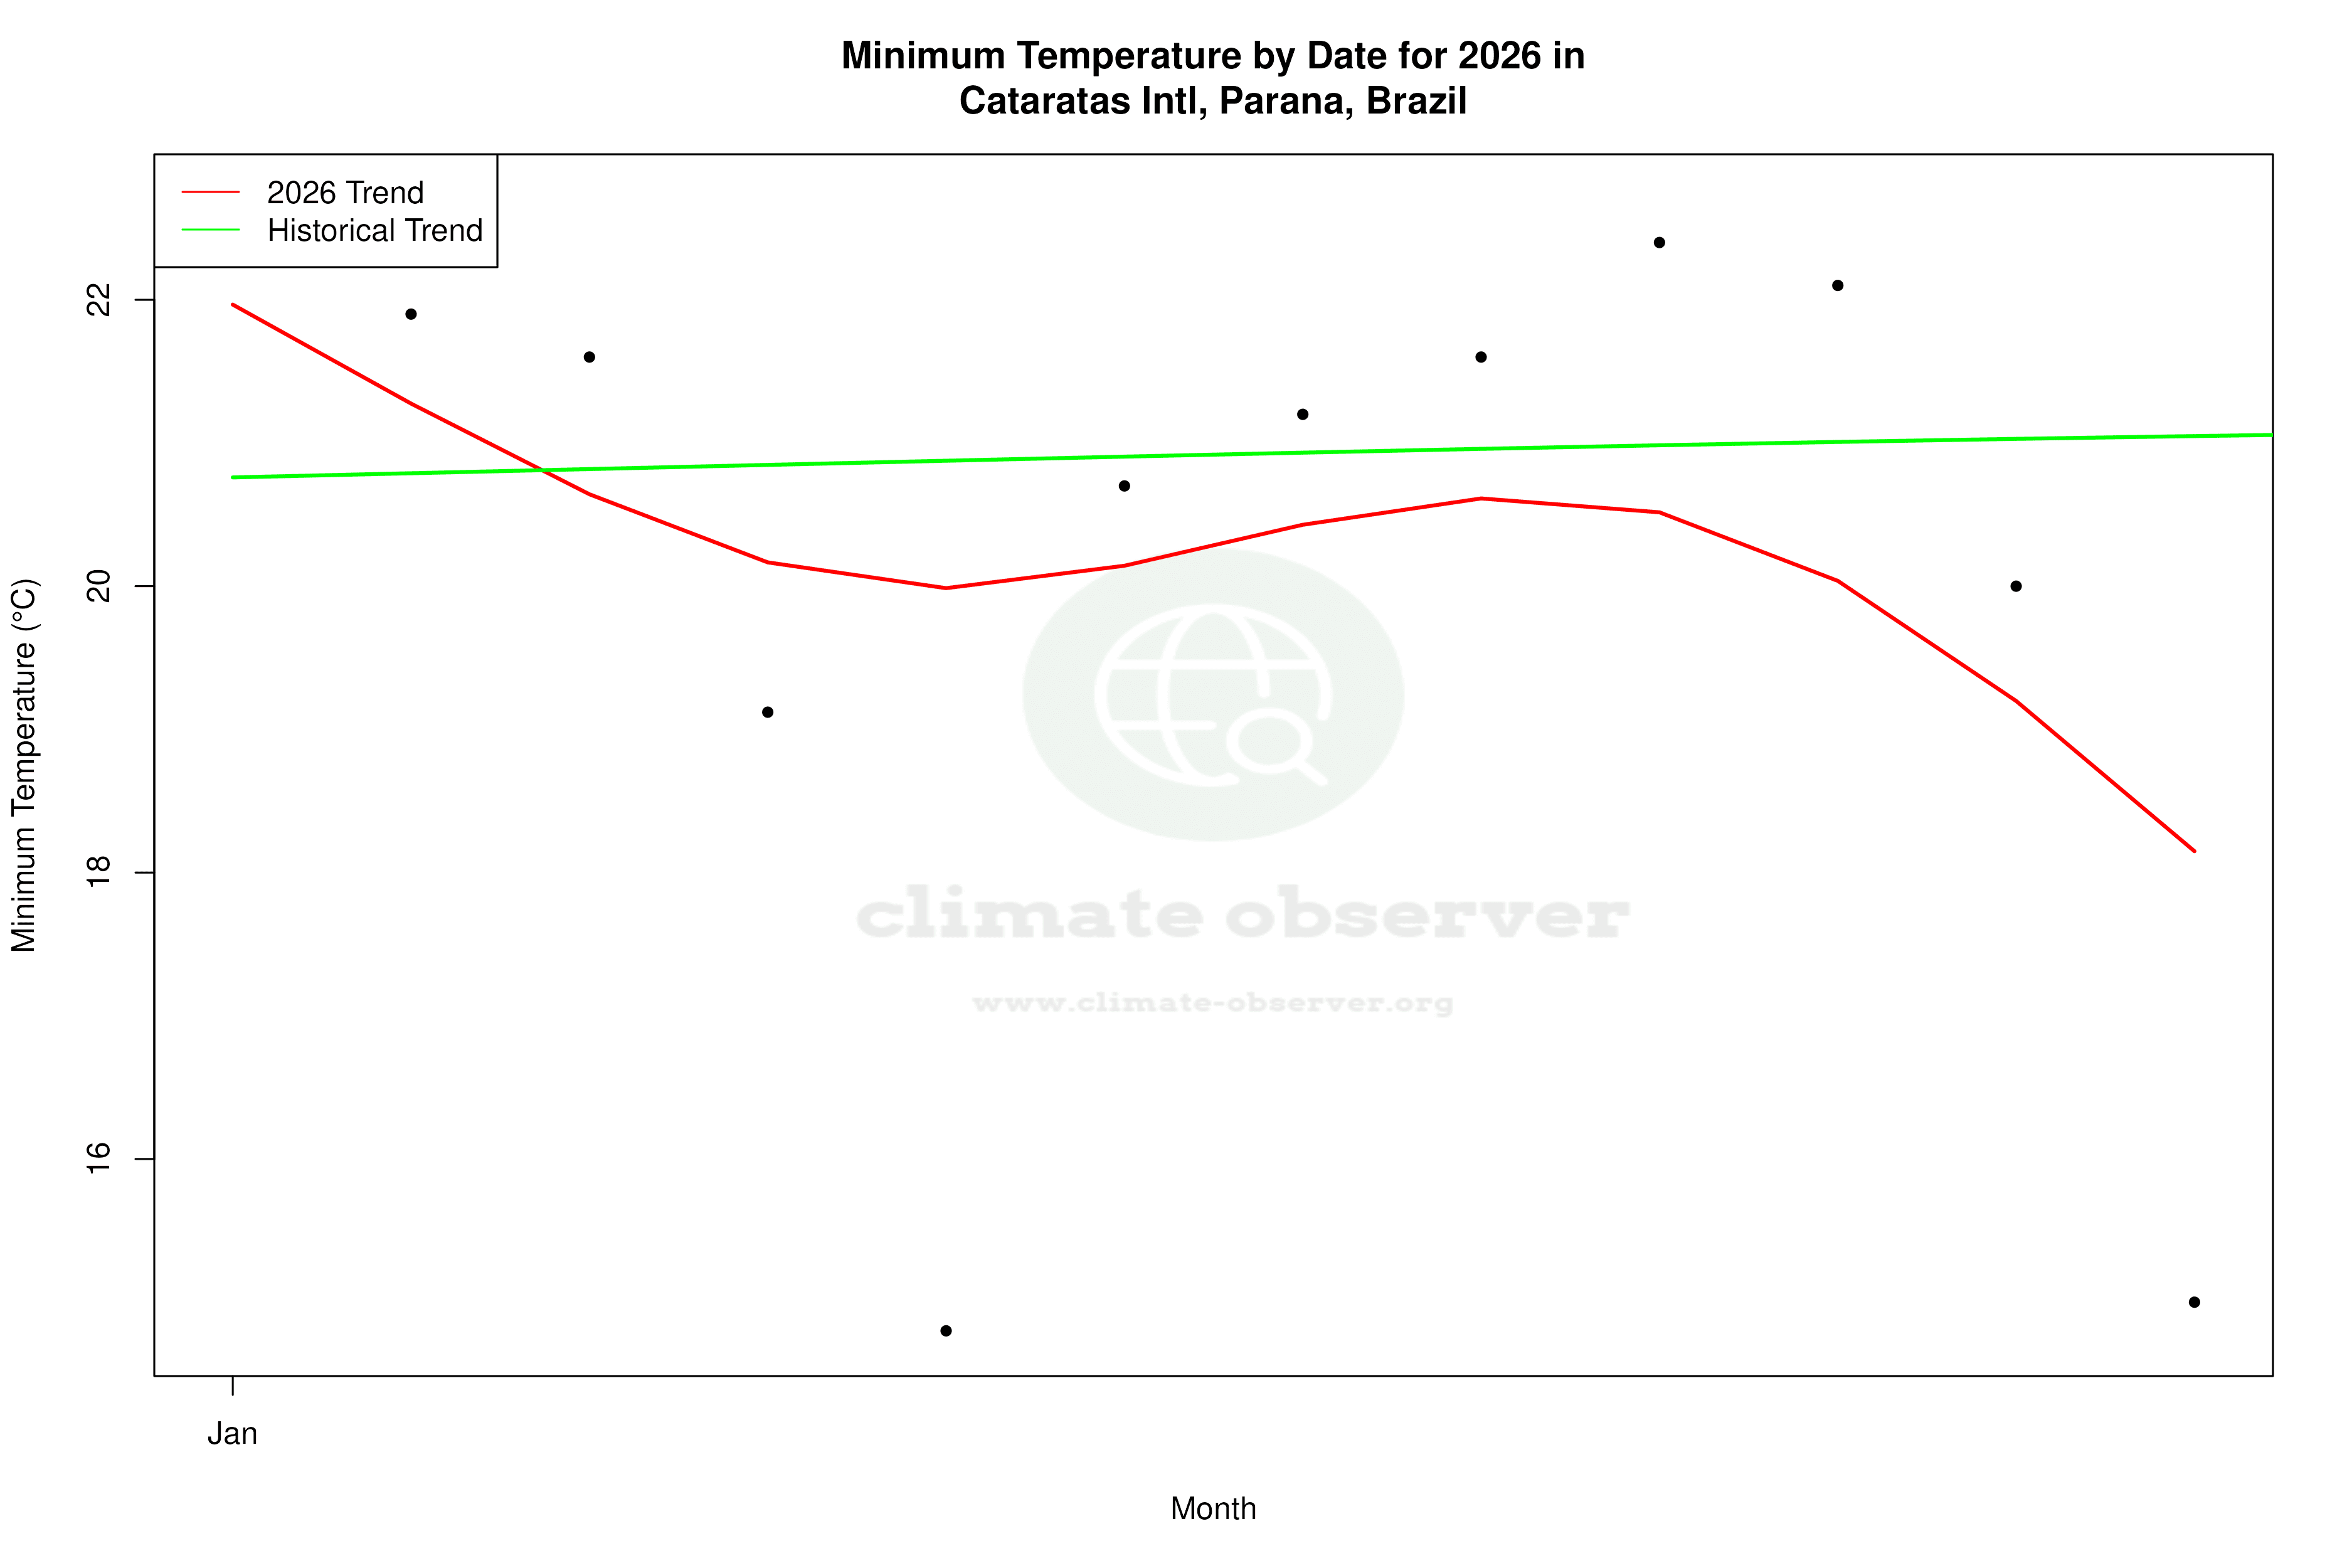
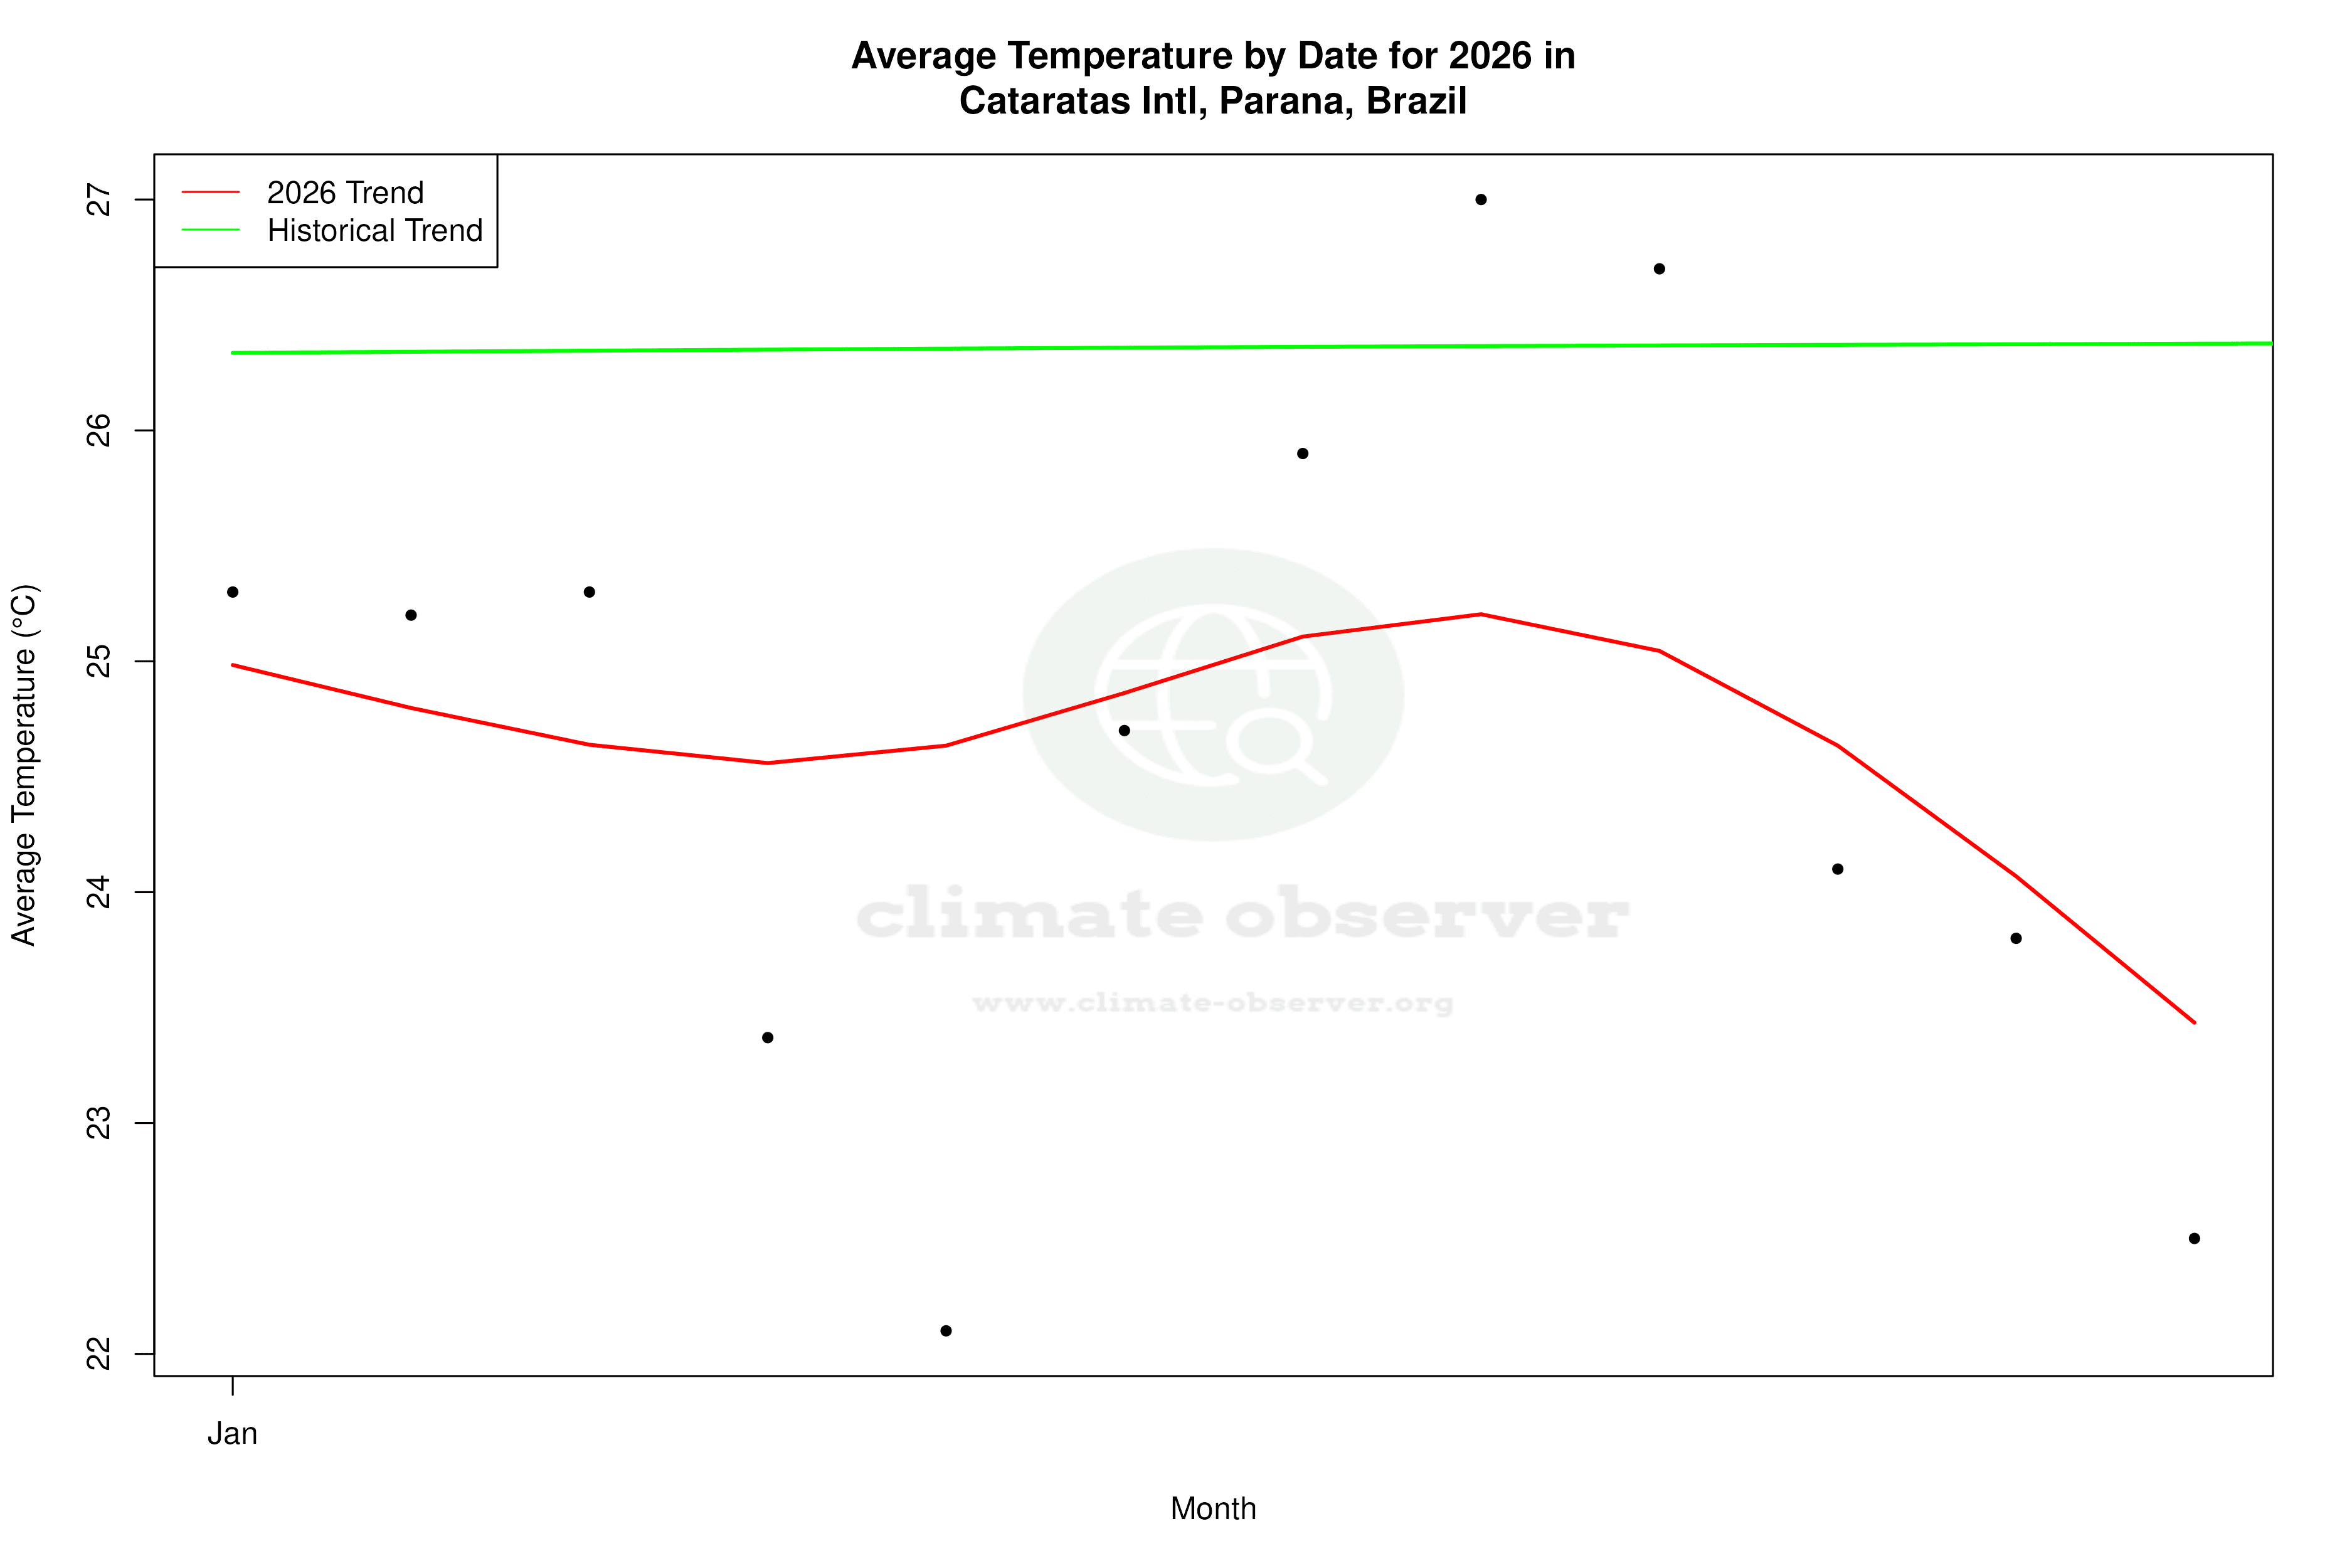
Located in the subtropical region of southern Brazil, Cataratas International Airport is under the influence of a Cfa climate according to the Köppen classification, characterized by humid conditions with hot summers. Over the past decade, the region has seen a significant warming trend, with high temperatures increasing by 1.75°C (3.15°F) and lows rising by 0.83°C (1.49°F). This is more pronounced than the all-time trends, where highs have risen by a modest 0.13°C (0.23°F) and lows by 0.13°C (0.24°F). The highest recorded temperature at this station is 42.38°C (108.28°F), while the lowest is -5.0°C (23.0°F), highlighting the range of thermal extremes the region can experience.
Precipitation Patterns: A More Even Distribution
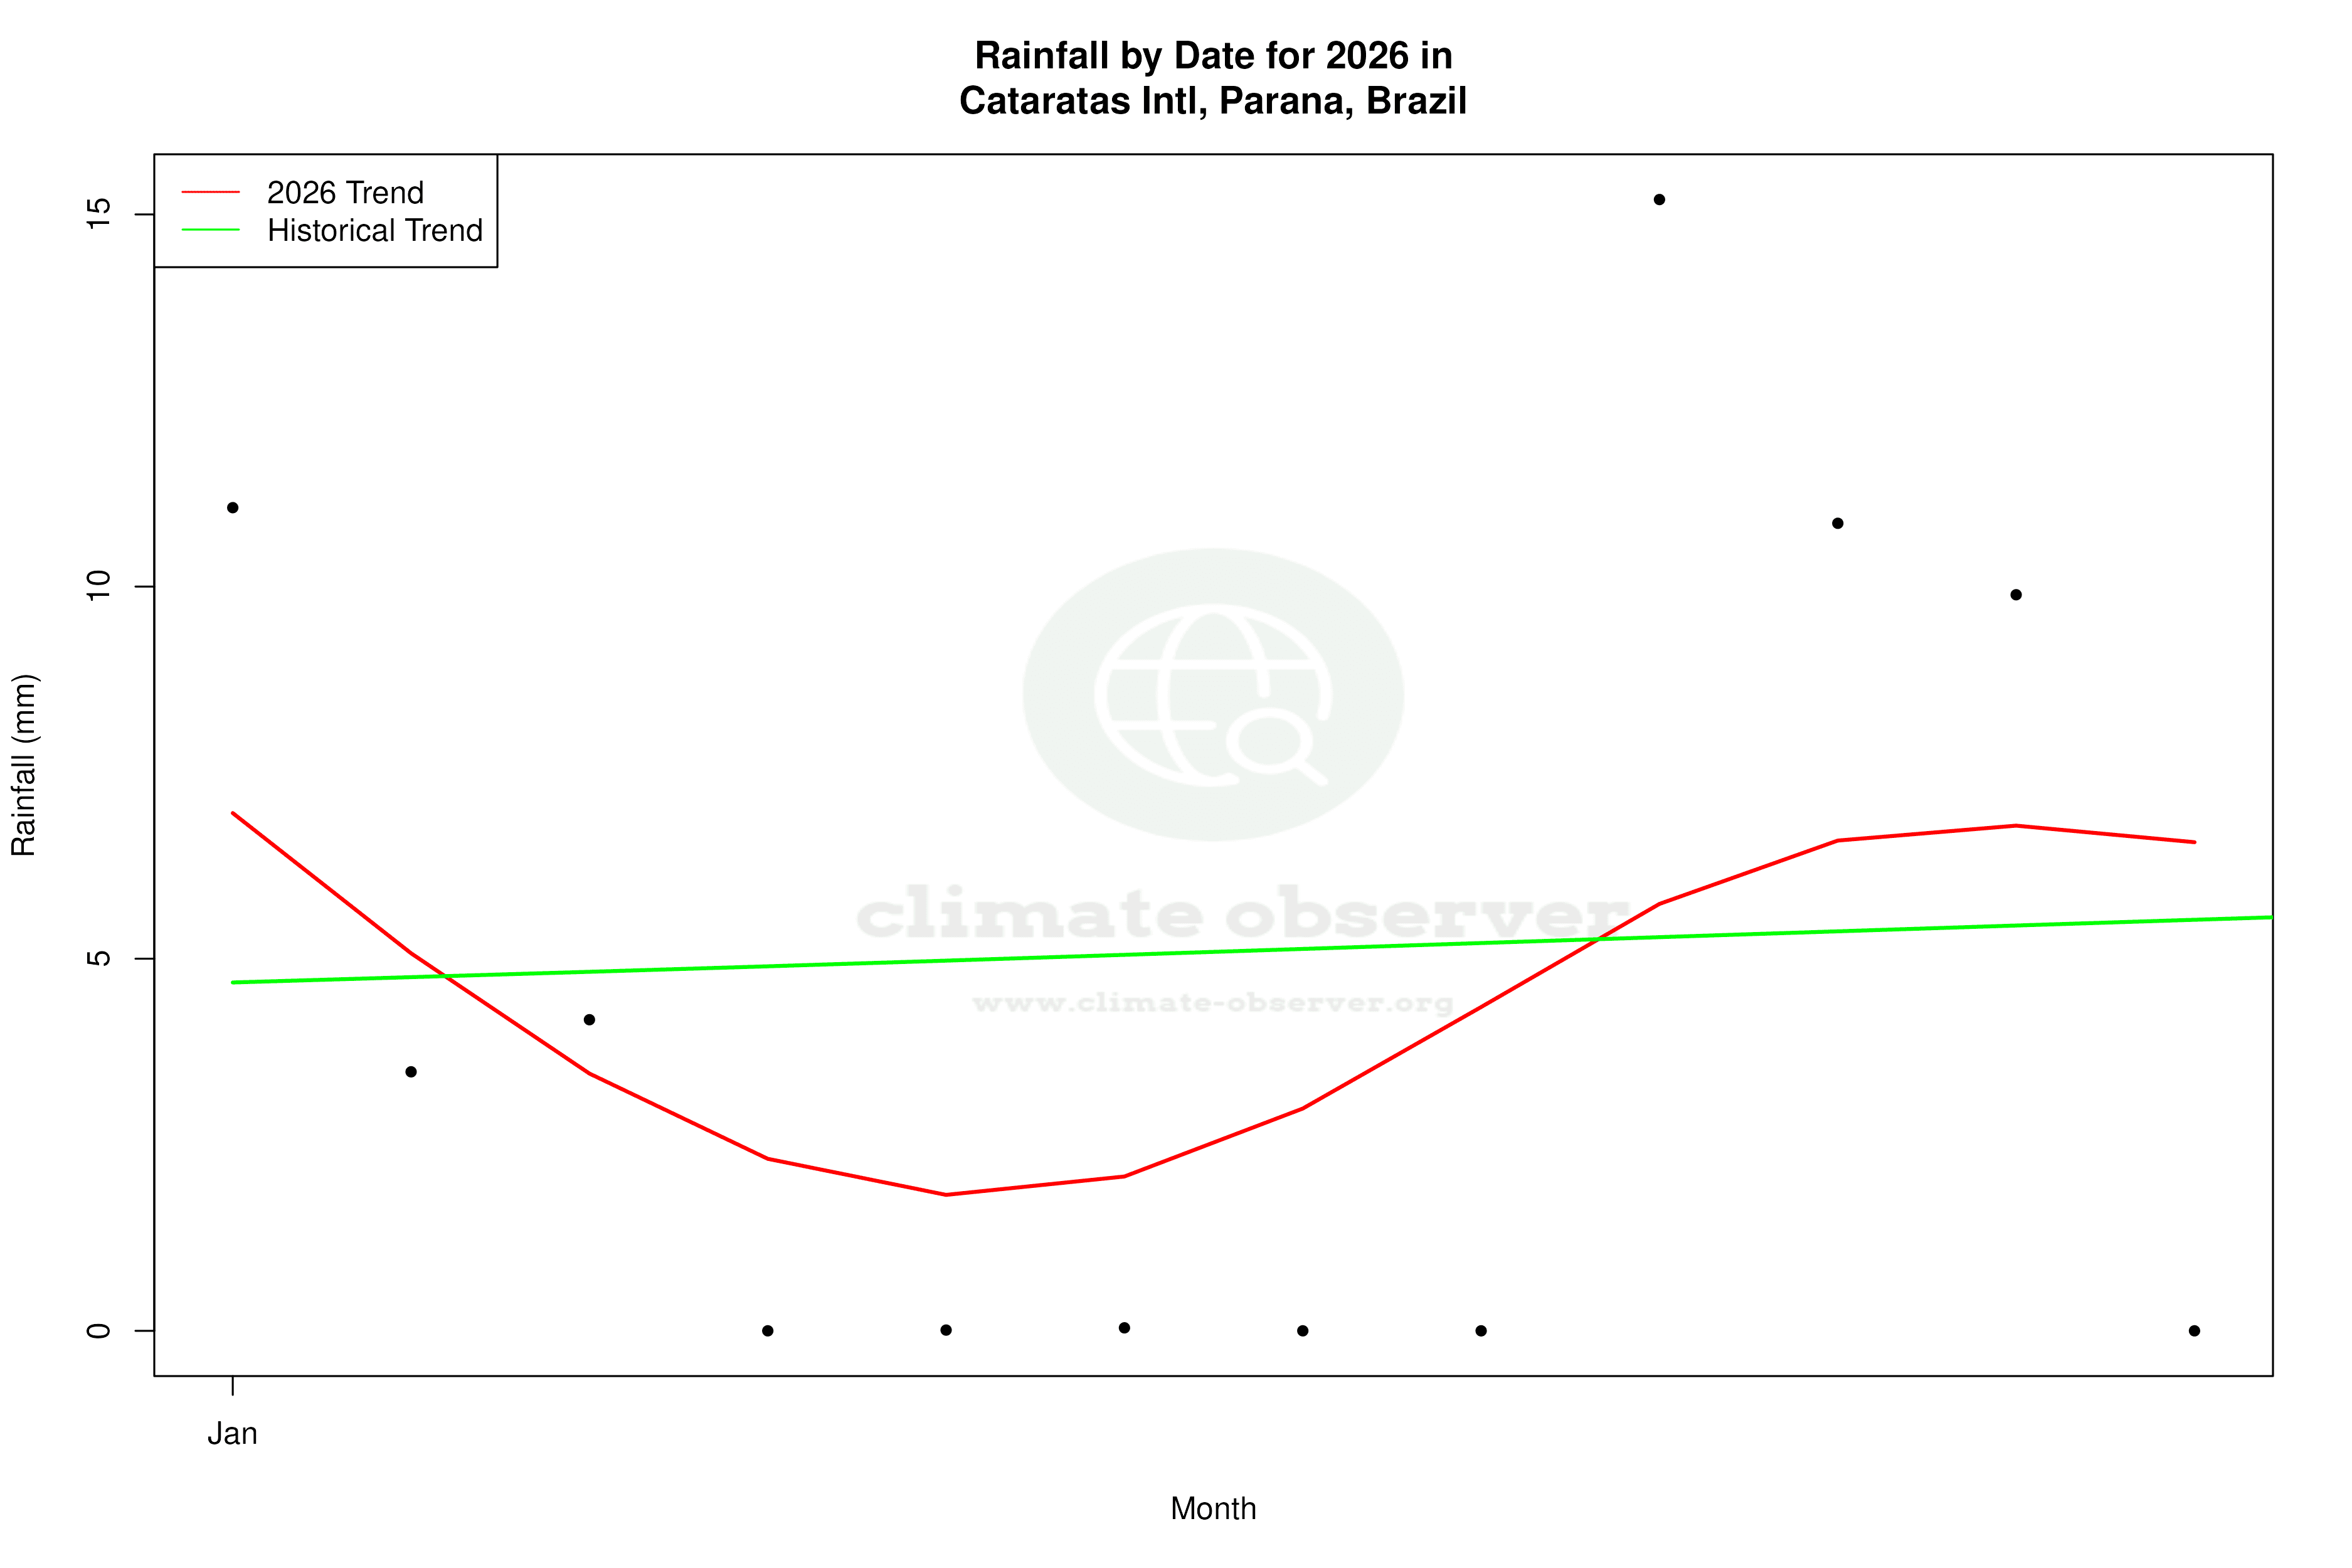
The Precipitation Concentration Index (PCI) provides insights into how rainfall is distributed throughout the year. A decrease from a baseline of 11.92 to a current value of 9.64 indicates a more even distribution of rainfall events. This shift suggests that precipitation is less concentrated in heavy downpours and more spread out across the year, which can have implications for water management and agriculture in the region.
Regional Climate Dynamics
Foz do Iguaçu's geographical position near the confluence of the Iguaçu and Paraná rivers, and its proximity to the famous Iguaçu Falls, plays a significant role in its local climate dynamics. The area's natural features contribute to its humidity and precipitation patterns. The warming trend observed at Cataratas International aligns with broader regional climate goals aimed at understanding and mitigating the impacts of climate change.
Implications for the Future
The observed warming trends and changes in precipitation distribution at Cataratas International Airport reflect broader climatic shifts that are likely to influence local ecosystems and human activities. As Brazil continues to address climate change, understanding these trends is crucial for developing adaptive strategies to manage the impacts on agriculture, water resources, and biodiversity in the region.
Station Statistics
10-Year Trend
High: +1.41 °C/decade
Low: +1.05 °C/decade
Rain: -0.23 mm/decade
25-Year Trend
High: -0.34 °C/decade
Low: +0.24 °C/decade
Rain: +0.34 mm/decade
50-Year Trend
High: +0.11 °C/decade
Low: +0.14 °C/decade
Rain: +0.03 mm/decade
All-Time Trend
High: +0.11 °C/decade
Low: +0.14 °C/decade
Rain: +0.02 mm/decade
Percentage Above-Average Days
Last 12 Months: 49.6%
This Year: 46.8%
Precipitation Concentration Index (PCI) ℹ️
Last 12 Months: 9.6
Historical Average: 11.7
Percentile Rank of Last 12 Months ℹ️
High: 38th percentile
Low: 85th percentile
Rain: 55th percentile
Change in Variance ℹ️
High: +0.4%
Low: -12.6%
Intraday: +6.7%
Data Coverage
74.6%
First Year of Data
1953
Station Location
Historical Weather Records
| Max High | Avg High | Min High | Max Avg | Avg Avg | Min Avg | Max Low | Avg Low | Min Low | Max Precipitation | Avg Precipitation | Max Snow | Avg Snow | |
|---|---|---|---|---|---|---|---|---|---|---|---|---|---|
| Record | 42.4 °C | — | 8.0 °C | 34.8 °C | — | 2.1 °C | 29.0 °C | — | -5.0 °C | 172.0 mm | — | — | — |
| January | 40.1 °C | 32.7 °C | 24.0 °C | 34.8 °C | 26.4 °C | 18.3 °C | 28.0 °C | 21.1 °C | 11.0 °C | 142.0 mm | 5.7 mm | — | — |
| February | 39.6 °C | 32.0 °C | 22.0 °C | 32.8 °C | 26.0 °C | 16.8 °C | 26.6 °C | 20.9 °C | 12.0 °C | 140.0 mm | 5.5 mm | — | — |
| March | 40.0 °C | 31.5 °C | 21.2 °C | 32.6 °C | 24.9 °C | 13.9 °C | 27.0 °C | 19.8 °C | 7.0 °C | 117.0 mm | 4.5 mm | — | — |
| April | 39.0 °C | 28.6 °C | 14.0 °C | 29.9 °C | 22.2 °C | 7.2 °C | 25.8 °C | 17.2 °C | 1.0 °C | 161.4 mm | 5.1 mm | — | — |
| May | 35.2 °C | 24.5 °C | 12.0 °C | 29.1 °C | 18.5 °C | 6.3 °C | 24.5 °C | 13.7 °C | -2.2 °C | 172.0 mm | 5.2 mm | — | — |
| June | 32.4 °C | 22.8 °C | 10.1 °C | 26.3 °C | 16.9 °C | 4.3 °C | 23.6 °C | 12.1 °C | -2.0 °C | 93.7 mm | 4.5 mm | — | — |
| July | 32.0 °C | 23.1 °C | 8.0 °C | 29.0 °C | 16.7 °C | 2.1 °C | 23.0 °C | 11.4 °C | -5.0 °C | 87.1 mm | 3.0 mm | — | — |
| August | 38.8 °C | 25.7 °C | 9.0 °C | 30.7 °C | 18.6 °C | 4.3 °C | 23.6 °C | 12.7 °C | -5.0 °C | 132.2 mm | 3.3 mm | — | — |
| September | 40.0 °C | 27.5 °C | 10.8 °C | 30.8 °C | 20.5 °C | 7.1 °C | 25.0 °C | 14.5 °C | -1.7 °C | 123.7 mm | 4.7 mm | — | — |
| October | 40.0 °C | 29.3 °C | 15.1 °C | 32.3 °C | 22.7 °C | 12.3 °C | 25.8 °C | 17.0 °C | 1.0 °C | 167.7 mm | 7.2 mm | — | — |
| November | 41.3 °C | 30.9 °C | 19.2 °C | 33.9 °C | 24.2 °C | 13.6 °C | 26.2 °C | 18.2 °C | 5.6 °C | 109.8 mm | 5.8 mm | — | — |
| December | 42.4 °C | 32.1 °C | 21.0 °C | 32.7 °C | 25.8 °C | 16.6 °C | 29.0 °C | 20.1 °C | 9.4 °C | 112.0 mm | 5.9 mm | — | — |
Data Visualisations
Remove WatermarksCurrent Year Climate Trends vs Historical


Max Temperature this Year | 1 of 6
Climate 12-Month Moving Averages

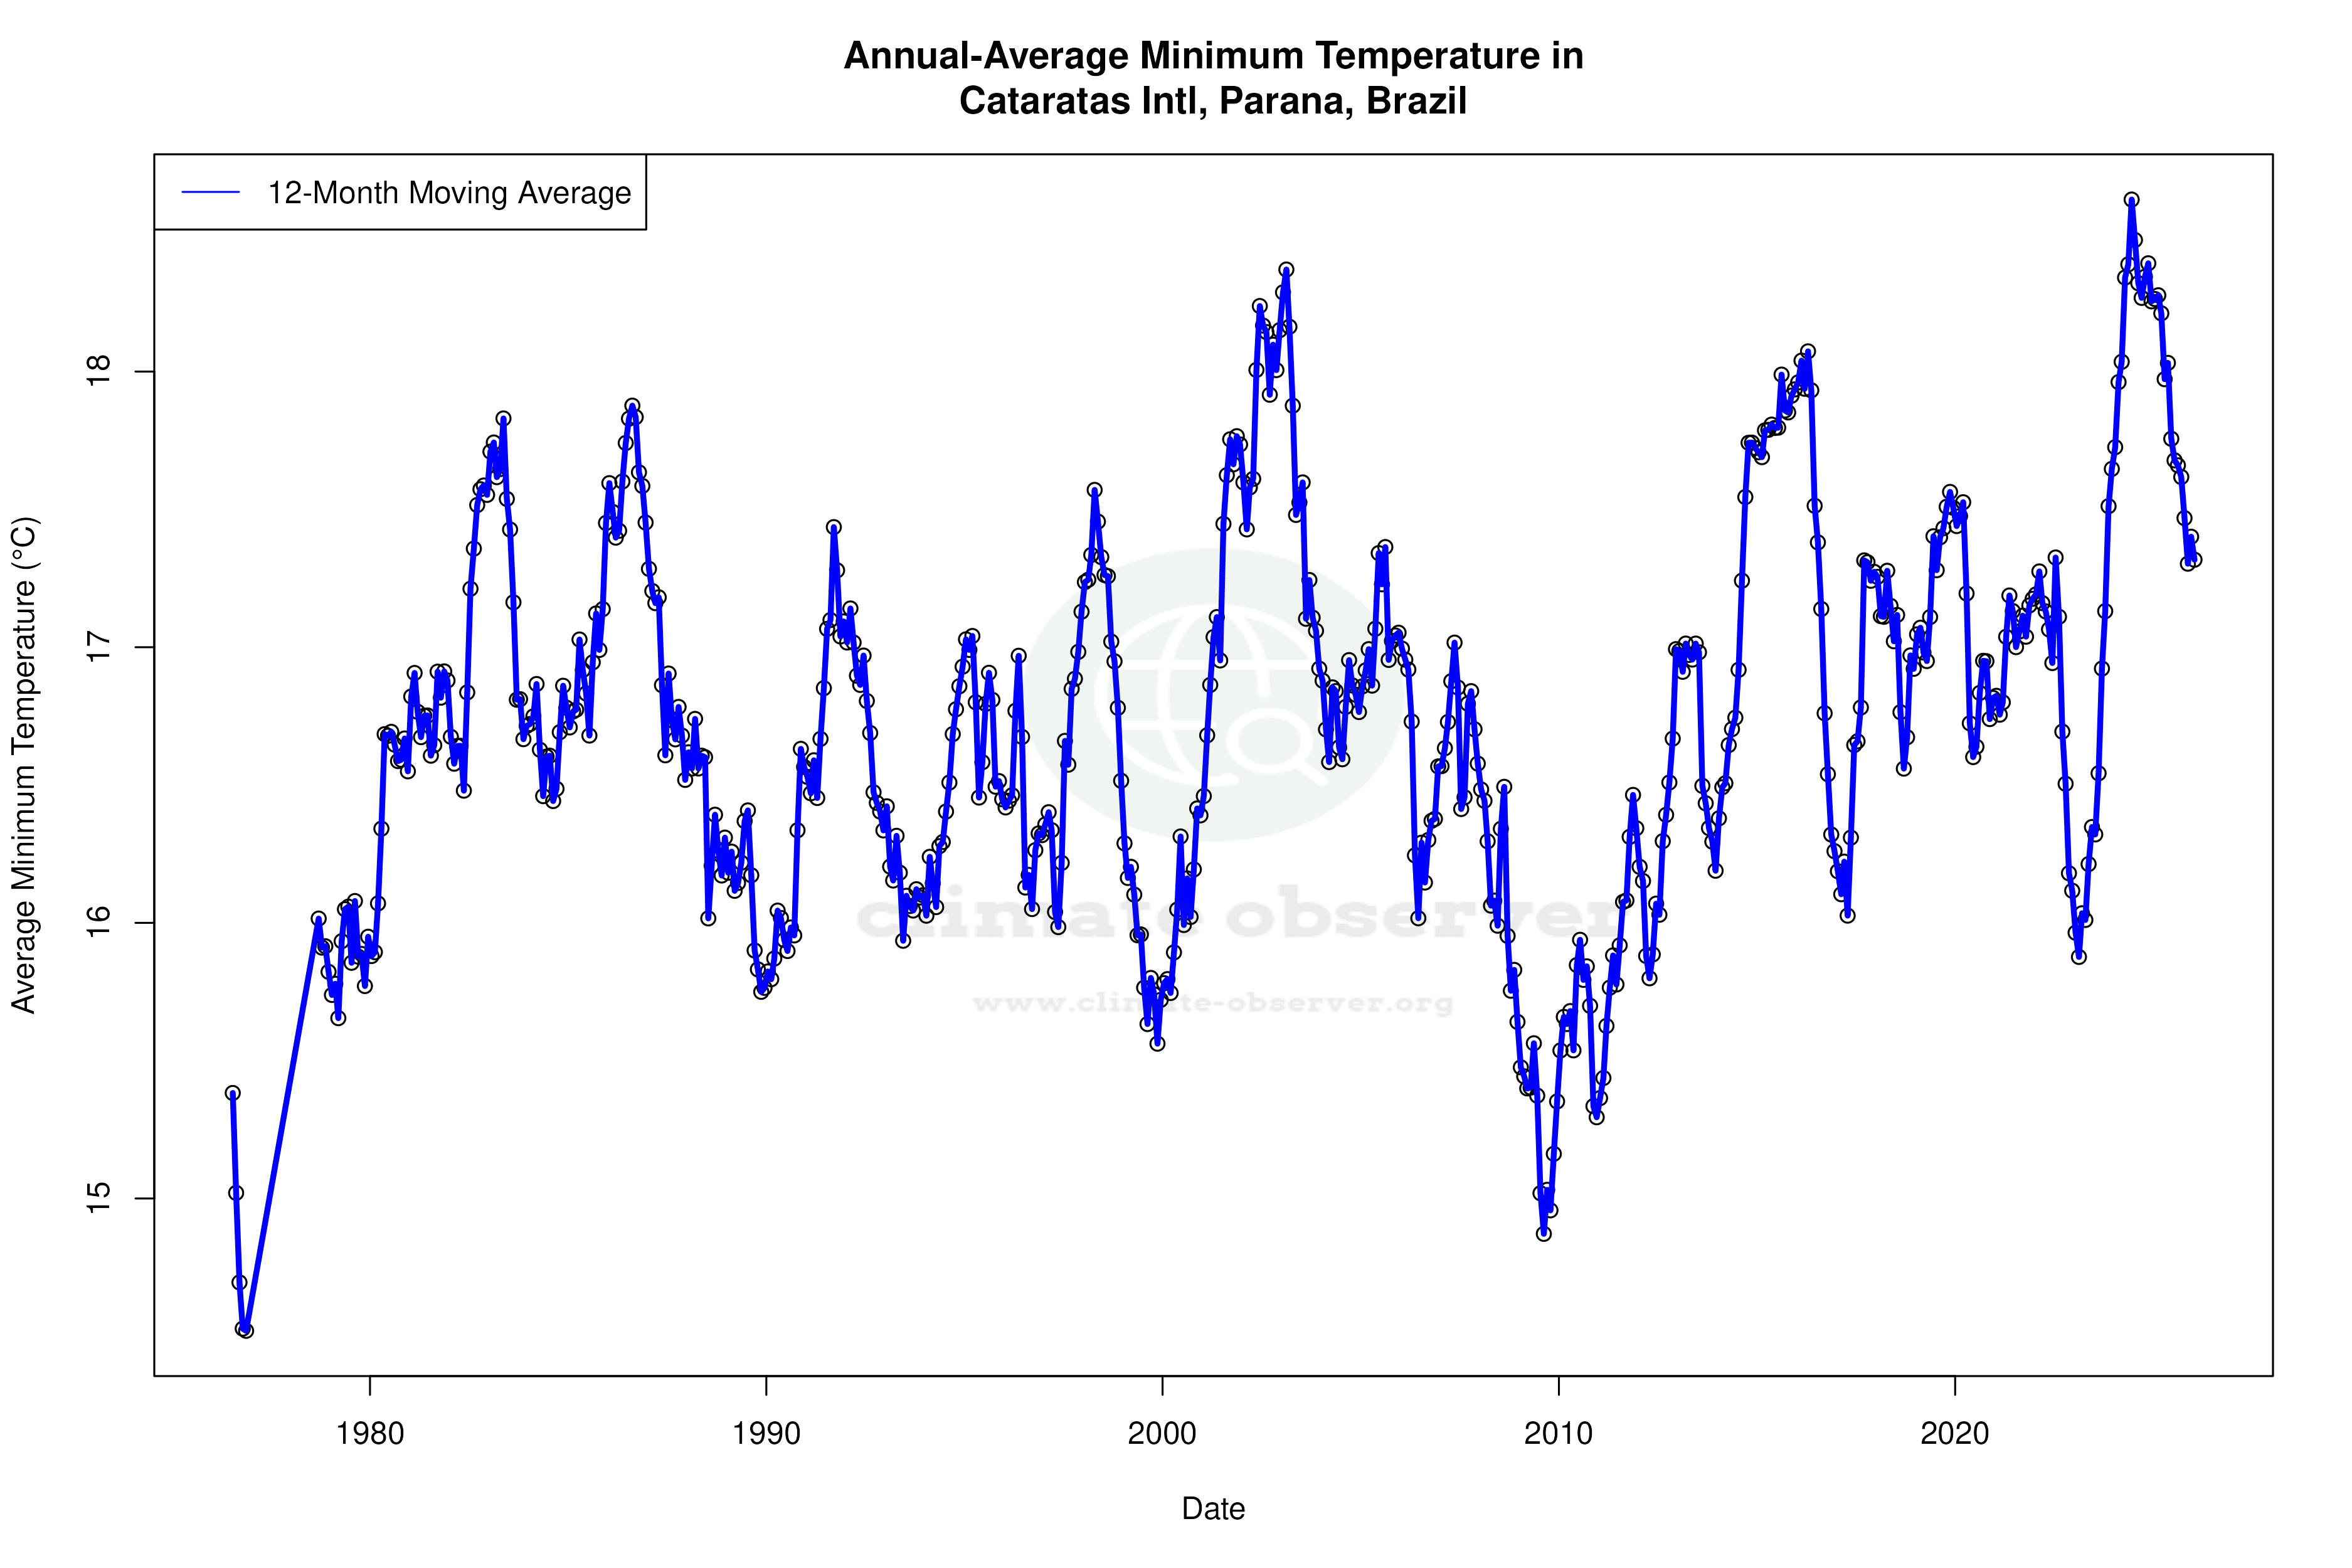


Max Temperature 12-Month MA | 1 of 6
Daily Data Points and Averages Throughout the Year
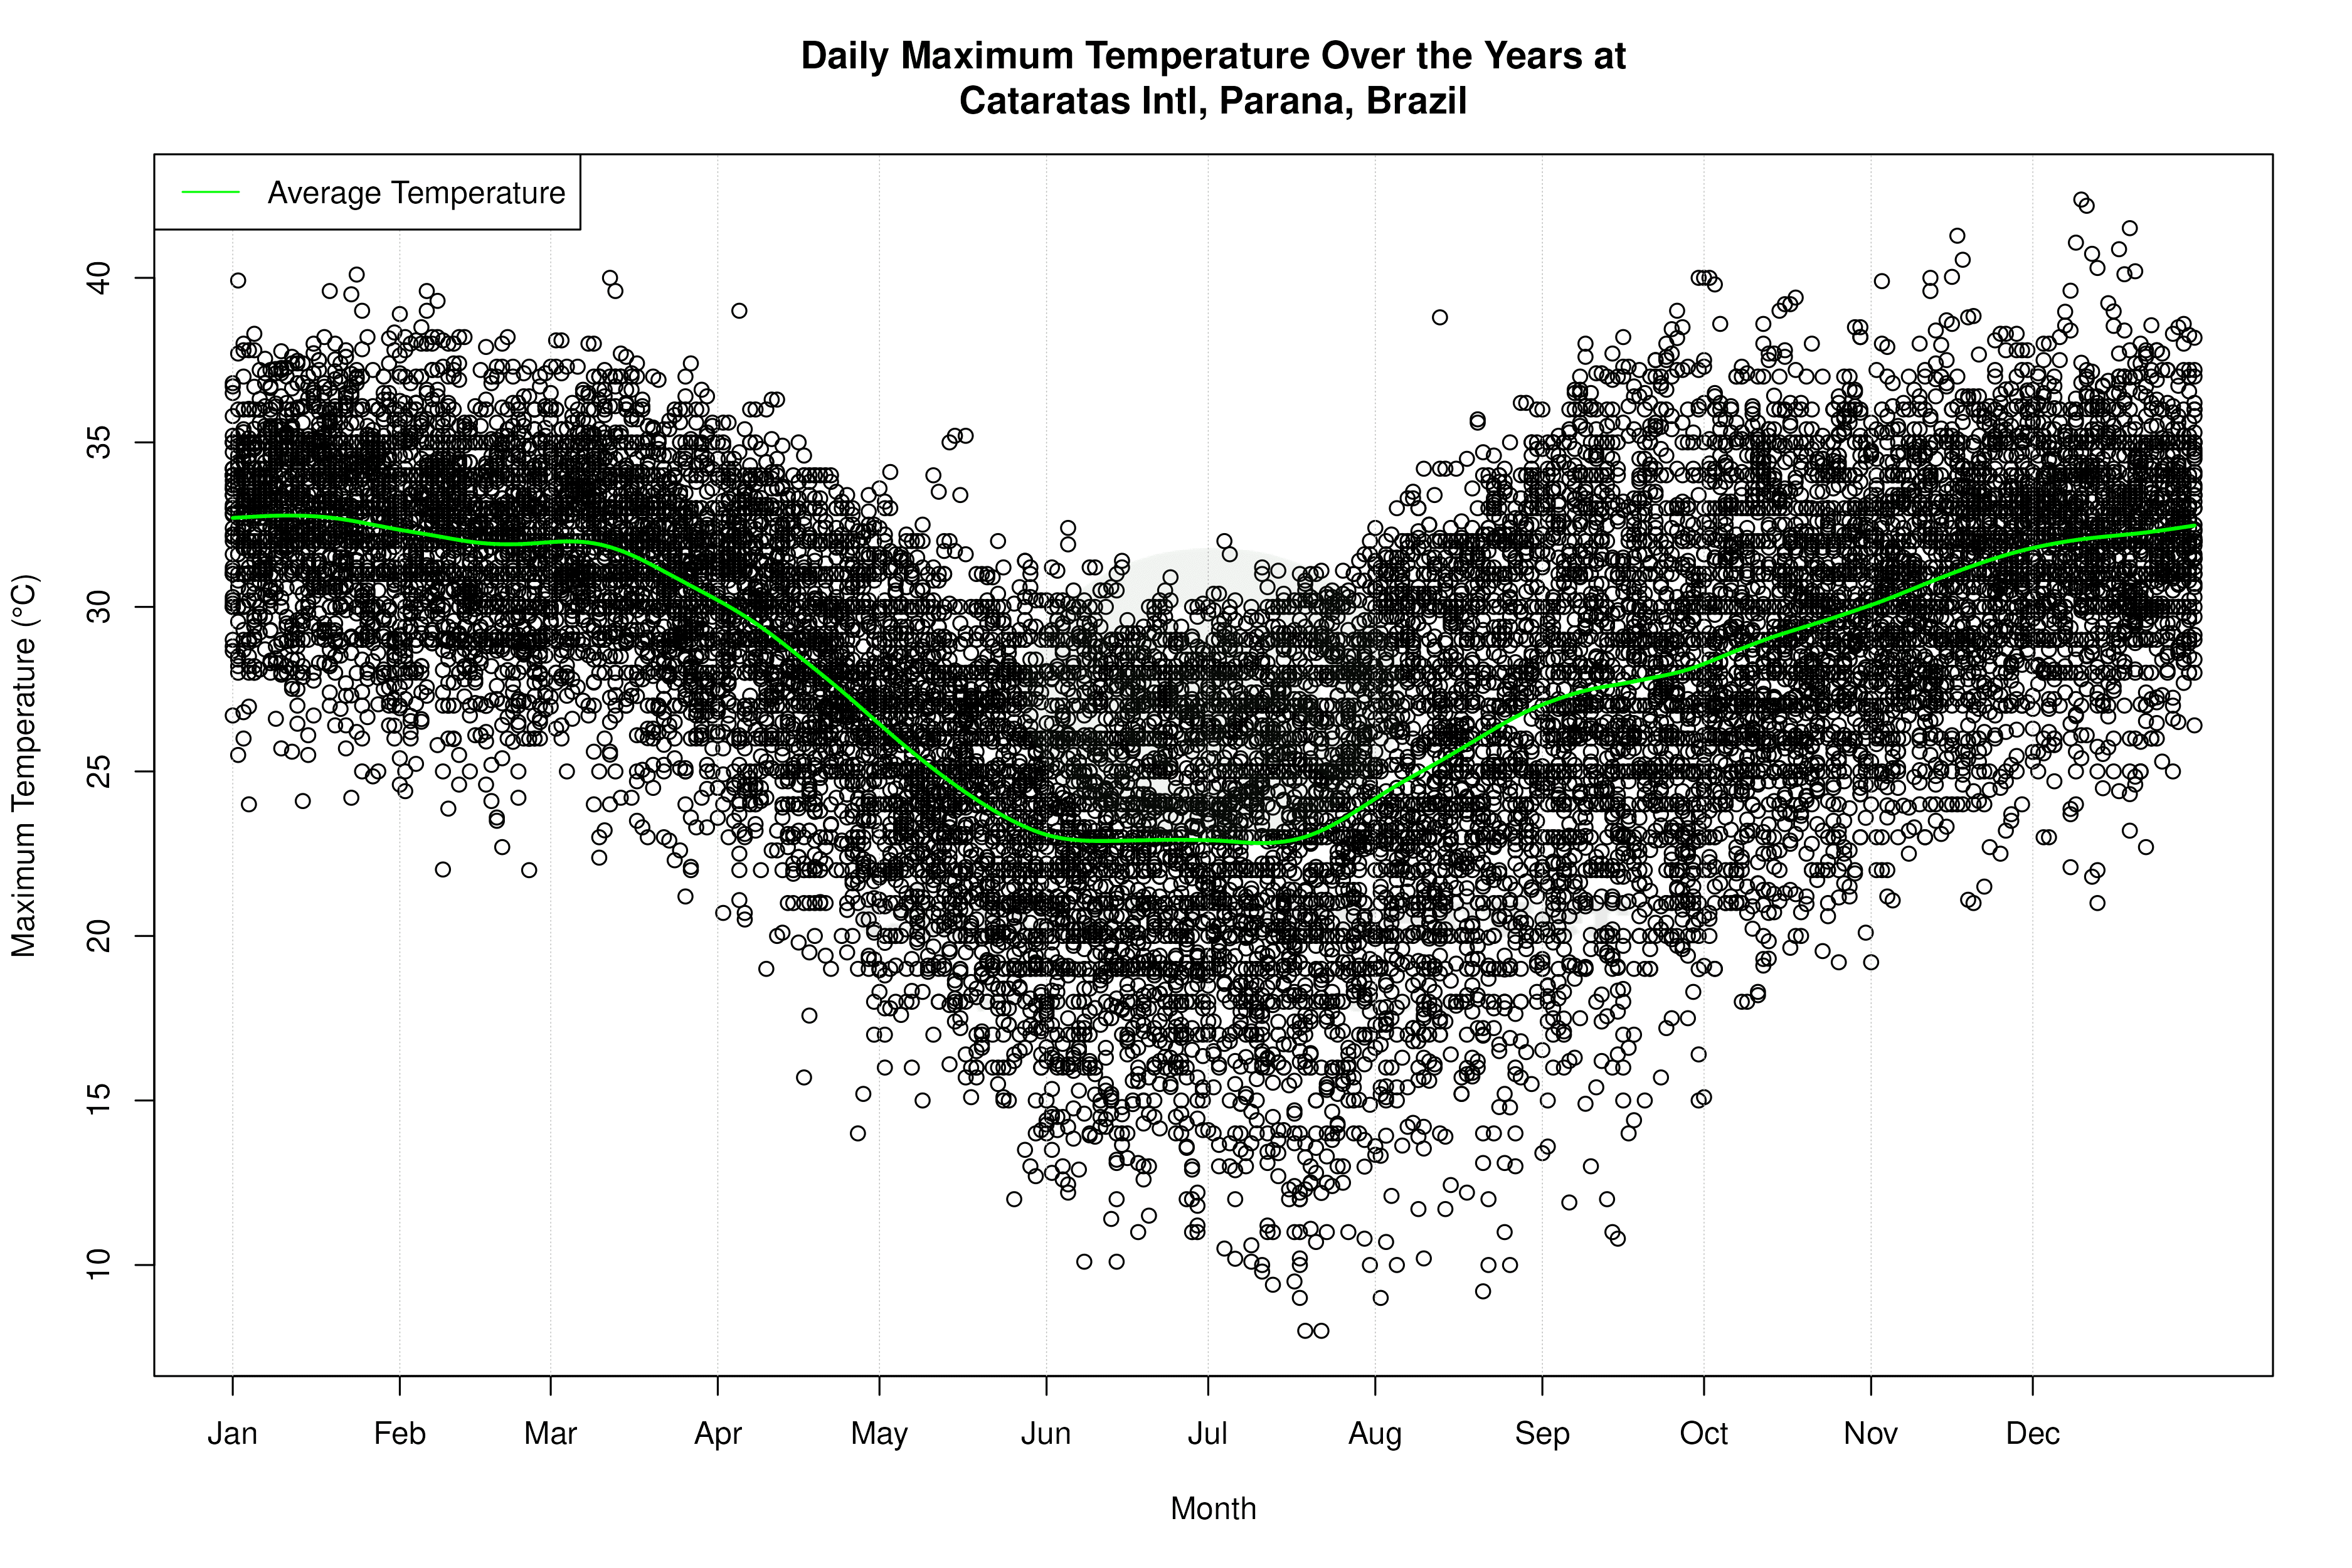


Average Max Temperature Throughout Year | 1 of 5
