Climate for Station: Windsor Riverside, Ontario, Canada
Loading live weather...
Climate Analysis & Overview
The Windsor Riverside climate station, located in Southwestern Ontario, reveals a nuanced climate profile marked by a slight long-term warming trend in low temperatures and a cooling trend in highs over the past decade. Precipitation patterns have become more evenly distributed, reflecting a decrease in concentrated rainfall events. These changes are set against the backdrop of Canada's regional climate objectives, which aim to mitigate climate change impacts.
Geographical Context and Climate Classification
Windsor Riverside, situated at 42.3333° N, -82.9333° W, experiences a humid continental climate, characterised by hot, humid summers and cold winters. The proximity to the Detroit River and Lake St. Clair plays a significant role in moderating temperatures and influencing local weather patterns. The water bodies contribute to a microclimate that can lead to milder winters and cooler summers compared to inland areas.
Temperature Trends: A Tale of Dual Directions
Over the long term, Windsor Riverside has witnessed a warming trend in low temperatures, with an increase of 0.20°C (0.36°F). This suggests milder nights and potentially longer growing seasons. However, the high temperatures exhibit a different story, with a slight long-term warming of 0.11°C (0.20°F). Contrastingly, the past decade has shown a cooling trend in high temperatures, with a decrease of 0.66°C (1.19°F), while low temperatures have risen by 0.22°C (0.40°F). This divergence may be indicative of changing atmospheric patterns or increased cloud cover during daytime.
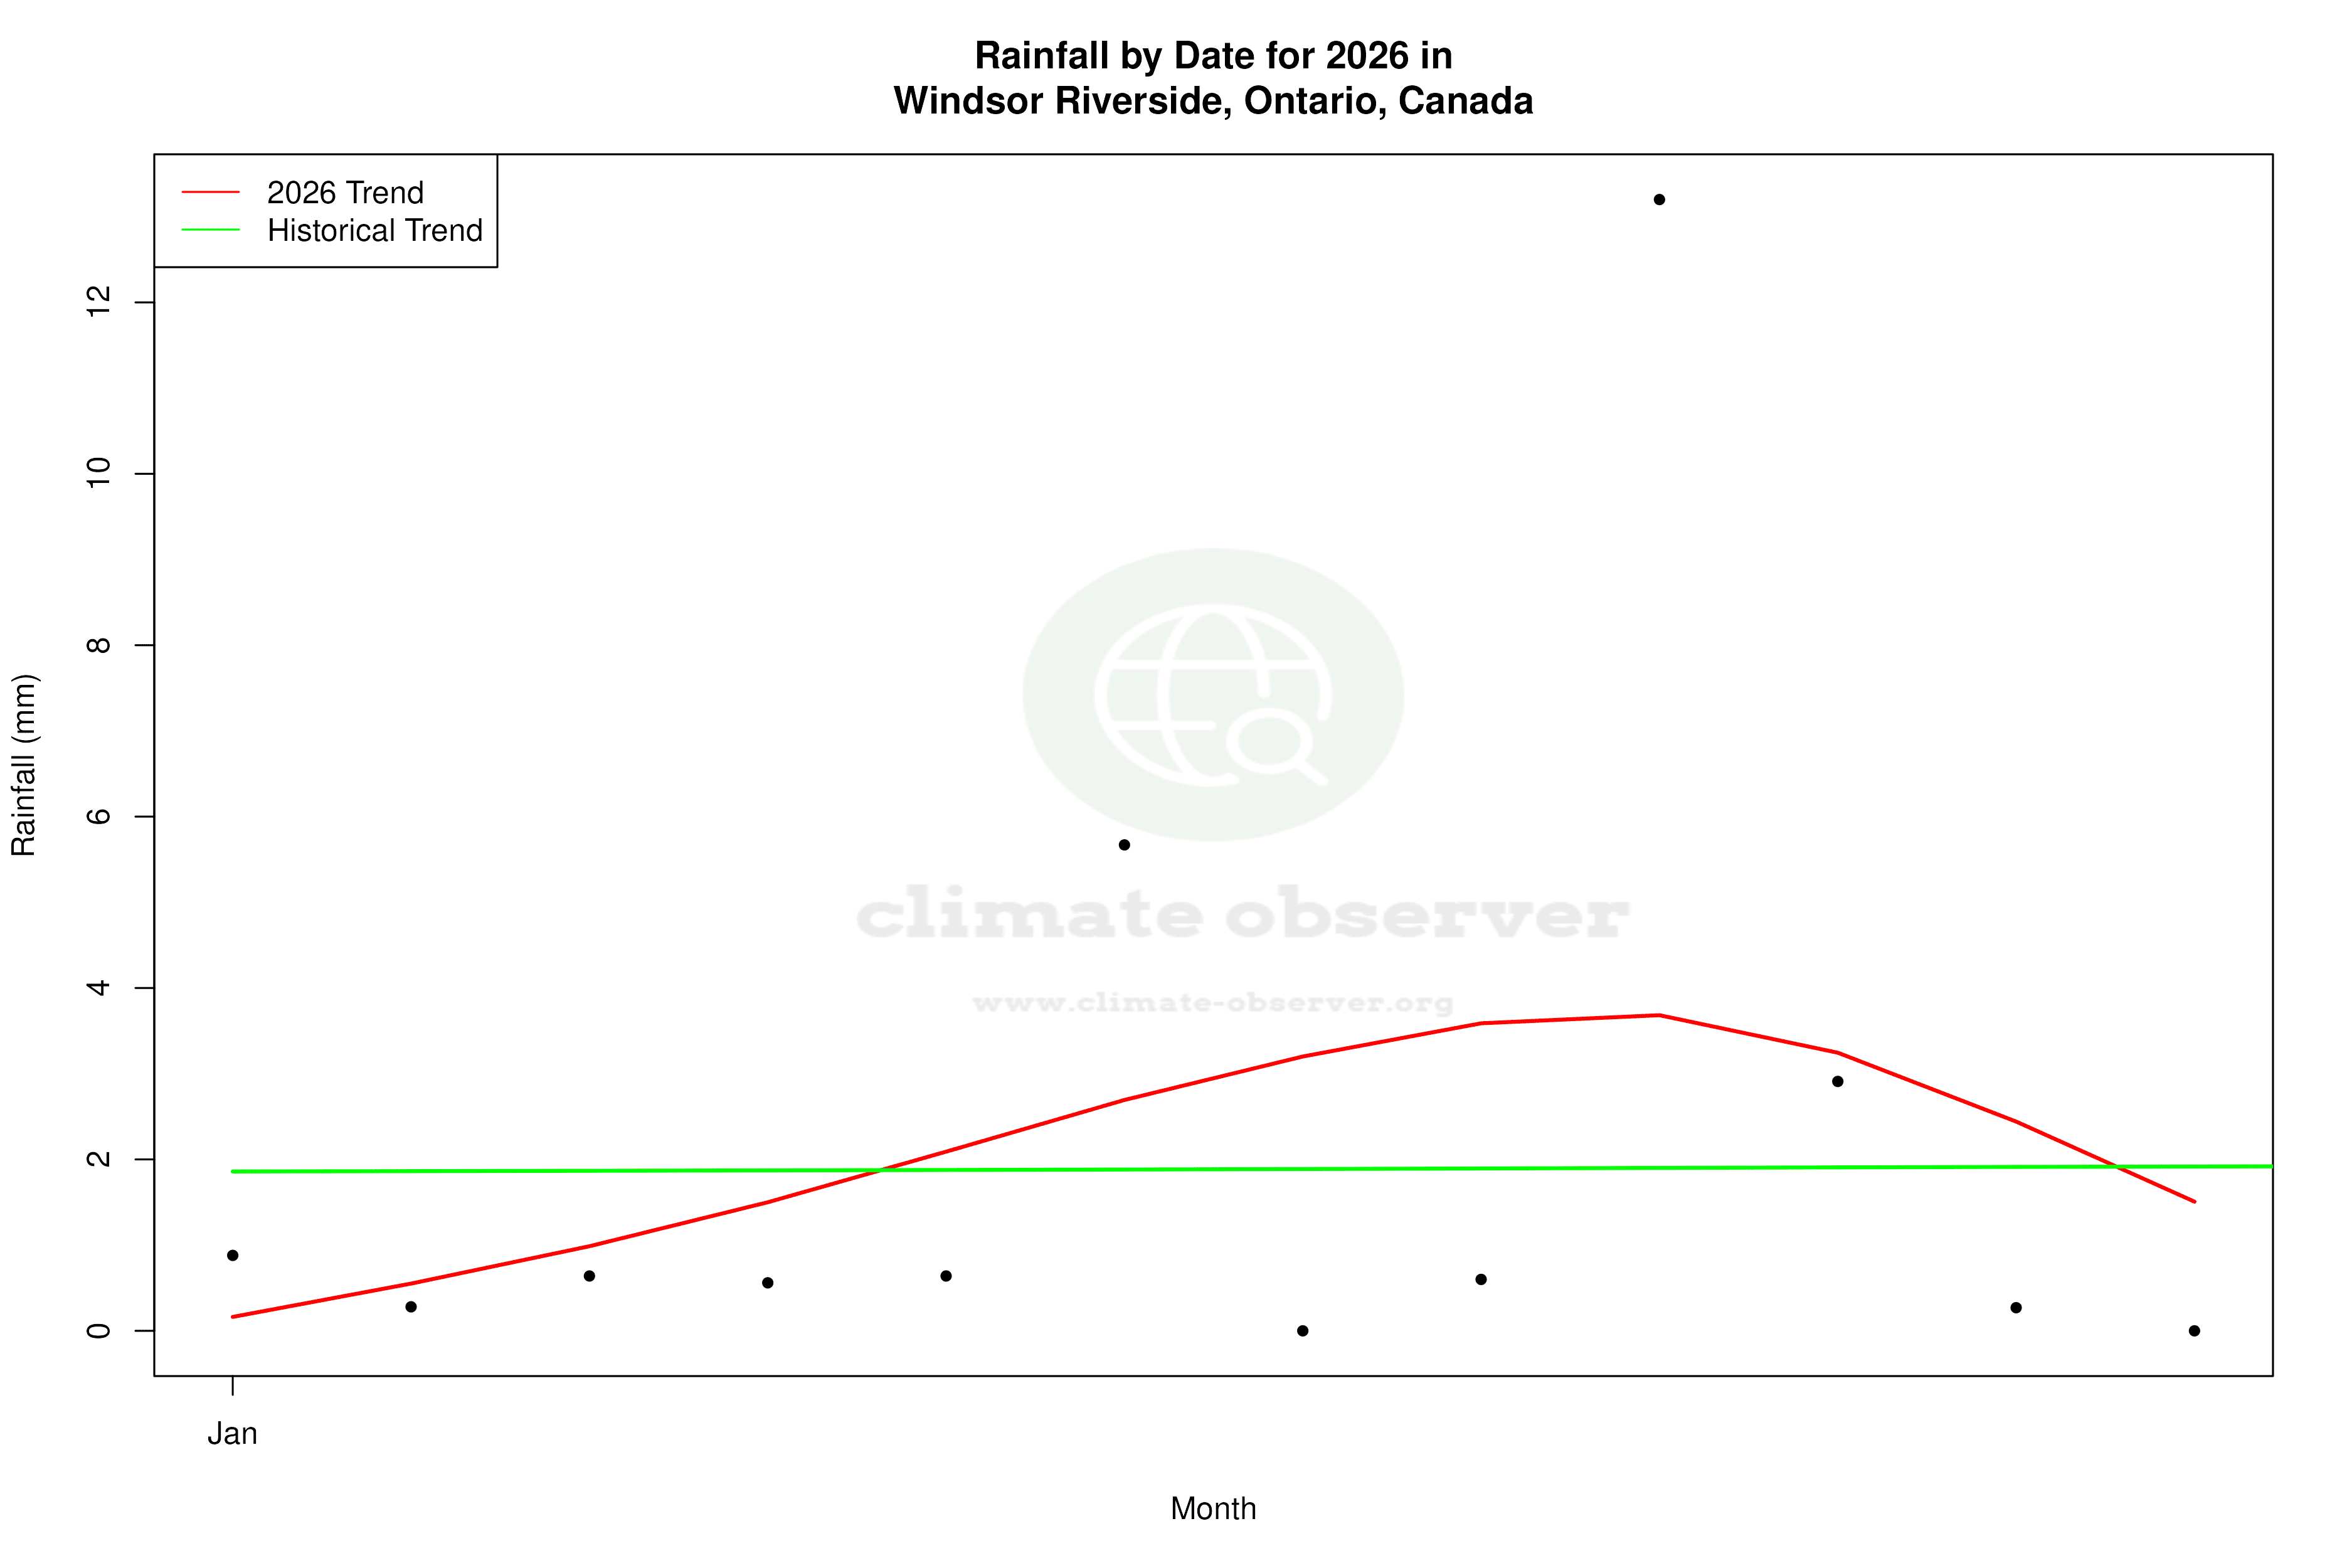
Precipitation Patterns: A Shift Towards Even Distribution
The Precipitation Concentration Index (PCI) for Windsor Riverside has decreased from a baseline of 11.49 to a current value of 9.82. This reduction signifies a more even distribution of rainfall throughout the year, moving away from intense, concentrated events. Such a shift could mitigate flood risks and benefit agricultural practices by providing more consistent moisture availability.
Extreme Temperature Records
Windsor Riverside's temperature records highlight the extremes of its climate. The highest recorded temperature is 40.2°C (104.4°F), while the lowest is -32.8°C (-27.0°F). These figures underscore the significant seasonal variability typical of a humid continental climate, where residents must be prepared for both sweltering summer heat and frigid winter cold.
Regional Climate Considerations
In the context of Canada's climate goals, which include reducing greenhouse gas emissions and enhancing resilience to climate impacts, the trends observed at Windsor Riverside offer valuable insights. The warming of low temperatures aligns with broader national patterns, while the cooling of highs over the past decade may reflect localised atmospheric changes. Understanding these dynamics is crucial for developing adaptive strategies that align with national objectives.
Station Statistics
10-Year Trend
High: -0.67 °C/decade
Low: +0.18 °C/decade
Rain: -0.81 mm/decade
25-Year Trend
High: +0.23 °C/decade
Low: +0.54 °C/decade
Rain: +0.01 mm/decade
50-Year Trend
High: +0.52 °C/decade
Low: +0.59 °C/decade
Rain: -0.00 mm/decade
All-Time Trend
High: +0.10 °C/decade
Low: +0.19 °C/decade
Rain: +0.03 mm/decade
Percentage Above-Average Days
Last 12 Months: 54.5%
This Year: 53.8%
Precipitation Concentration Index (PCI) ℹ️
Last 12 Months: 10.4
Historical Average: 10.3
Percentile Rank of Last 12 Months ℹ️
High: 67th percentile
Low: 87th percentile
Rain: 15th percentile
Change in Variance ℹ️
High: -5.5%
Low: -3.8%
Intraday: -3.3%
Data Coverage
83.5%
First Year of Data
1866
Station Location
Historical Weather Records
| Max High | Avg High | Min High | Max Avg | Avg Avg | Min Avg | Max Low | Avg Low | Min Low | Max Precipitation | Avg Precipitation | Max Snow | Avg Snow | |
|---|---|---|---|---|---|---|---|---|---|---|---|---|---|
| Record | 40.2 °C | — | -18.3 °C | 32.5 °C | — | -24.4 °C | 27.2 °C | — | -32.8 °C | 113.0 mm | — | 406.0 mm | — |
| January | 19.4 °C | -0.4 °C | -18.3 °C | 13.0 °C | -3.4 °C | -24.4 °C | 12.2 °C | -7.7 °C | -32.8 °C | 43.0 mm | 1.9 mm | 406.0 mm | 10.2 mm |
| February | 23.0 °C | 0.7 °C | -17.8 °C | 16.3 °C | -2.3 °C | -19.1 °C | 12.0 °C | -7.4 °C | -29.4 °C | 40.1 mm | 1.9 mm | 399.0 mm | 9.6 mm |
| March | 28.5 °C | 6.2 °C | -13.3 °C | 22.0 °C | 2.9 °C | -13.8 °C | 16.1 °C | -2.8 °C | -24.4 °C | 43.2 mm | 2.2 mm | 327.0 mm | 5.9 mm |
| April | 32.2 °C | 13.7 °C | -4.4 °C | 25.3 °C | 9.1 °C | -5.3 °C | 20.0 °C | 3.0 °C | -13.3 °C | 64.8 mm | 2.5 mm | 152.0 mm | 1.2 mm |
| May | 35.0 °C | 20.3 °C | 3.9 °C | 28.0 °C | 15.5 °C | 4.6 °C | 23.0 °C | 8.9 °C | -3.3 °C | 62.0 mm | 2.7 mm | 32.0 mm | 0.0 mm |
| June | 40.2 °C | 25.7 °C | 8.3 °C | 31.3 °C | 21.1 °C | 9.5 °C | 26.0 °C | 14.4 °C | 2.8 °C | 81.5 mm | 2.8 mm | 0.0 mm | 0.0 mm |
| July | 39.0 °C | 28.3 °C | 15.0 °C | 32.5 °C | 23.5 °C | 15.3 °C | 27.0 °C | 17.2 °C | 4.4 °C | 113.0 mm | 2.7 mm | 0.0 mm | 0.0 mm |
| August | 38.5 °C | 27.0 °C | 13.9 °C | 31.5 °C | 22.5 °C | 12.5 °C | 27.2 °C | 16.4 °C | 5.0 °C | 87.6 mm | 2.5 mm | 0.0 mm | 0.0 mm |
| September | 38.3 °C | 23.1 °C | 7.2 °C | 29.3 °C | 18.5 °C | 6.3 °C | 24.5 °C | 12.5 °C | -1.1 °C | 70.8 mm | 2.5 mm | 0.0 mm | 0.0 mm |
| October | 32.5 °C | 16.3 °C | 0.0 °C | 26.0 °C | 11.9 °C | 0.0 °C | 21.0 °C | 6.5 °C | -7.2 °C | 61.0 mm | 2.0 mm | 76.0 mm | 0.1 mm |
| November | 26.1 °C | 8.4 °C | -10.0 °C | 20.3 °C | 5.4 °C | -8.3 °C | 17.9 °C | 0.6 °C | -18.9 °C | 57.4 mm | 2.2 mm | 305.0 mm | 2.2 mm |
| December | 21.0 °C | 1.8 °C | -17.2 °C | 17.1 °C | -0.4 °C | -19.9 °C | 13.6 °C | -4.9 °C | -29.4 °C | 50.3 mm | 2.1 mm | 305.0 mm | 7.1 mm |
Data Visualisations
Remove WatermarksCurrent Year Climate Trends vs Historical


Max Temperature this Year | 1 of 6
Climate 12-Month Moving Averages


Max Temperature 12-Month MA | 1 of 6
Daily Data Points and Averages Throughout the Year


Average Max Temperature Throughout Year | 1 of 5
