Climate for Station: Lennoxville, Quebec, Canada
Loading live weather...
Climate Analysis & Overview
Lennoxville, nestled in the Estrie region of Québec, is witnessing a warming trend, particularly noticeable in nighttime temperatures. While the all-time temperature increase is modest, recent decades show a sharper rise, indicating potential shifts in climate patterns. Precipitation has become more evenly distributed, suggesting changes in local weather dynamics.
Köppen Climate and Geographic Influence
Lennoxville, located at 45.3667, -71.8167, falls under the Dfb classification in the Köppen climate system, which denotes a humid continental climate with warm summers and no dry season. The region's climate is influenced by its proximity to the Appalachian Mountains, which can affect local weather patterns by blocking or redirecting prevailing winds and precipitation. The presence of the Saint-François River also plays a role in moderating temperatures and contributing to local humidity levels.
Temperature Trends: A Tale of Two Scales
Over the past decade, Lennoxville has experienced a notable warming trend, particularly in nighttime temperatures. The 10-year trend shows an increase in lows by 1.25°C (2.25°F), while highs have risen by 0.38°C (0.68°F). In contrast, the all-time trends are more subdued, with highs increasing by 0.09°C (0.16°F) and lows by 0.25°C (0.45°F). This discrepancy suggests that recent years have seen a more accelerated warming, especially during the night, which could have implications for local ecosystems and energy consumption patterns.
Precipitation Patterns: A Shift Towards Evenness
The Precipitation Concentration Index (PCI) for Lennoxville has decreased from a baseline of 10.8 to a current value of 9.3. This indicates that precipitation events are becoming more evenly distributed throughout the year, rather than being concentrated in fewer, more intense events. Such a shift could reduce the risk of flooding and soil erosion, while also affecting water resource management strategies in the region.
Record Extremes: A Climate of Contrasts
Lennoxville's climate is marked by significant temperature extremes, with a record high of 37.2°C (98.96°F) and a record low of -44.4°C (-47.92°F). These extremes highlight the region's potential vulnerability to both heatwaves and severe cold spells, which could become more pronounced with ongoing climate change.
Regional Climate Goals and Implications
In the context of Canada's regional climate goals, which aim to reduce greenhouse gas emissions and enhance climate resilience, Lennoxville's warming trends and changing precipitation patterns could serve as indicators of broader climatic shifts. Recent weather events, such as unseasonal temperature spikes or prolonged dry spells, could further underscore the need for adaptive strategies to mitigate the impacts of climate change on local communities and ecosystems.
Station Statistics
10-Year Trend
High: +0.28 °C/decade
Low: +1.23 °C/decade
Rain: +0.49 mm/decade
25-Year Trend
High: +0.31 °C/decade
Low: +0.52 °C/decade
Rain: +0.10 mm/decade
50-Year Trend
High: +0.29 °C/decade
Low: +0.30 °C/decade
Rain: +0.03 mm/decade
All-Time Trend
High: +0.09 °C/decade
Low: +0.25 °C/decade
Rain: +0.00 mm/decade
Percentage Above-Average Days
Last 12 Months: 50.4%
This Year: 47.3%
Precipitation Concentration Index (PCI) ℹ️
Last 12 Months: 10.9
Historical Average: 10.2
Percentile Rank of Last 12 Months ℹ️
High: 71st percentile
Low: 90th percentile
Rain: 61st percentile
Change in Variance ℹ️
High: -5.1%
Low: -13.0%
Intraday: -29.3%
Data Coverage
70.5%
First Year of Data
1888
Station Location
Historical Weather Records
| Max High | Avg High | Min High | Max Avg | Avg Avg | Min Avg | Max Low | Avg Low | Min Low | Max Precipitation | Avg Precipitation | Max Snow | Avg Snow | |
|---|---|---|---|---|---|---|---|---|---|---|---|---|---|
| Record | 37.2 °C | — | -30.6 °C | 28.2 °C | — | -37.8 °C | 25.0 °C | — | -44.4 °C | 103.6 mm | — | 643.0 mm | — |
| January | 17.0 °C | -4.5 °C | -26.8 °C | 9.0 °C | -10.0 °C | -37.8 °C | 7.2 °C | -15.9 °C | -44.4 °C | 56.2 mm | 2.4 mm | 485.0 mm | 18.4 mm |
| February | 18.2 °C | -3.0 °C | -30.0 °C | 10.3 °C | -8.4 °C | -28.1 °C | 7.0 °C | -15.6 °C | -43.9 °C | 57.7 mm | 2.2 mm | 411.0 mm | 17.6 mm |
| March | 25.8 °C | 2.7 °C | -22.2 °C | 14.3 °C | -2.8 °C | -24.4 °C | 9.0 °C | -8.8 °C | -40.0 °C | 67.3 mm | 2.2 mm | 391.0 mm | 12.9 mm |
| April | 30.6 °C | 10.6 °C | -8.9 °C | 20.4 °C | 4.9 °C | -13.1 °C | 18.3 °C | -1.0 °C | -20.6 °C | 45.9 mm | 2.5 mm | 254.0 mm | 4.7 mm |
| May | 34.9 °C | 18.2 °C | 0.6 °C | 25.4 °C | 12.0 °C | -1.2 °C | 20.6 °C | 4.9 °C | -6.7 °C | 59.2 mm | 2.8 mm | 213.0 mm | 0.3 mm |
| June | 35.0 °C | 23.2 °C | 7.8 °C | 27.7 °C | 16.8 °C | 5.2 °C | 23.9 °C | 10.4 °C | -3.9 °C | 103.6 mm | 3.5 mm | 0.0 mm | 0.0 mm |
| July | 37.2 °C | 25.7 °C | 12.5 °C | 28.2 °C | 19.3 °C | 9.9 °C | 25.0 °C | 13.1 °C | 0.6 °C | 94.0 mm | 3.5 mm | 0.0 mm | 0.0 mm |
| August | 36.1 °C | 24.5 °C | 11.1 °C | 26.6 °C | 18.1 °C | 7.5 °C | 24.4 °C | 11.9 °C | -1.1 °C | 82.6 mm | 3.4 mm | 0.0 mm | 0.0 mm |
| September | 33.9 °C | 20.1 °C | 3.0 °C | 26.0 °C | 13.9 °C | 1.4 °C | 21.7 °C | 7.5 °C | -8.9 °C | 68.8 mm | 3.0 mm | 43.0 mm | 0.0 mm |
| October | 29.4 °C | 13.3 °C | -1.7 °C | 21.3 °C | 7.6 °C | -2.5 °C | 19.4 °C | 2.1 °C | -11.1 °C | 84.3 mm | 3.0 mm | 305.0 mm | 0.9 mm |
| November | 23.9 °C | 5.4 °C | -12.8 °C | 19.2 °C | 1.1 °C | -14.9 °C | 15.0 °C | -3.3 °C | -26.7 °C | 61.0 mm | 2.8 mm | 643.0 mm | 8.5 mm |
| December | 18.9 °C | -2.0 °C | -30.6 °C | 11.6 °C | -5.9 °C | -27.3 °C | 8.5 °C | -11.5 °C | -44.4 °C | 50.5 mm | 2.7 mm | 483.0 mm | 17.6 mm |
Data Visualisations
Remove WatermarksCurrent Year Climate Trends vs Historical


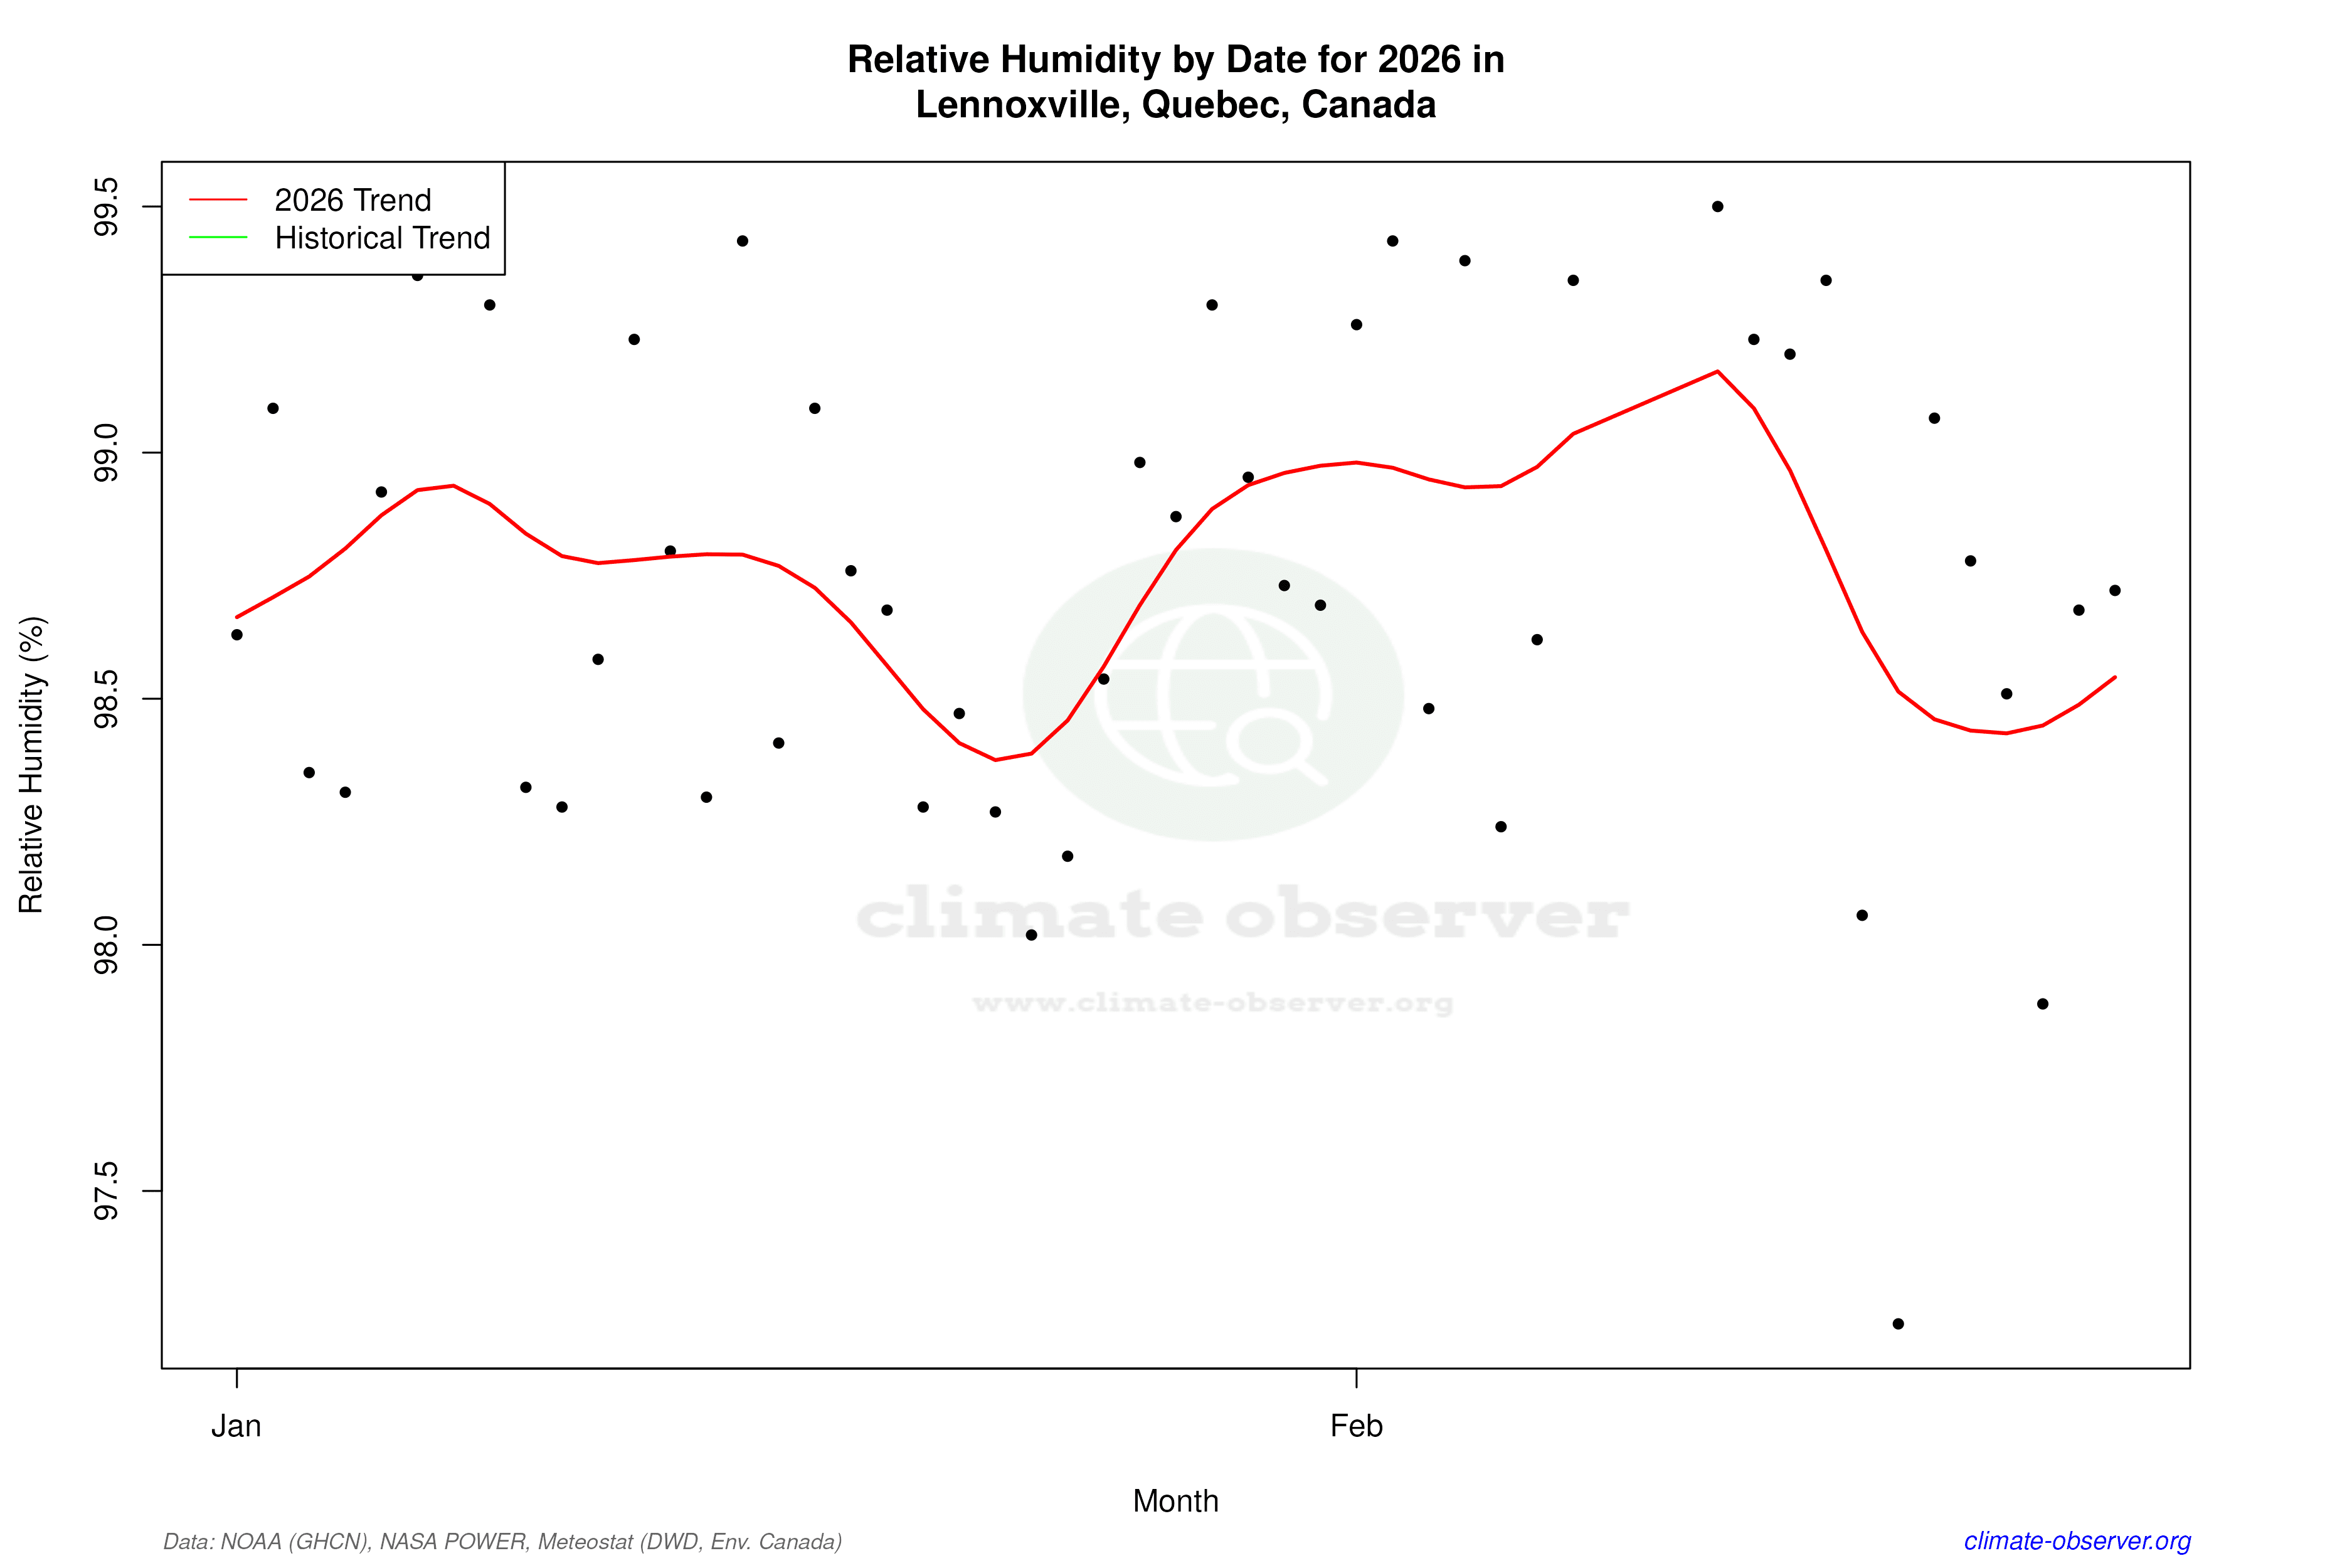

Max Temperature this Year | 1 of 6
Climate 12-Month Moving Averages


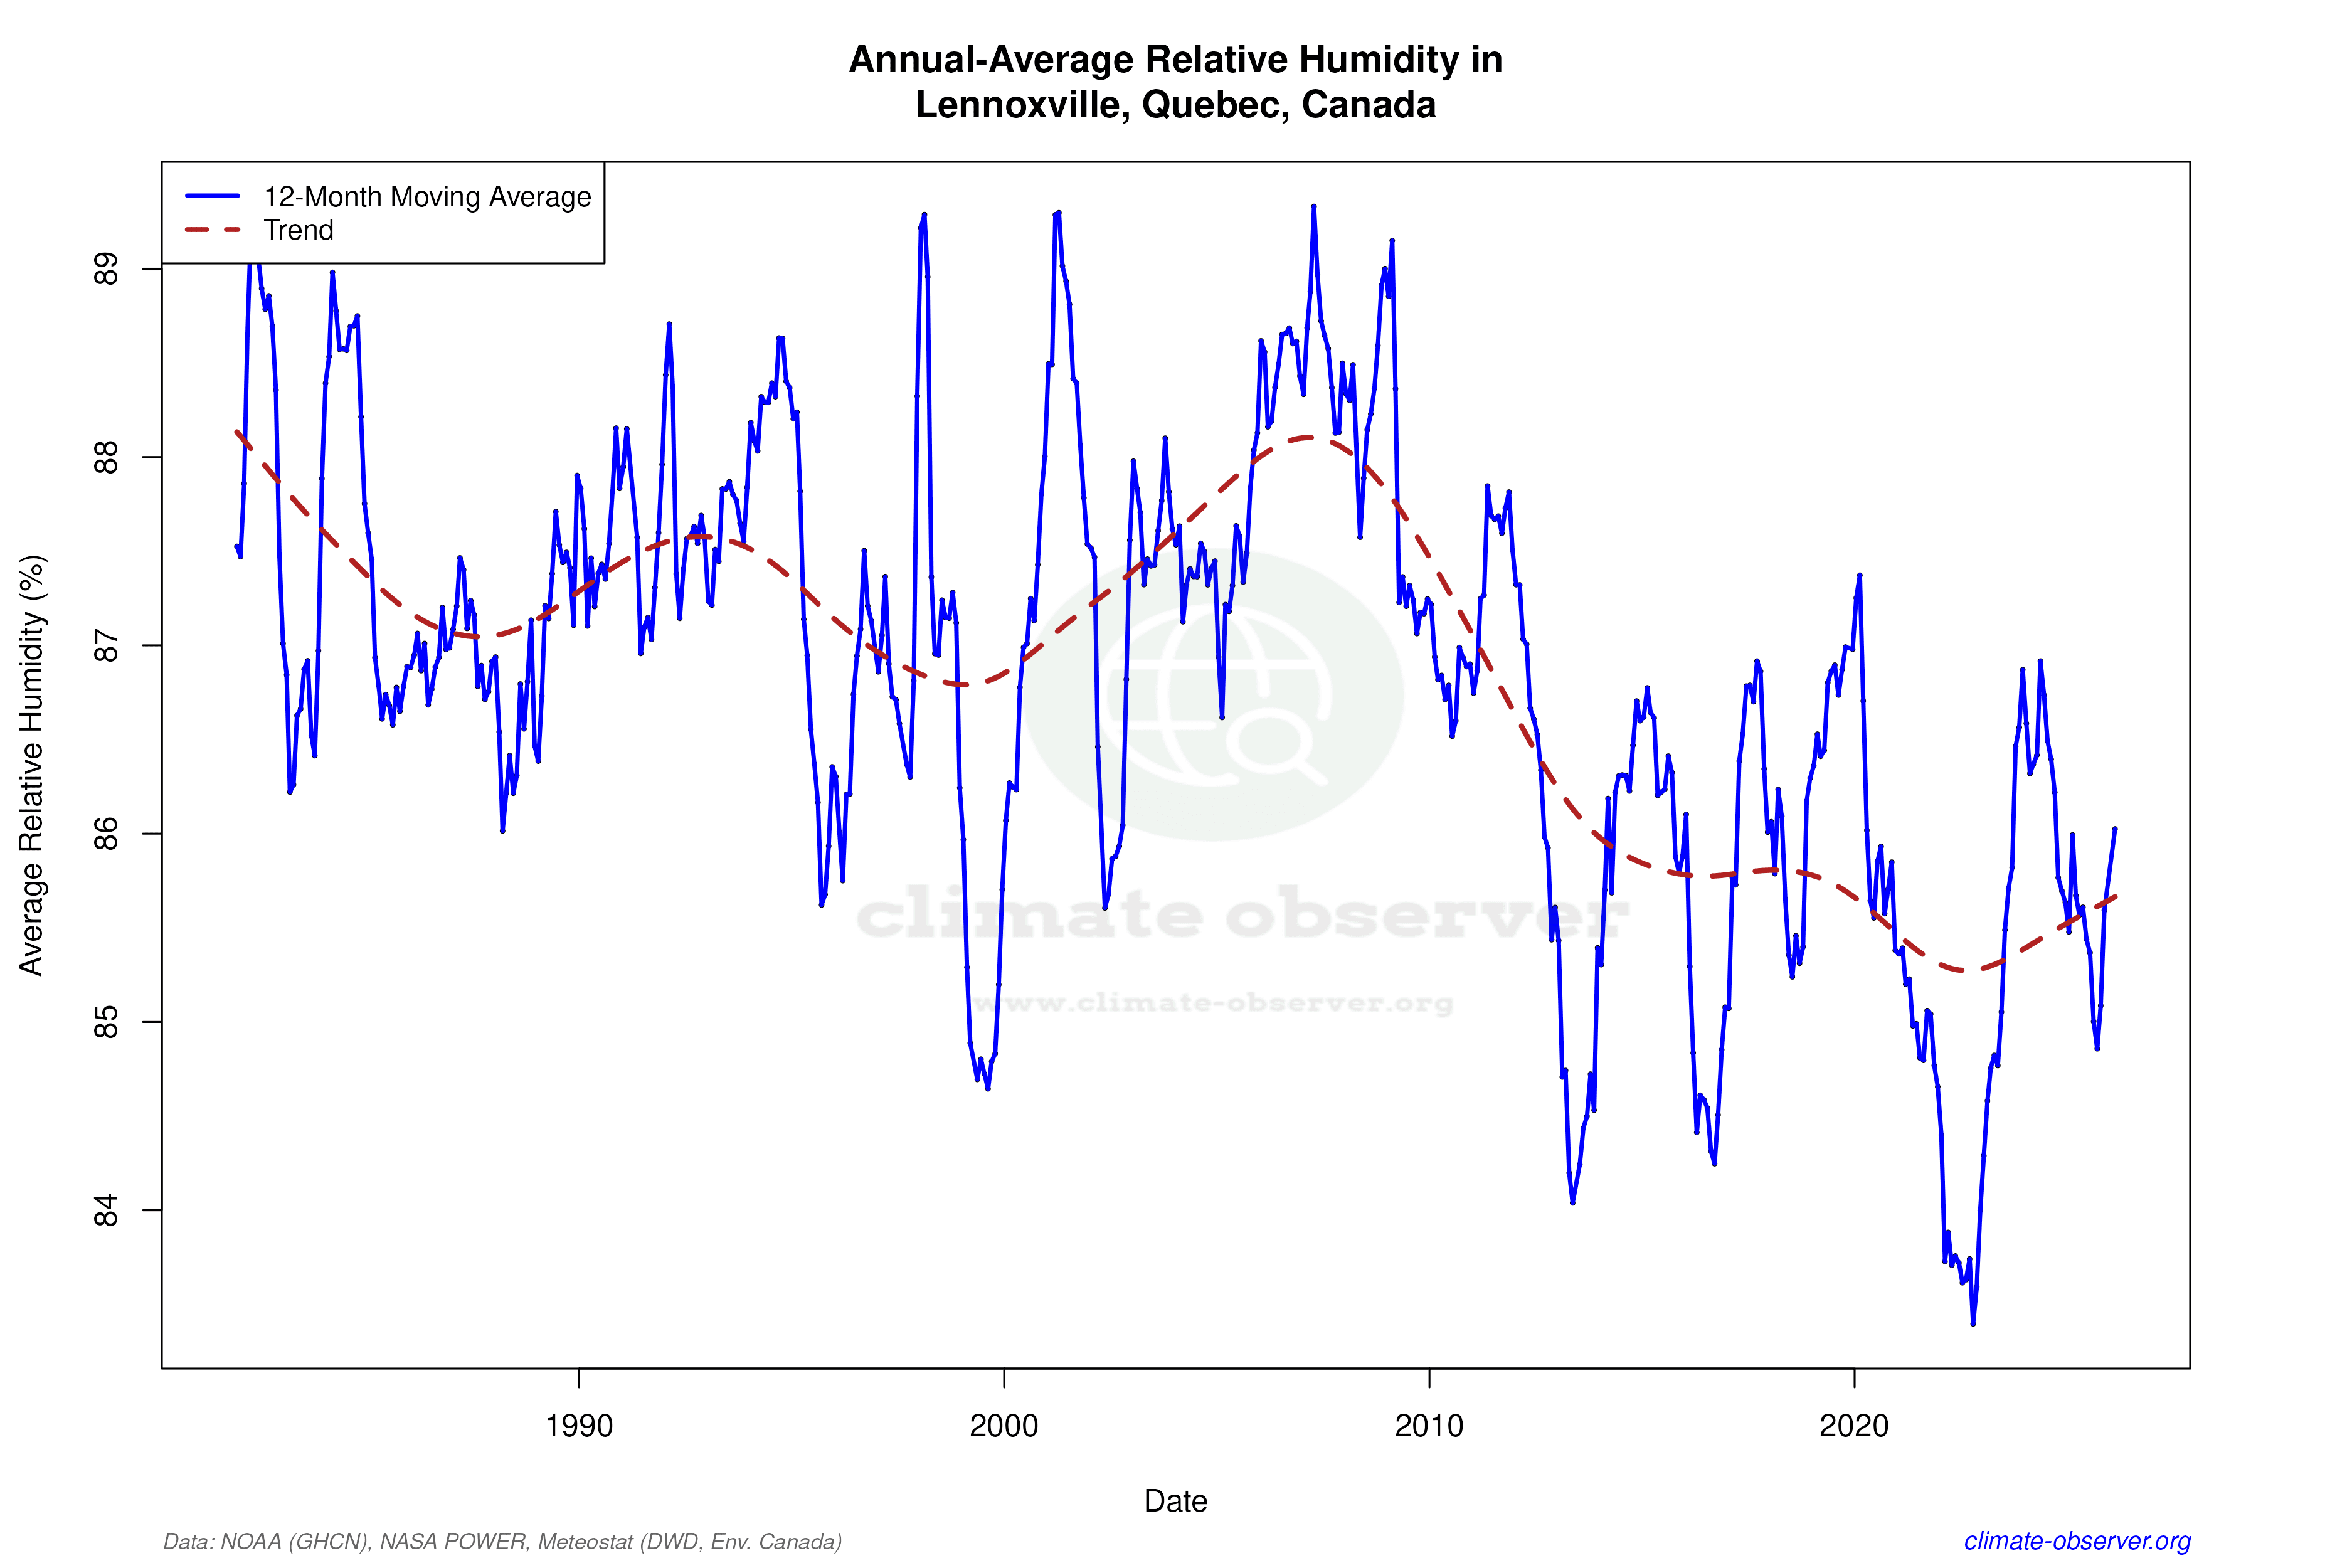

Max Temperature 12-Month MA | 1 of 6
Daily Data Points and Averages Throughout the Year


Average Max Temperature Throughout Year | 1 of 5
