Climate for Station: Ndjamena, Chad
Loading live weather...
Climate Analysis & Overview
N'Djamena's climate reveals a complex interplay of historical warming trends and recent cooling intervals. While long-term data indicates an overall warming for both highs and lows, the last decade has seen a cooling trend, particularly in nighttime temperatures. Precipitation is becoming increasingly concentrated, suggesting more intense rainfall events.
Climatic Overview of N'Djamena
N'Djamena, the capital of Chad, is characterised by a hot semi-arid climate (BSh) according to the Köppen classification. This climate type is defined by high temperatures and a distinct dry season. The city's geographical position near the Chari River influences its weather patterns, providing a source of moisture that can intensify rainfall events during the wet season.
Temperature Trends: A Tale of Two Scales
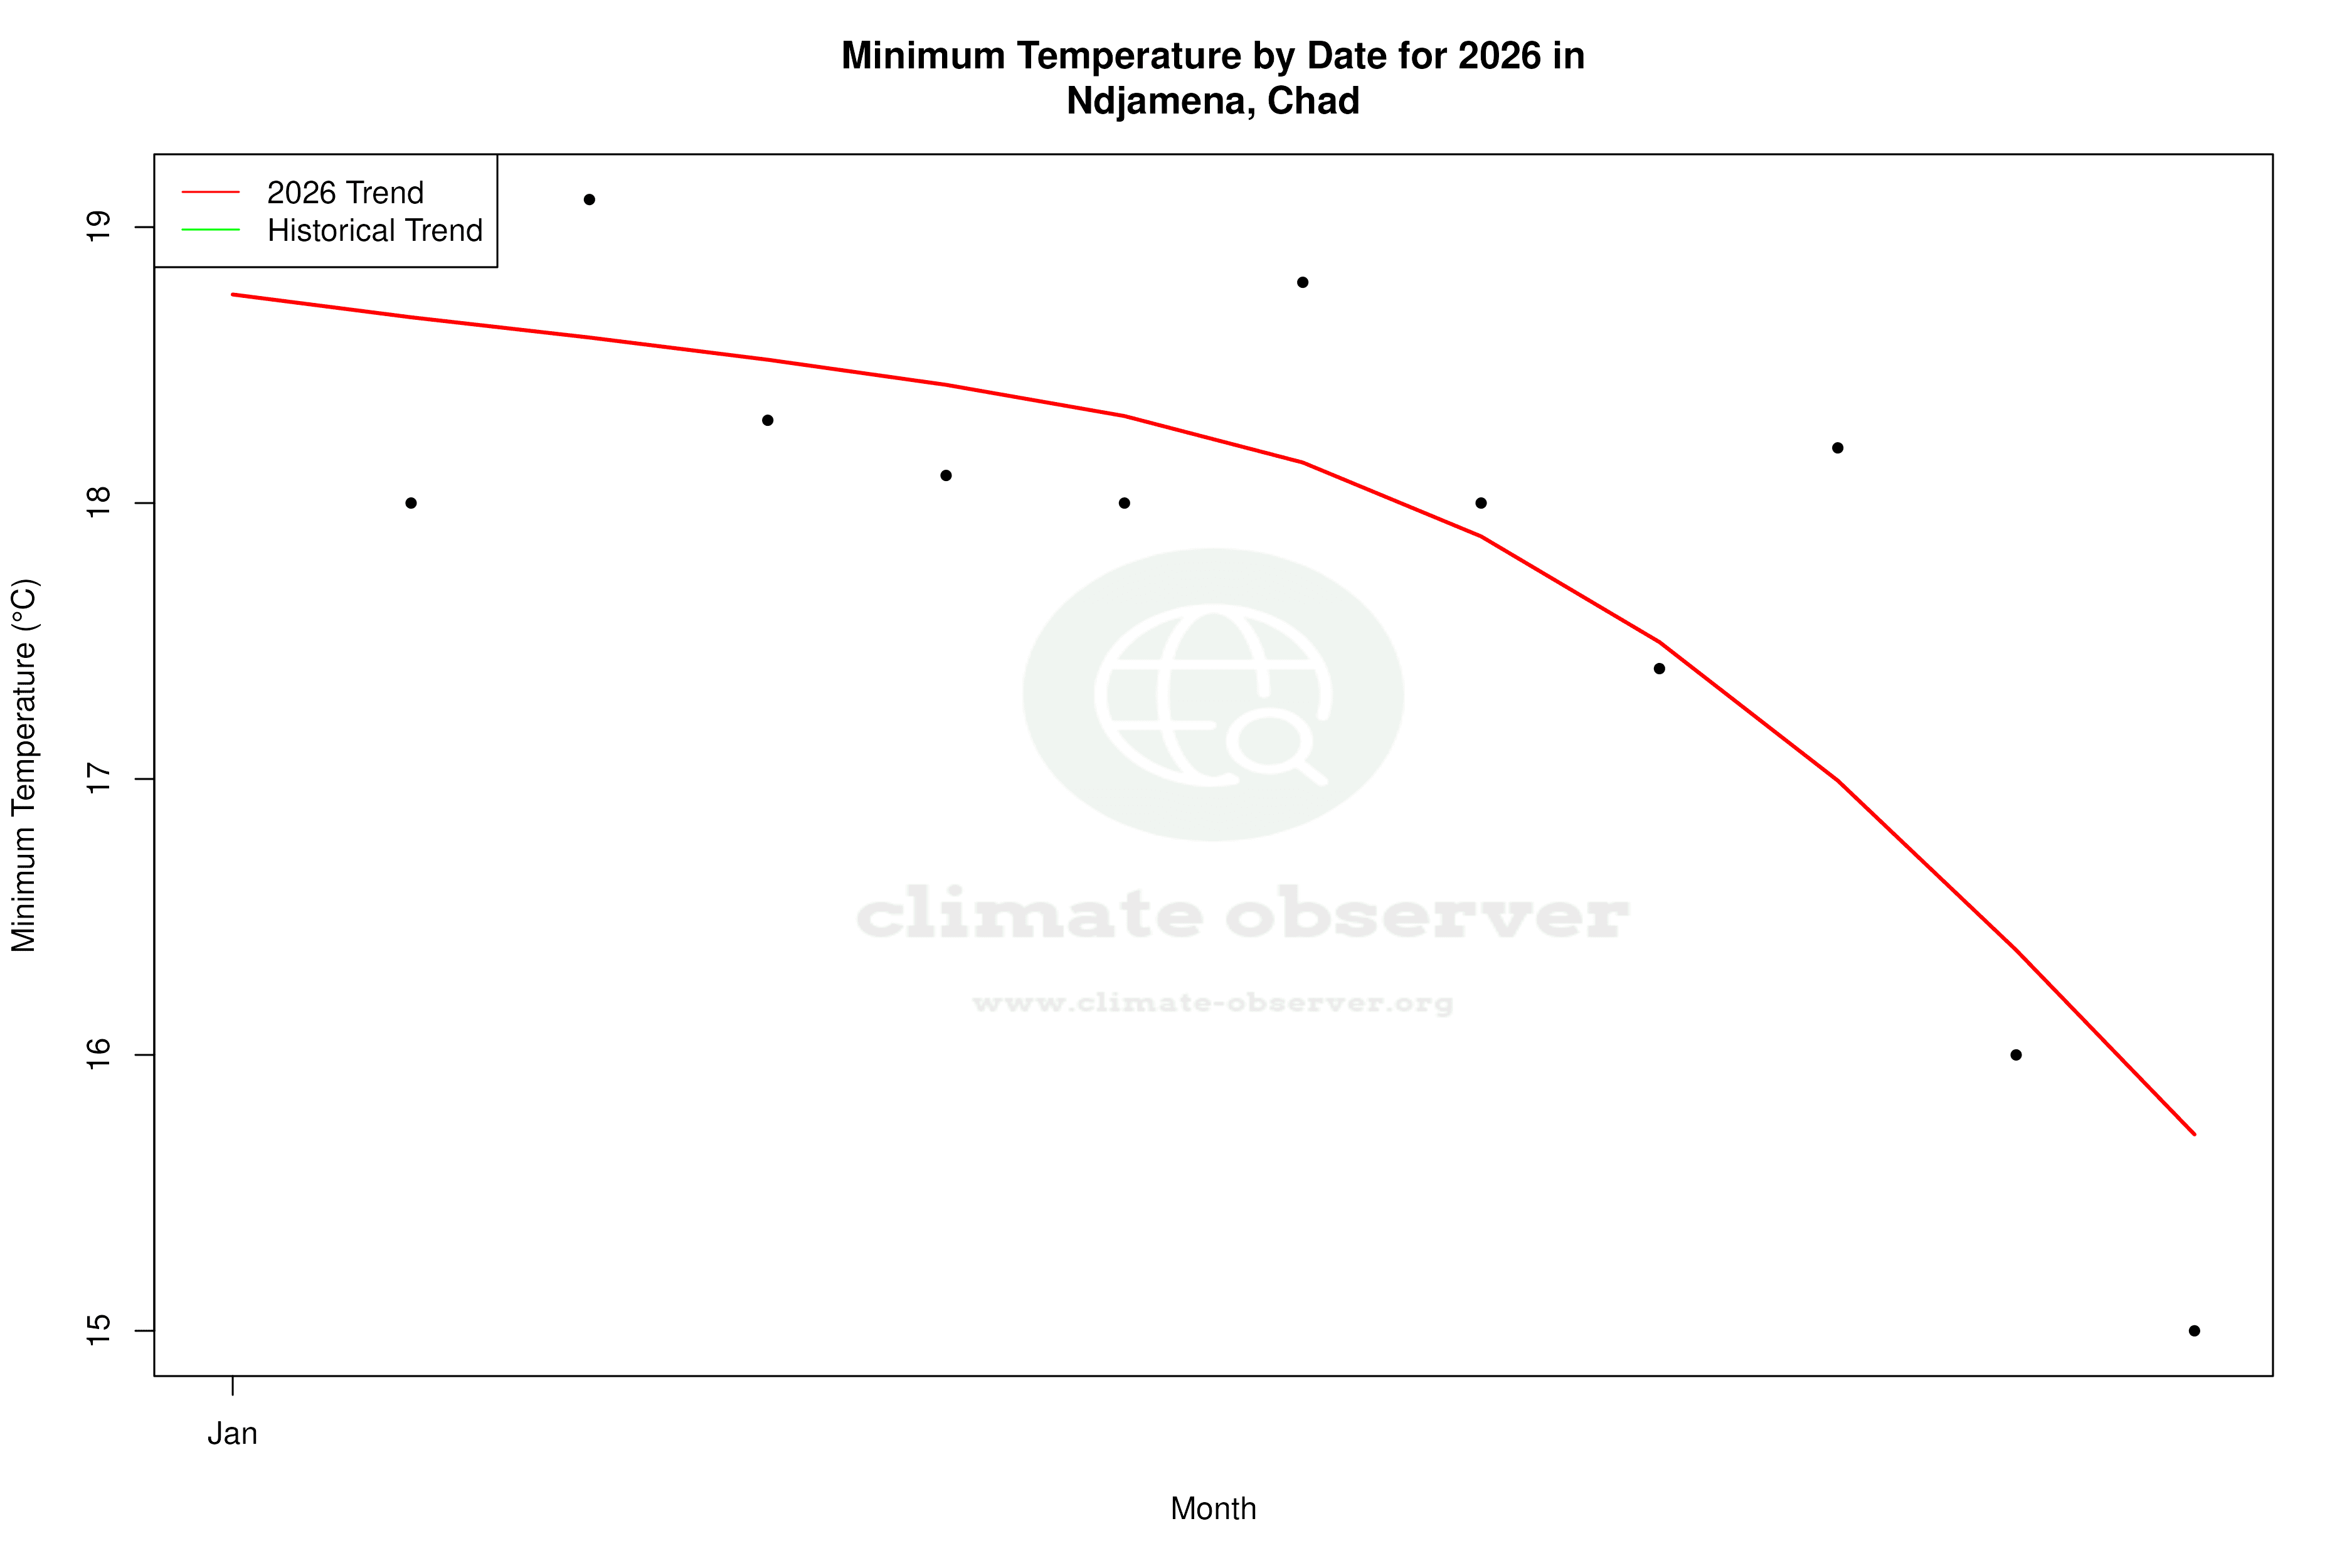
Long-term temperature trends in N'Djamena show a warming pattern. The all-time highs have risen by 0.18°C (0.32°F), while the lows have increased by 0.26°C (0.47°F). This indicates a gradual warming over the decades. However, the past ten years present a contrasting picture, with a cooling trend observed. Highs have decreased by 0.14°C (0.25°F), and lows have fallen more significantly by 0.71°C (1.28°F). This recent cooling, particularly in nighttime temperatures, may be attributed to regional climatic variations or changes in atmospheric circulation patterns.
Record Extremes: The Limits of Heat and Cold
N'Djamena experiences extreme temperatures, with a record high of 50.0°C (122.0°F) and a record low of 6.5°C (43.7°F). These extremes highlight the city's vulnerability to temperature fluctuations, which can have significant impacts on local agriculture and water resources. The high temperatures are typical of the region's dry season, while the cooler extremes are less common but can occur during the brief winter months.
Precipitation Patterns: Intensifying Events
The Precipitation Concentration Index (PCI) for N'Djamena has increased from a baseline of 25.3 to a current value of 28.9. This significant rise indicates that precipitation is becoming more concentrated in fewer, more intense events. Such a pattern can lead to challenges in water management and increase the risk of flooding during the rainy season. The city's infrastructure and agricultural practices must adapt to these changing precipitation dynamics to mitigate potential adverse effects.
Regional Climate Context and Implications
Chad's climate goals focus on adapting to changing weather patterns and enhancing resilience against climate variability. Recent weather events, such as intense rainfall and prolonged dry spells, underscore the importance of these goals. N'Djamena's climate profile, with its mix of long-term warming and recent cooling trends, coupled with increasingly concentrated precipitation, reflects the broader challenges faced by the region in managing climate impacts effectively.
Station Statistics
10-Year Trend
High: -0.14 °C/decade
Low: -0.70 °C/decade
Rain: -0.83 mm/decade
25-Year Trend
High: -0.30 °C/decade
Low: -0.08 °C/decade
Rain: +0.11 mm/decade
50-Year Trend
High: +0.29 °C/decade
Low: +0.20 °C/decade
Rain: +0.02 mm/decade
All-Time Trend
High: +0.16 °C/decade
Low: +0.26 °C/decade
Rain: +0.01 mm/decade
Percentage Above-Average Days
Last 12 Months: 60.0%
This Year: 95.0%
Precipitation Concentration Index (PCI) ℹ️
Last 12 Months: 28.3
Historical Average: 26.6
Percentile Rank of Last 12 Months ℹ️
High: 46th percentile
Low: 47th percentile
Rain: 27th percentile
Change in Variance ℹ️
High: +10.8%
Low: -7.2%
Intraday: -2.1%
Data Coverage
87.1%
First Year of Data
1959
Station Location
Historical Weather Records
| Max High | Avg High | Min High | Max Avg | Avg Avg | Min Avg | Max Low | Avg Low | Min Low | Max Precipitation | Avg Precipitation | Max Snow | Avg Snow | |
|---|---|---|---|---|---|---|---|---|---|---|---|---|---|
| Record | 50.0 °C | — | 21.8 °C | 41.4 °C | — | 14.8 °C | 35.0 °C | — | 6.5 °C | 156.2 mm | — | — | — |
| January | 41.8 °C | 33.2 °C | 21.8 °C | 34.1 °C | 23.8 °C | 14.8 °C | 23.2 °C | 14.7 °C | 6.5 °C | 0.1 mm | 0.0 mm | — | — |
| February | 47.6 °C | 36.0 °C | 22.8 °C | 36.2 °C | 26.7 °C | 18.3 °C | 27.0 °C | 17.3 °C | 8.0 °C | 0.5 mm | 0.0 mm | — | — |
| March | 46.5 °C | 39.5 °C | 27.8 °C | 39.0 °C | 30.9 °C | 21.8 °C | 31.0 °C | 21.7 °C | 11.3 °C | 7.4 mm | 0.0 mm | — | — |
| April | 48.3 °C | 41.6 °C | 31.4 °C | 41.4 °C | 33.8 °C | 26.1 °C | 32.5 °C | 25.1 °C | 16.2 °C | 37.1 mm | 0.2 mm | — | — |
| May | 49.1 °C | 40.6 °C | 28.7 °C | 40.2 °C | 33.6 °C | 24.6 °C | 35.0 °C | 26.3 °C | 16.8 °C | 62.2 mm | 1.0 mm | — | — |
| June | 50.0 °C | 37.8 °C | 25.6 °C | 39.3 °C | 31.2 °C | 23.7 °C | 31.0 °C | 25.1 °C | 15.0 °C | 61.3 mm | 2.1 mm | — | — |
| July | 46.0 °C | 33.6 °C | 23.3 °C | 36.5 °C | 28.1 °C | 22.3 °C | 29.1 °C | 23.3 °C | 17.7 °C | 122.2 mm | 5.4 mm | — | — |
| August | 39.4 °C | 31.3 °C | 23.8 °C | 32.0 °C | 26.6 °C | 21.8 °C | 26.5 °C | 22.5 °C | 16.0 °C | 156.2 mm | 6.9 mm | — | — |
| September | 40.6 °C | 33.3 °C | 22.3 °C | 34.6 °C | 27.7 °C | 22.7 °C | 27.5 °C | 22.7 °C | 15.5 °C | 72.8 mm | 3.5 mm | — | — |
| October | 43.6 °C | 36.7 °C | 25.9 °C | 37.0 °C | 29.2 °C | 22.4 °C | 27.8 °C | 21.9 °C | 13.5 °C | 69.4 mm | 0.8 mm | — | — |
| November | 44.2 °C | 36.5 °C | 28.2 °C | 37.0 °C | 27.5 °C | 17.8 °C | 27.3 °C | 18.4 °C | 10.3 °C | 3.3 mm | 0.0 mm | — | — |
| December | 40.5 °C | 33.9 °C | 24.4 °C | 37.0 °C | 24.5 °C | 17.4 °C | 25.5 °C | 15.5 °C | 8.4 °C | 0.2 mm | 0.0 mm | — | — |
Data Visualisations
Remove WatermarksCurrent Year Climate Trends vs Historical


Max Temperature this Year | 1 of 6
Climate 12-Month Moving Averages


Max Temperature 12-Month MA | 1 of 6
Daily Data Points and Averages Throughout the Year


Average Max Temperature Throughout Year | 1 of 5
