Climate for Station: Hambantota, Southern Province, Sri Lanka
Loading live weather...
Climate Analysis & Overview
Hambantota, located in Sri Lanka's Southern Province, exhibits a complex climate narrative with contrasting temperature trends and a notable shift in precipitation patterns. The region, influenced by its coastal geography, is experiencing a cooling trend in maximum temperatures over the long term, while minimum temperatures show a slight warming. Precipitation is becoming more concentrated, hinting at potential impacts on local agriculture and water management strategies.
Coastal Climate Dynamics
Hambantota, situated along the southern coast of Sri Lanka, falls under the Tropical Savanna climate classification (Aw) according to the Köppen system. This classification is characterised by a distinct wet and dry season, influenced heavily by the monsoon winds and the proximity to the Indian Ocean. The local geography, with its coastal plains and occasional inland hills, plays a significant role in modulating the area's climate patterns.
Temperature Trends: A Tale of Two Metrics
Over the past decade, Hambantota has experienced a rise in maximum temperatures by 0.21°C (0.38°F), indicating a short-term warming trend. However, when considering the all-time data, there is a slight cooling of 0.00°C (0.00°F) in maximum temperatures, which suggests a stabilisation or even a reversal of this trend over a longer period. Conversely, minimum temperatures have shown a fall of 0.80°C (1.44°F) over the last ten years, contrasting with a long-term rise of 0.15°C (0.27°F). These divergent trends highlight the complexity of local climate dynamics, possibly influenced by broader regional climatic shifts and localised factors.
Precipitation Patterns: Increasing Concentration
The Precipitation Concentration Index (PCI) for Hambantota has increased from a baseline of 12.5 to a current value of 14.0. This indicates a more concentrated rainfall pattern, where precipitation is occurring in fewer, more intense events. Such a change can have significant implications for water resource management and agricultural practices, potentially leading to periods of drought interspersed with intense rainfall.
Extreme Temperature Records
Hambantota's climate extremes are marked by a record high of 39.2°C (102.6°F) and a record low of 15.6°C (60.1°F). These records underscore the potential for significant temperature variability in the region, which can affect both natural ecosystems and human activities.
Regional Climate Considerations
Sri Lanka's commitment to addressing climate change through national policies and international agreements provides a critical backdrop to Hambantota's climate profile. Recent weather events, such as cyclones and erratic monsoon patterns, further emphasise the need for adaptive strategies in the face of changing climatic conditions. As Hambantota navigates these challenges, understanding its unique climate dynamics will be essential for sustainable development and resilience planning.
Station Statistics
10-Year Trend
High: +0.21 °C/decade
Low: -0.80 °C/decade
Rain: +1.26 mm/decade
25-Year Trend
High: -0.52 °C/decade
Low: +0.37 °C/decade
Rain: -0.36 mm/decade
50-Year Trend
High: -0.14 °C/decade
Low: +0.46 °C/decade
Rain: -0.11 mm/decade
All-Time Trend
High: -0.00 °C/decade
Low: +0.15 °C/decade
Rain: -0.11 mm/decade
Percentage Above-Average Days
Last 12 Months: 29.3%
This Year: 0.0%
Precipitation Concentration Index (PCI) ℹ️
Last 12 Months: 16.9
Historical Average: 14.5
Percentile Rank of Last 12 Months ℹ️
High: 57th percentile
Low: 90th percentile
Rain: 68th percentile
Change in Variance ℹ️
High: +40.3%
Low: -43.5%
Intraday: +24.6%
Data Coverage
61.3%
First Year of Data
1869
Station Location
Historical Weather Records
| Max High | Avg High | Min High | Max Avg | Avg Avg | Min Avg | Max Low | Avg Low | Min Low | Max Precipitation | Avg Precipitation | Max Snow | Avg Snow | |
|---|---|---|---|---|---|---|---|---|---|---|---|---|---|
| Record | 39.2 °C | — | 23.0 °C | 31.9 °C | — | 21.8 °C | 29.0 °C | — | 16.2 °C | 111.0 mm | — | — | — |
| January | 34.7 °C | 29.7 °C | 23.0 °C | 29.8 °C | 26.5 °C | 21.8 °C | 26.8 °C | 22.8 °C | 17.7 °C | 89.0 mm | 2.4 mm | — | — |
| February | 35.7 °C | 30.3 °C | 24.1 °C | 30.5 °C | 27.0 °C | 23.6 °C | 27.4 °C | 23.0 °C | 16.2 °C | 70.3 mm | 1.6 mm | — | — |
| March | 35.3 °C | 30.9 °C | 25.1 °C | 30.8 °C | 27.9 °C | 23.6 °C | 27.9 °C | 23.8 °C | 17.7 °C | 48.6 mm | 1.9 mm | — | — |
| April | 36.0 °C | 31.3 °C | 25.6 °C | 31.4 °C | 28.3 °C | 24.5 °C | 29.0 °C | 24.9 °C | 19.4 °C | 68.6 mm | 3.4 mm | — | — |
| May | 36.4 °C | 30.7 °C | 24.7 °C | 31.9 °C | 28.2 °C | 24.5 °C | 28.8 °C | 25.5 °C | 20.1 °C | 61.5 mm | 3.3 mm | — | — |
| June | 37.2 °C | 30.4 °C | 24.2 °C | 31.5 °C | 27.9 °C | 22.2 °C | 28.3 °C | 25.1 °C | 21.2 °C | 70.1 mm | 2.1 mm | — | — |
| July | 36.3 °C | 30.7 °C | 25.0 °C | 31.6 °C | 27.8 °C | 23.0 °C | 28.9 °C | 24.8 °C | 21.2 °C | 48.7 mm | 1.6 mm | — | — |
| August | 39.2 °C | 30.4 °C | 24.7 °C | 31.4 °C | 27.5 °C | 24.2 °C | 28.3 °C | 24.6 °C | 20.4 °C | 54.1 mm | 2.3 mm | — | — |
| September | 36.5 °C | 30.1 °C | 24.4 °C | 31.0 °C | 27.4 °C | 23.2 °C | 27.6 °C | 24.6 °C | 20.6 °C | 78.7 mm | 3.7 mm | — | — |
| October | 36.9 °C | 30.1 °C | 24.4 °C | 30.7 °C | 27.3 °C | 24.0 °C | 27.5 °C | 24.3 °C | 20.2 °C | 102.1 mm | 4.8 mm | — | — |
| November | 36.7 °C | 29.9 °C | 24.2 °C | 29.8 °C | 26.9 °C | 23.2 °C | 27.2 °C | 23.7 °C | 19.6 °C | 103.9 mm | 6.9 mm | — | — |
| December | 34.8 °C | 29.5 °C | 24.1 °C | 29.1 °C | 26.5 °C | 22.7 °C | 27.3 °C | 23.2 °C | 18.2 °C | 111.0 mm | 4.6 mm | — | — |
Data Visualisations
Remove WatermarksCurrent Year Climate Trends vs Historical


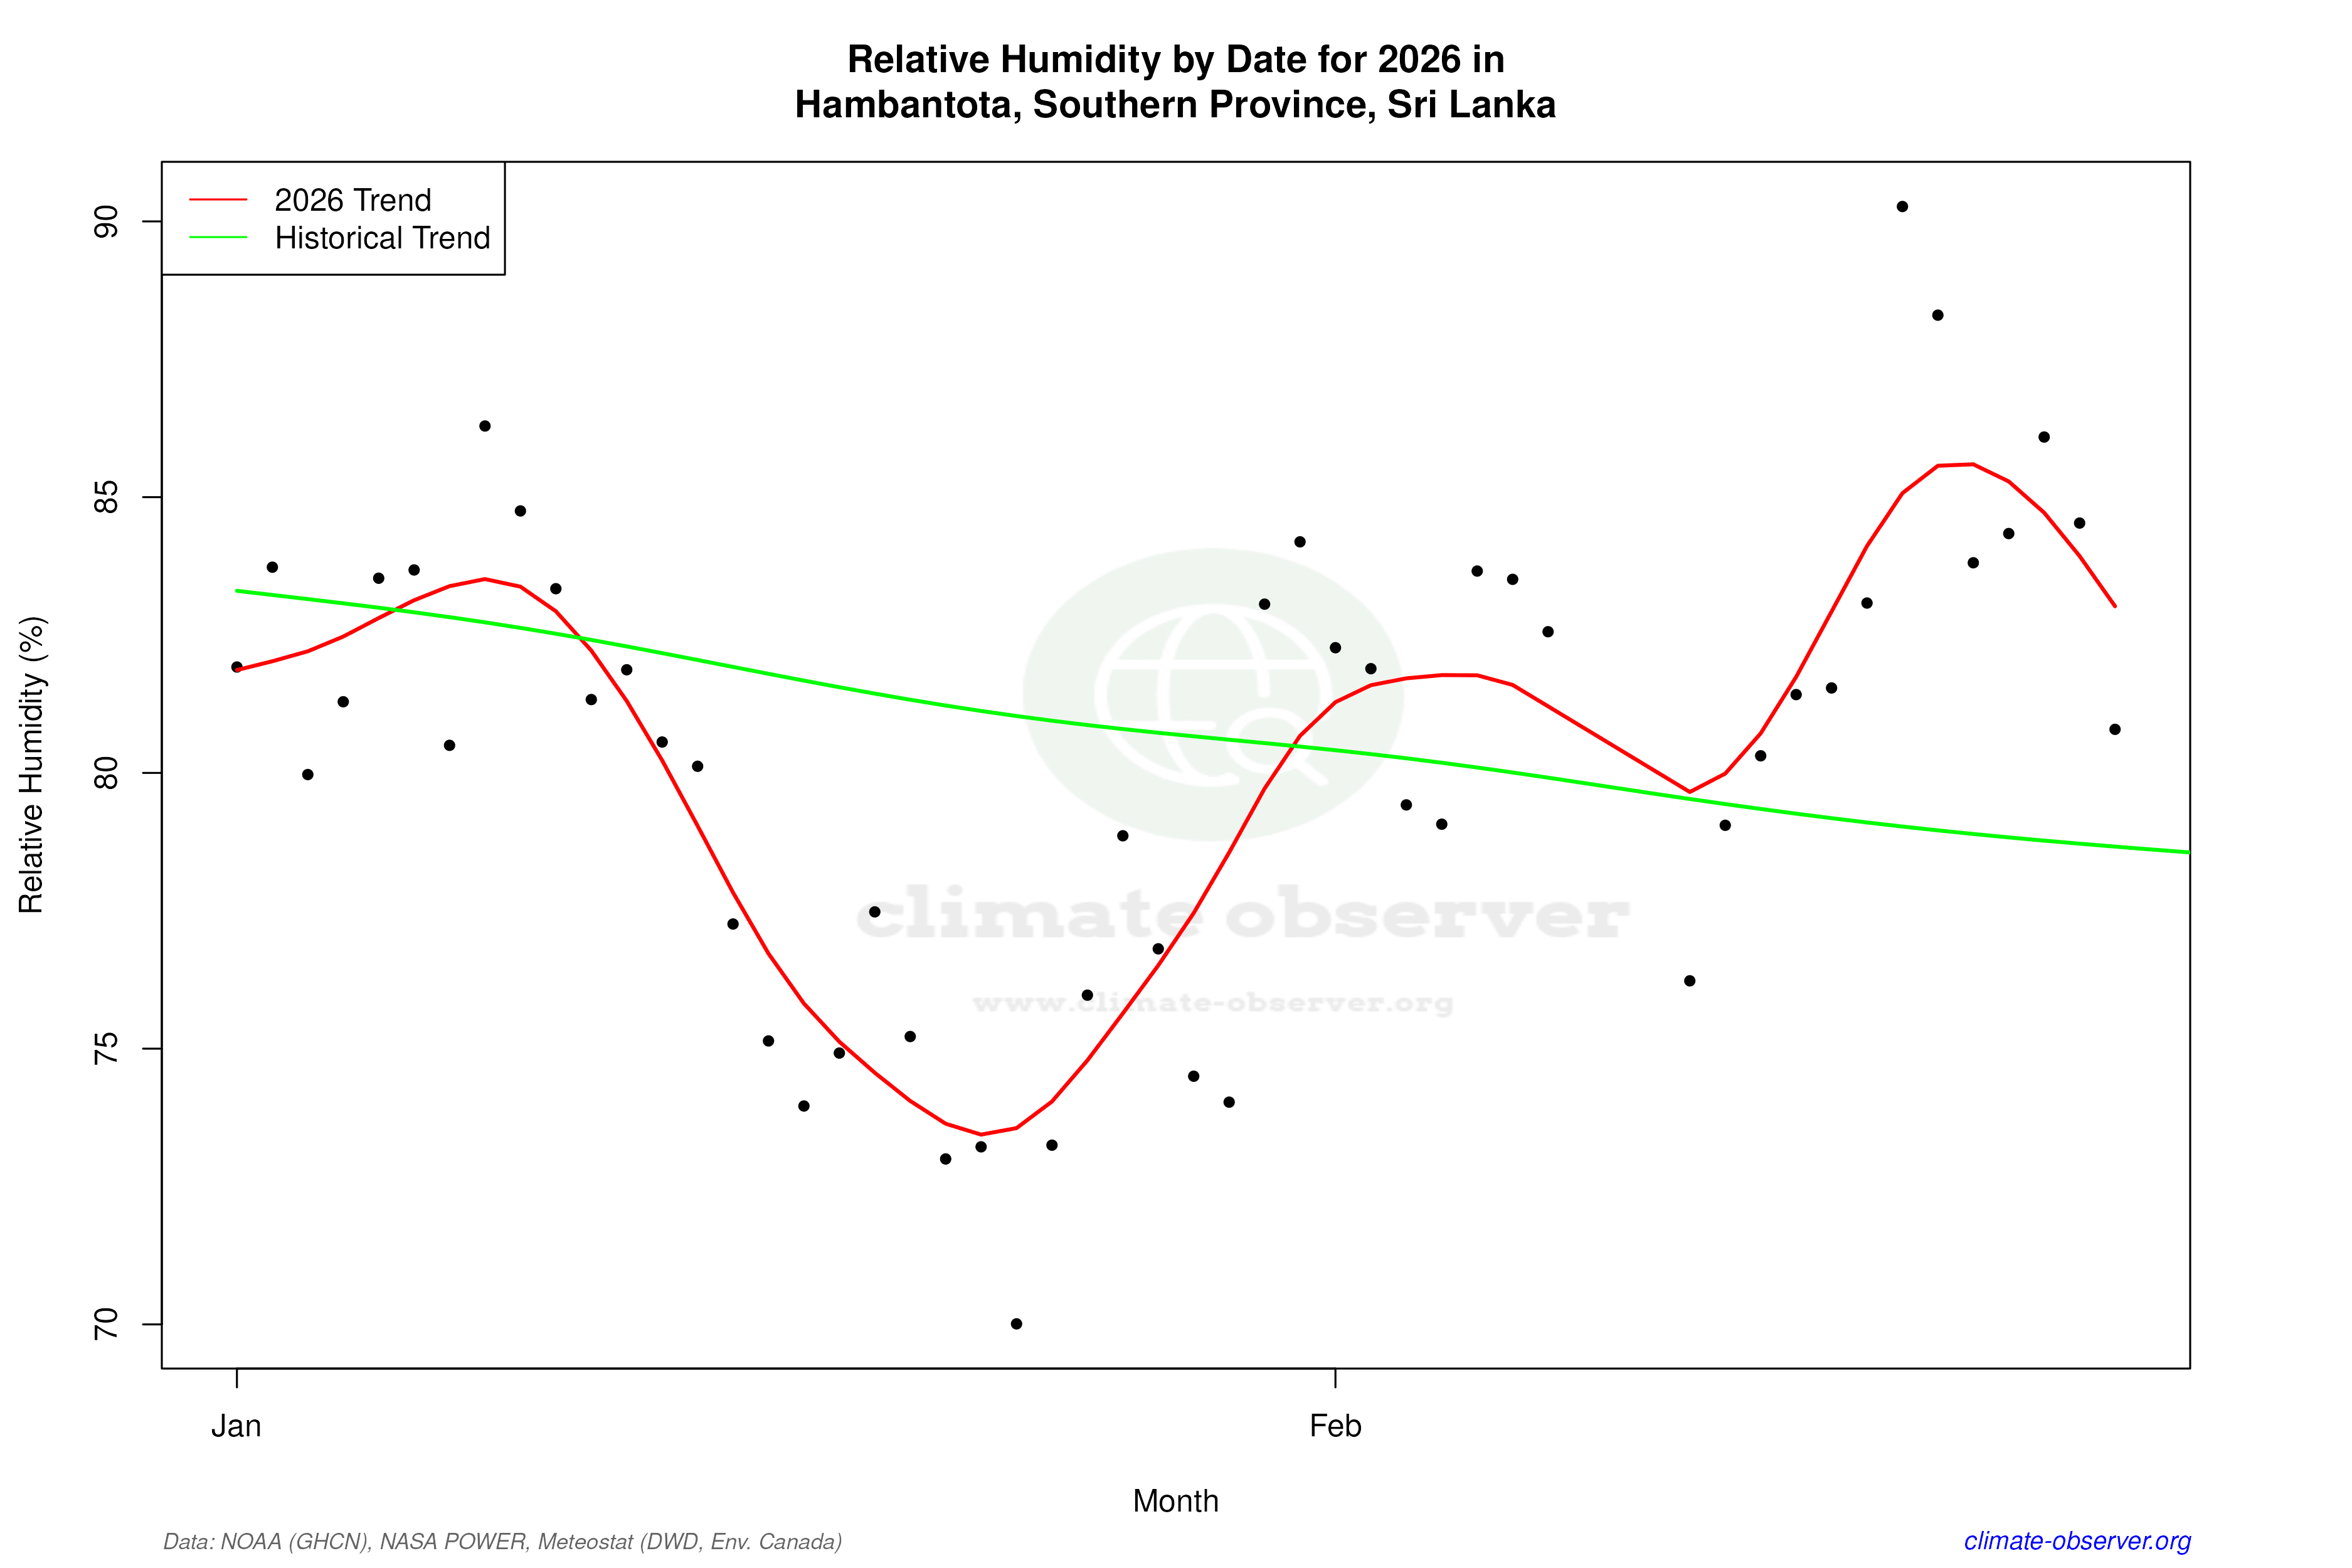

Max Temperature this Year | 1 of 6
Climate 12-Month Moving Averages


Max Temperature 12-Month MA | 1 of 6
Daily Data Points and Averages Throughout the Year


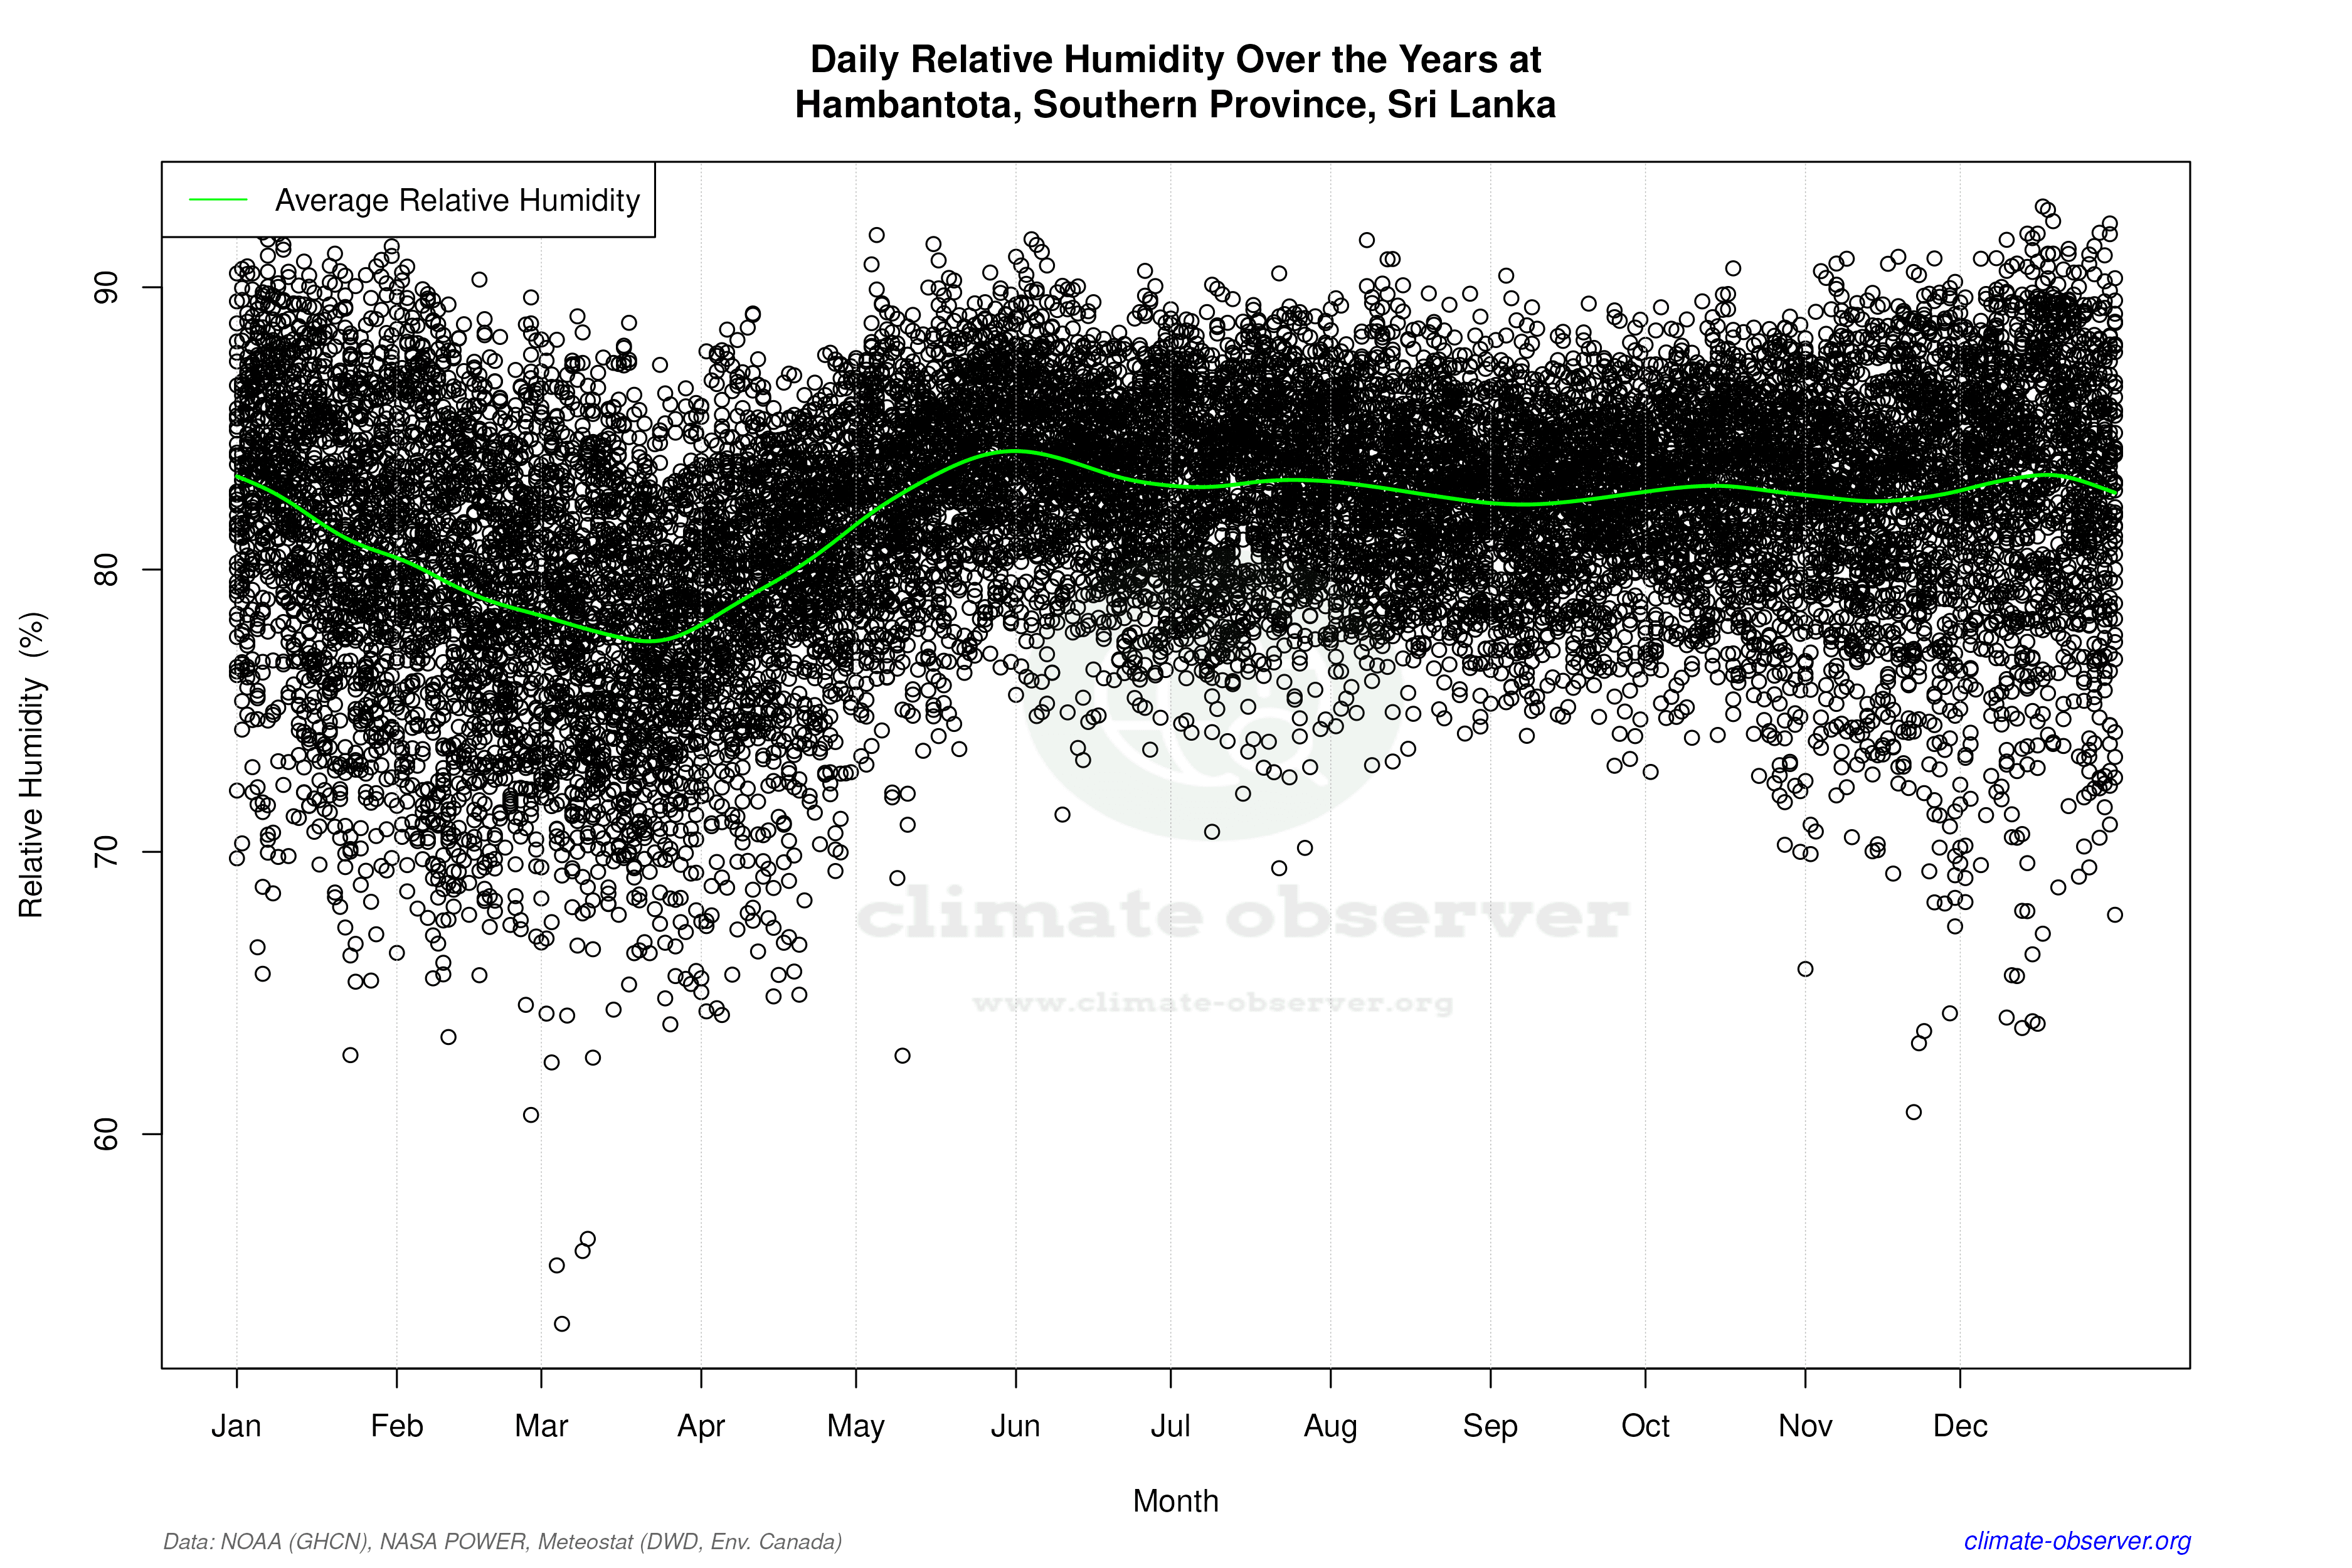

Average Max Temperature Throughout Year | 1 of 5
