Climate for Station: Brazzaville, Congo (Brazzaville)
Loading live weather...
Climate Analysis & Overview
Brazzaville's climate is experiencing a juxtaposition of warming highs and cooling lows over the past decade, with a more consistent distribution of precipitation. While the long-term trend suggests a gradual warming, recent years exhibit contrasting short-term patterns.
Köppen Climate and Geographic Influence
Brazzaville, located at -4.25, 15.25, falls under the Köppen climate classification of Aw, indicating a tropical savanna climate with a distinct wet and dry season. The city's proximity to the Congo River plays a significant role in moderating temperatures and influencing humidity levels, contributing to its lush vegetation and biodiversity. The river's presence helps maintain relatively stable temperatures, which is reflected in the historical climate data.
Temperature Trends: A Tale of Two Scales
Over the past decade, Brazzaville has experienced a warming trend in daily high temperatures, with an increase of 0.63°C (1.13°F). This contrasts with a cooling trend in the lows, which have decreased by 0.33°C (0.59°F). However, when examining the all-time trends, both highs and lows show a warming pattern with increases of 0.22°C (0.40°F) and 0.31°C (0.56°F), respectively. This suggests that while recent years have shown variability, the long-term trajectory is toward warming.
Precipitation Patterns: A More Even Distribution
The Precipitation Concentration Index (PCI) for Brazzaville has shown a slight decrease from a baseline of 14.05 to a current value of 13.52. This indicates a more even distribution of rainfall events over time. In practical terms, this means that rainfall is less concentrated in intense events and is more evenly spread throughout the seasons, which can be beneficial for agriculture and water management.
Record Extremes: A City of Contrasts
Brazzaville's climate records highlight the city's potential for extreme temperatures. The highest recorded temperature is 40.2°C (104.4°F), while the lowest is 10.3°C (50.5°F). These extremes underscore the variability inherent in a tropical savanna climate, where seasonal shifts can lead to significant temperature variations.
Regional Climate Goals and Implications
In the context of regional climate goals, Brazzaville's trends are crucial. The city is part of the broader Congo Basin, which plays a vital role in global carbon storage and biodiversity. Understanding local climate dynamics is essential for informing sustainable development and conservation strategies. Recent weather events, such as unseasonal rainfall or prolonged dry spells, can have profound impacts on both urban and rural communities, highlighting the importance of adaptive strategies in response to climate variability.
Station Statistics
10-Year Trend
High: +0.48 °C/decade
Low: -0.25 °C/decade
Rain: -1.38 mm/decade
25-Year Trend
High: +0.33 °C/decade
Low: +0.31 °C/decade
Rain: -0.11 mm/decade
50-Year Trend
High: +0.35 °C/decade
Low: +0.34 °C/decade
Rain: +0.05 mm/decade
All-Time Trend
High: +0.22 °C/decade
Low: +0.31 °C/decade
Rain: +0.16 mm/decade
Percentage Above-Average Days
Last 12 Months: 64.4%
This Year: 61.5%
Precipitation Concentration Index (PCI) ℹ️
Last 12 Months: 12.2
Historical Average: 13.8
Percentile Rank of Last 12 Months ℹ️
High: 87th percentile
Low: 87th percentile
Rain: 46th percentile
Change in Variance ℹ️
High: -14.8%
Low: -35.2%
Intraday: -15.6%
Data Coverage
88.6%
First Year of Data
1947
Station Location
Historical Weather Records
| Max High | Avg High | Min High | Max Avg | Avg Avg | Min Avg | Max Low | Avg Low | Min Low | Max Precipitation | Avg Precipitation | Max Snow | Avg Snow | |
|---|---|---|---|---|---|---|---|---|---|---|---|---|---|
| Record | 40.2 °C | — | 20.1 °C | 32.4 °C | — | 16.2 °C | 26.2 °C | — | 10.3 °C | 226.1 mm | — | — | — |
| January | 37.5 °C | 30.4 °C | 23.1 °C | 31.5 °C | 26.0 °C | 19.8 °C | 26.0 °C | 21.7 °C | 16.7 °C | 143.0 mm | 5.3 mm | — | — |
| February | 37.0 °C | 31.1 °C | 23.2 °C | 30.7 °C | 26.3 °C | 21.8 °C | 26.2 °C | 21.8 °C | 14.5 °C | 129.0 mm | 5.5 mm | — | — |
| March | 37.5 °C | 31.7 °C | 23.4 °C | 32.4 °C | 26.6 °C | 19.0 °C | 26.0 °C | 22.0 °C | 15.2 °C | 136.9 mm | 6.5 mm | — | — |
| April | 37.0 °C | 31.7 °C | 23.8 °C | 31.9 °C | 26.5 °C | 19.7 °C | 26.0 °C | 22.1 °C | 18.3 °C | 161.0 mm | 6.9 mm | — | — |
| May | 37.3 °C | 30.8 °C | 23.6 °C | 31.5 °C | 26.1 °C | 20.8 °C | 26.0 °C | 21.8 °C | 16.1 °C | 138.9 mm | 4.4 mm | — | — |
| June | 35.0 °C | 28.6 °C | 20.1 °C | 28.4 °C | 24.0 °C | 18.4 °C | 24.0 °C | 19.5 °C | 12.7 °C | 57.5 mm | 0.4 mm | — | — |
| July | 33.8 °C | 27.5 °C | 21.1 °C | 28.8 °C | 23.0 °C | 17.6 °C | 23.0 °C | 18.2 °C | 10.5 °C | 13.7 mm | 0.1 mm | — | — |
| August | 40.2 °C | 28.9 °C | 20.9 °C | 29.3 °C | 24.1 °C | 16.2 °C | 24.0 °C | 19.1 °C | 10.3 °C | 19.9 mm | 0.3 mm | — | — |
| September | 39.5 °C | 30.6 °C | 21.8 °C | 30.9 °C | 25.7 °C | 20.2 °C | 25.0 °C | 20.8 °C | 15.2 °C | 67.8 mm | 1.6 mm | — | — |
| October | 38.9 °C | 30.7 °C | 23.2 °C | 30.2 °C | 25.9 °C | 20.8 °C | 25.8 °C | 21.6 °C | 14.5 °C | 100.0 mm | 5.2 mm | — | — |
| November | 36.0 °C | 30.4 °C | 22.2 °C | 31.8 °C | 25.6 °C | 20.5 °C | 25.0 °C | 21.6 °C | 18.2 °C | 226.1 mm | 9.3 mm | — | — |
| December | 40.2 °C | 30.1 °C | 22.2 °C | 32.3 °C | 25.6 °C | 20.4 °C | 25.0 °C | 21.6 °C | 17.7 °C | 145.0 mm | 6.8 mm | — | — |
Data Visualisations
Remove WatermarksCurrent Year Climate Trends vs Historical


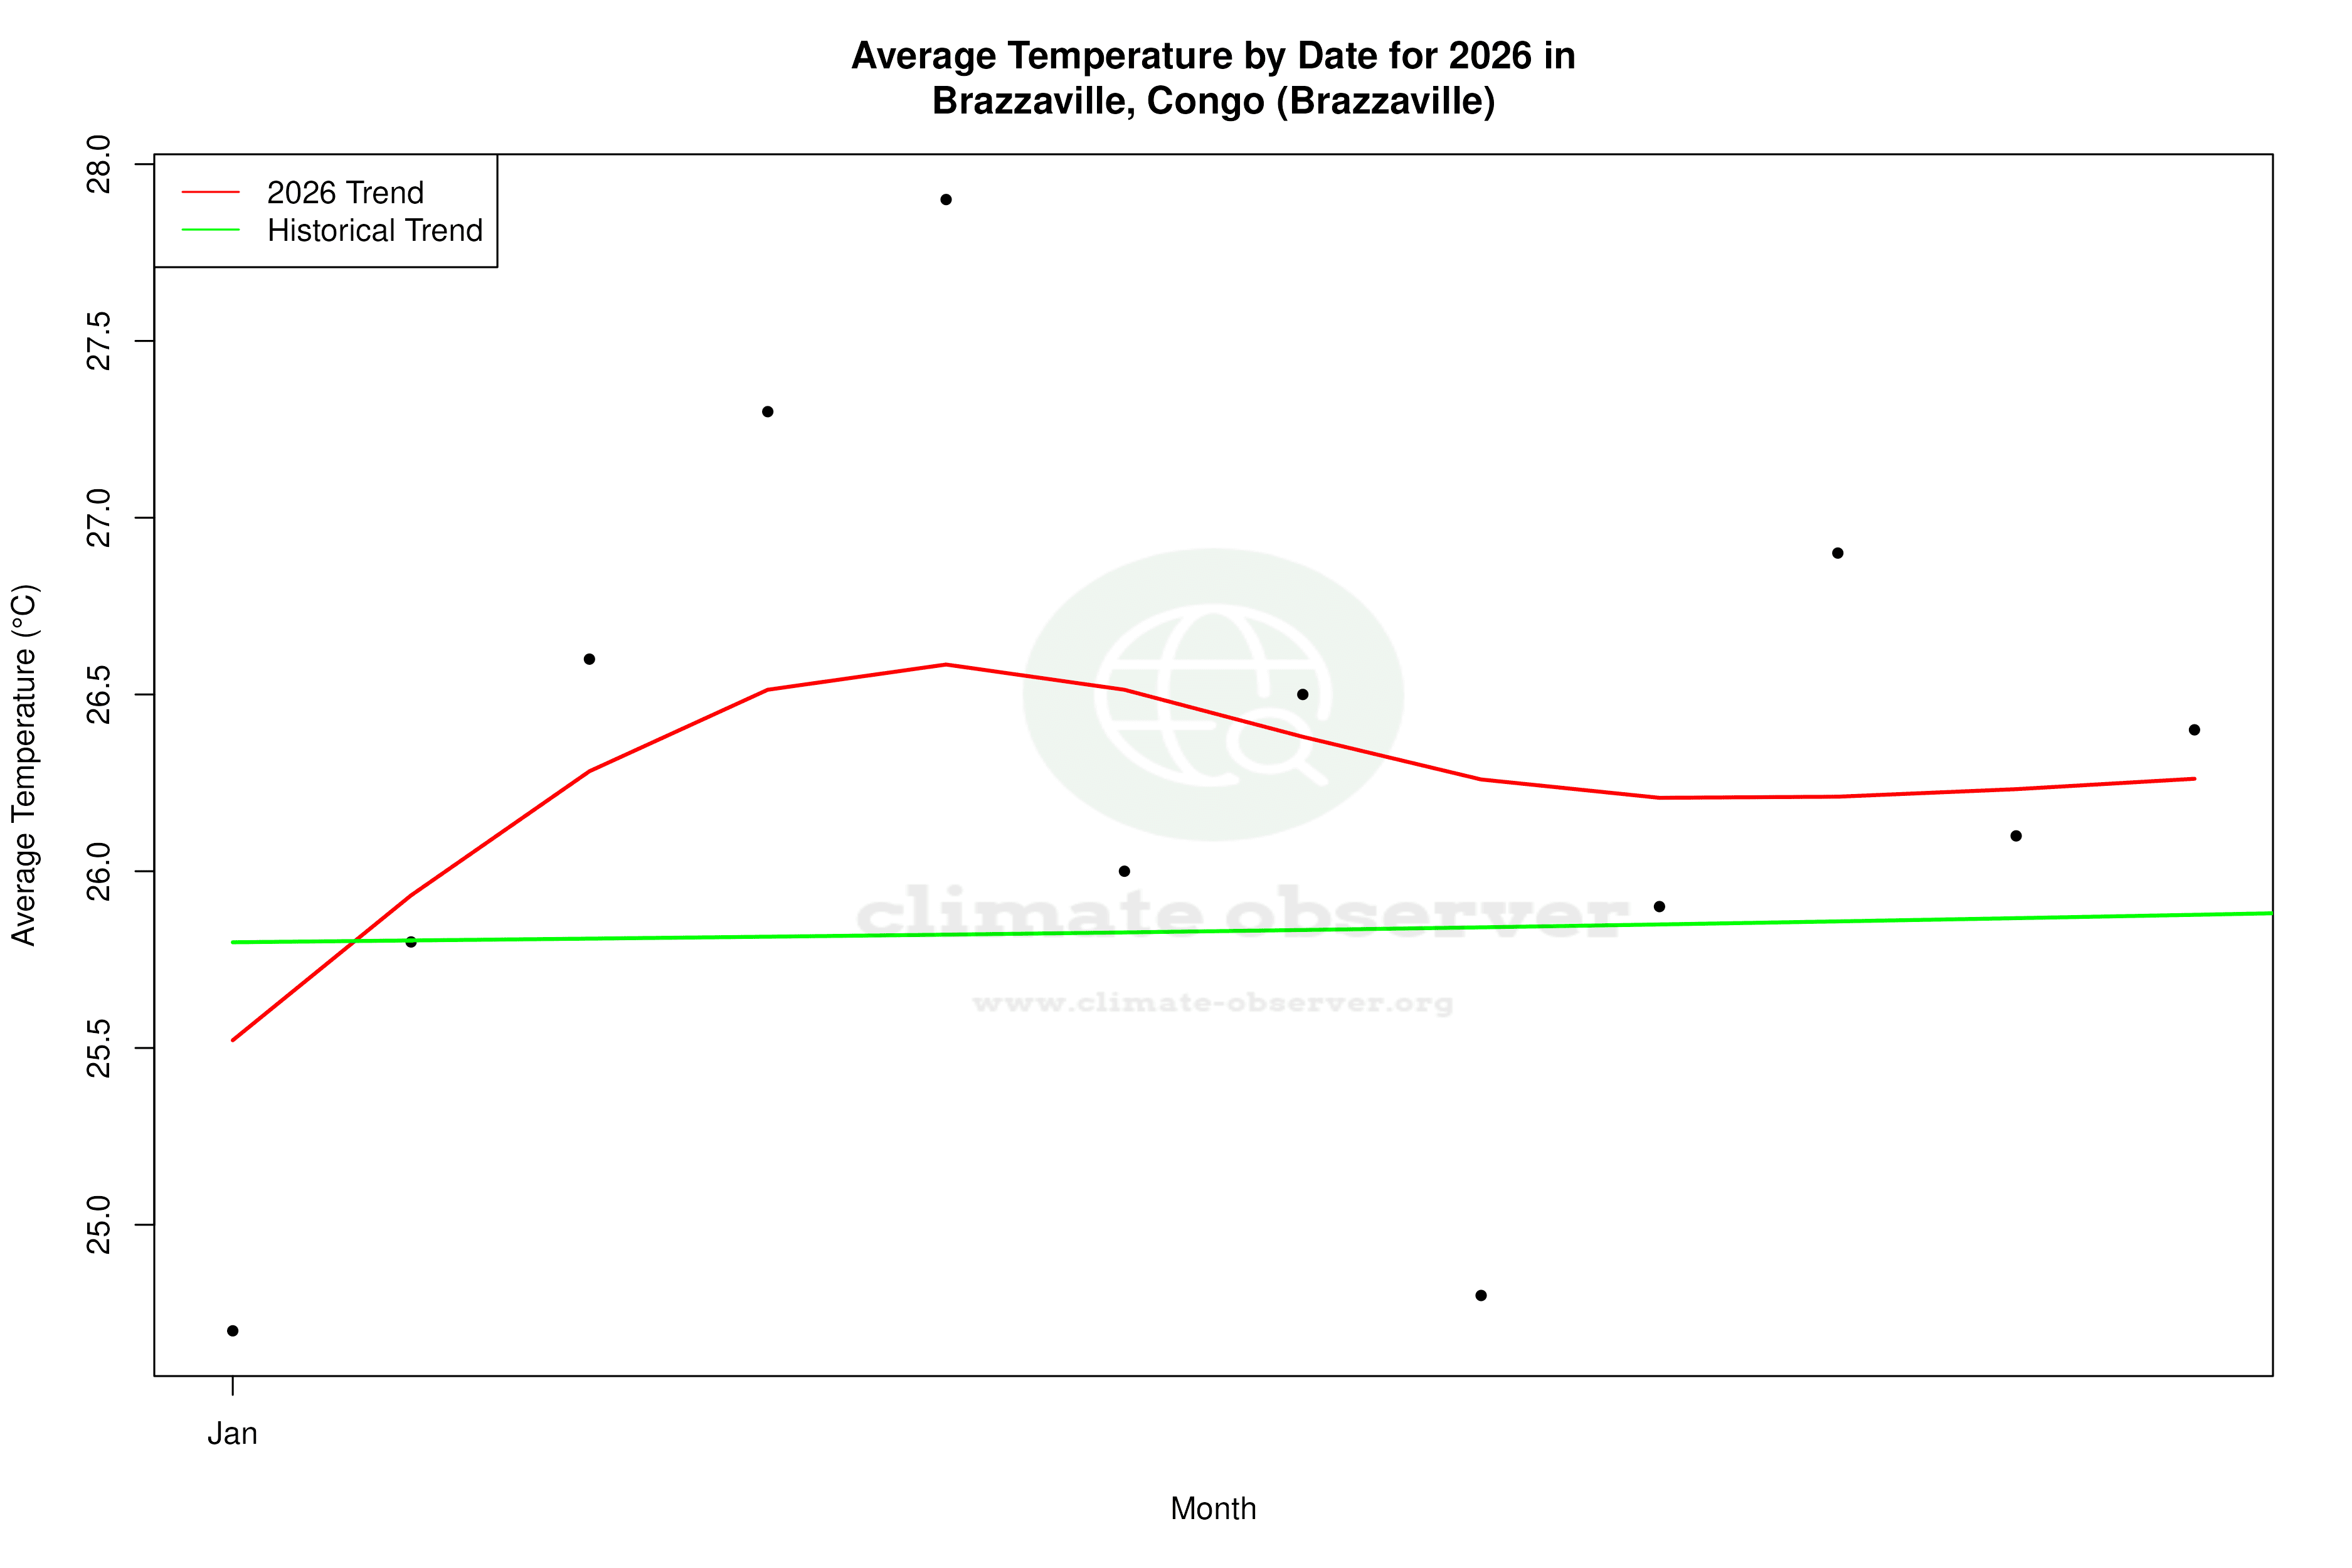


Max Temperature this Year | 1 of 6
Climate 12-Month Moving Averages


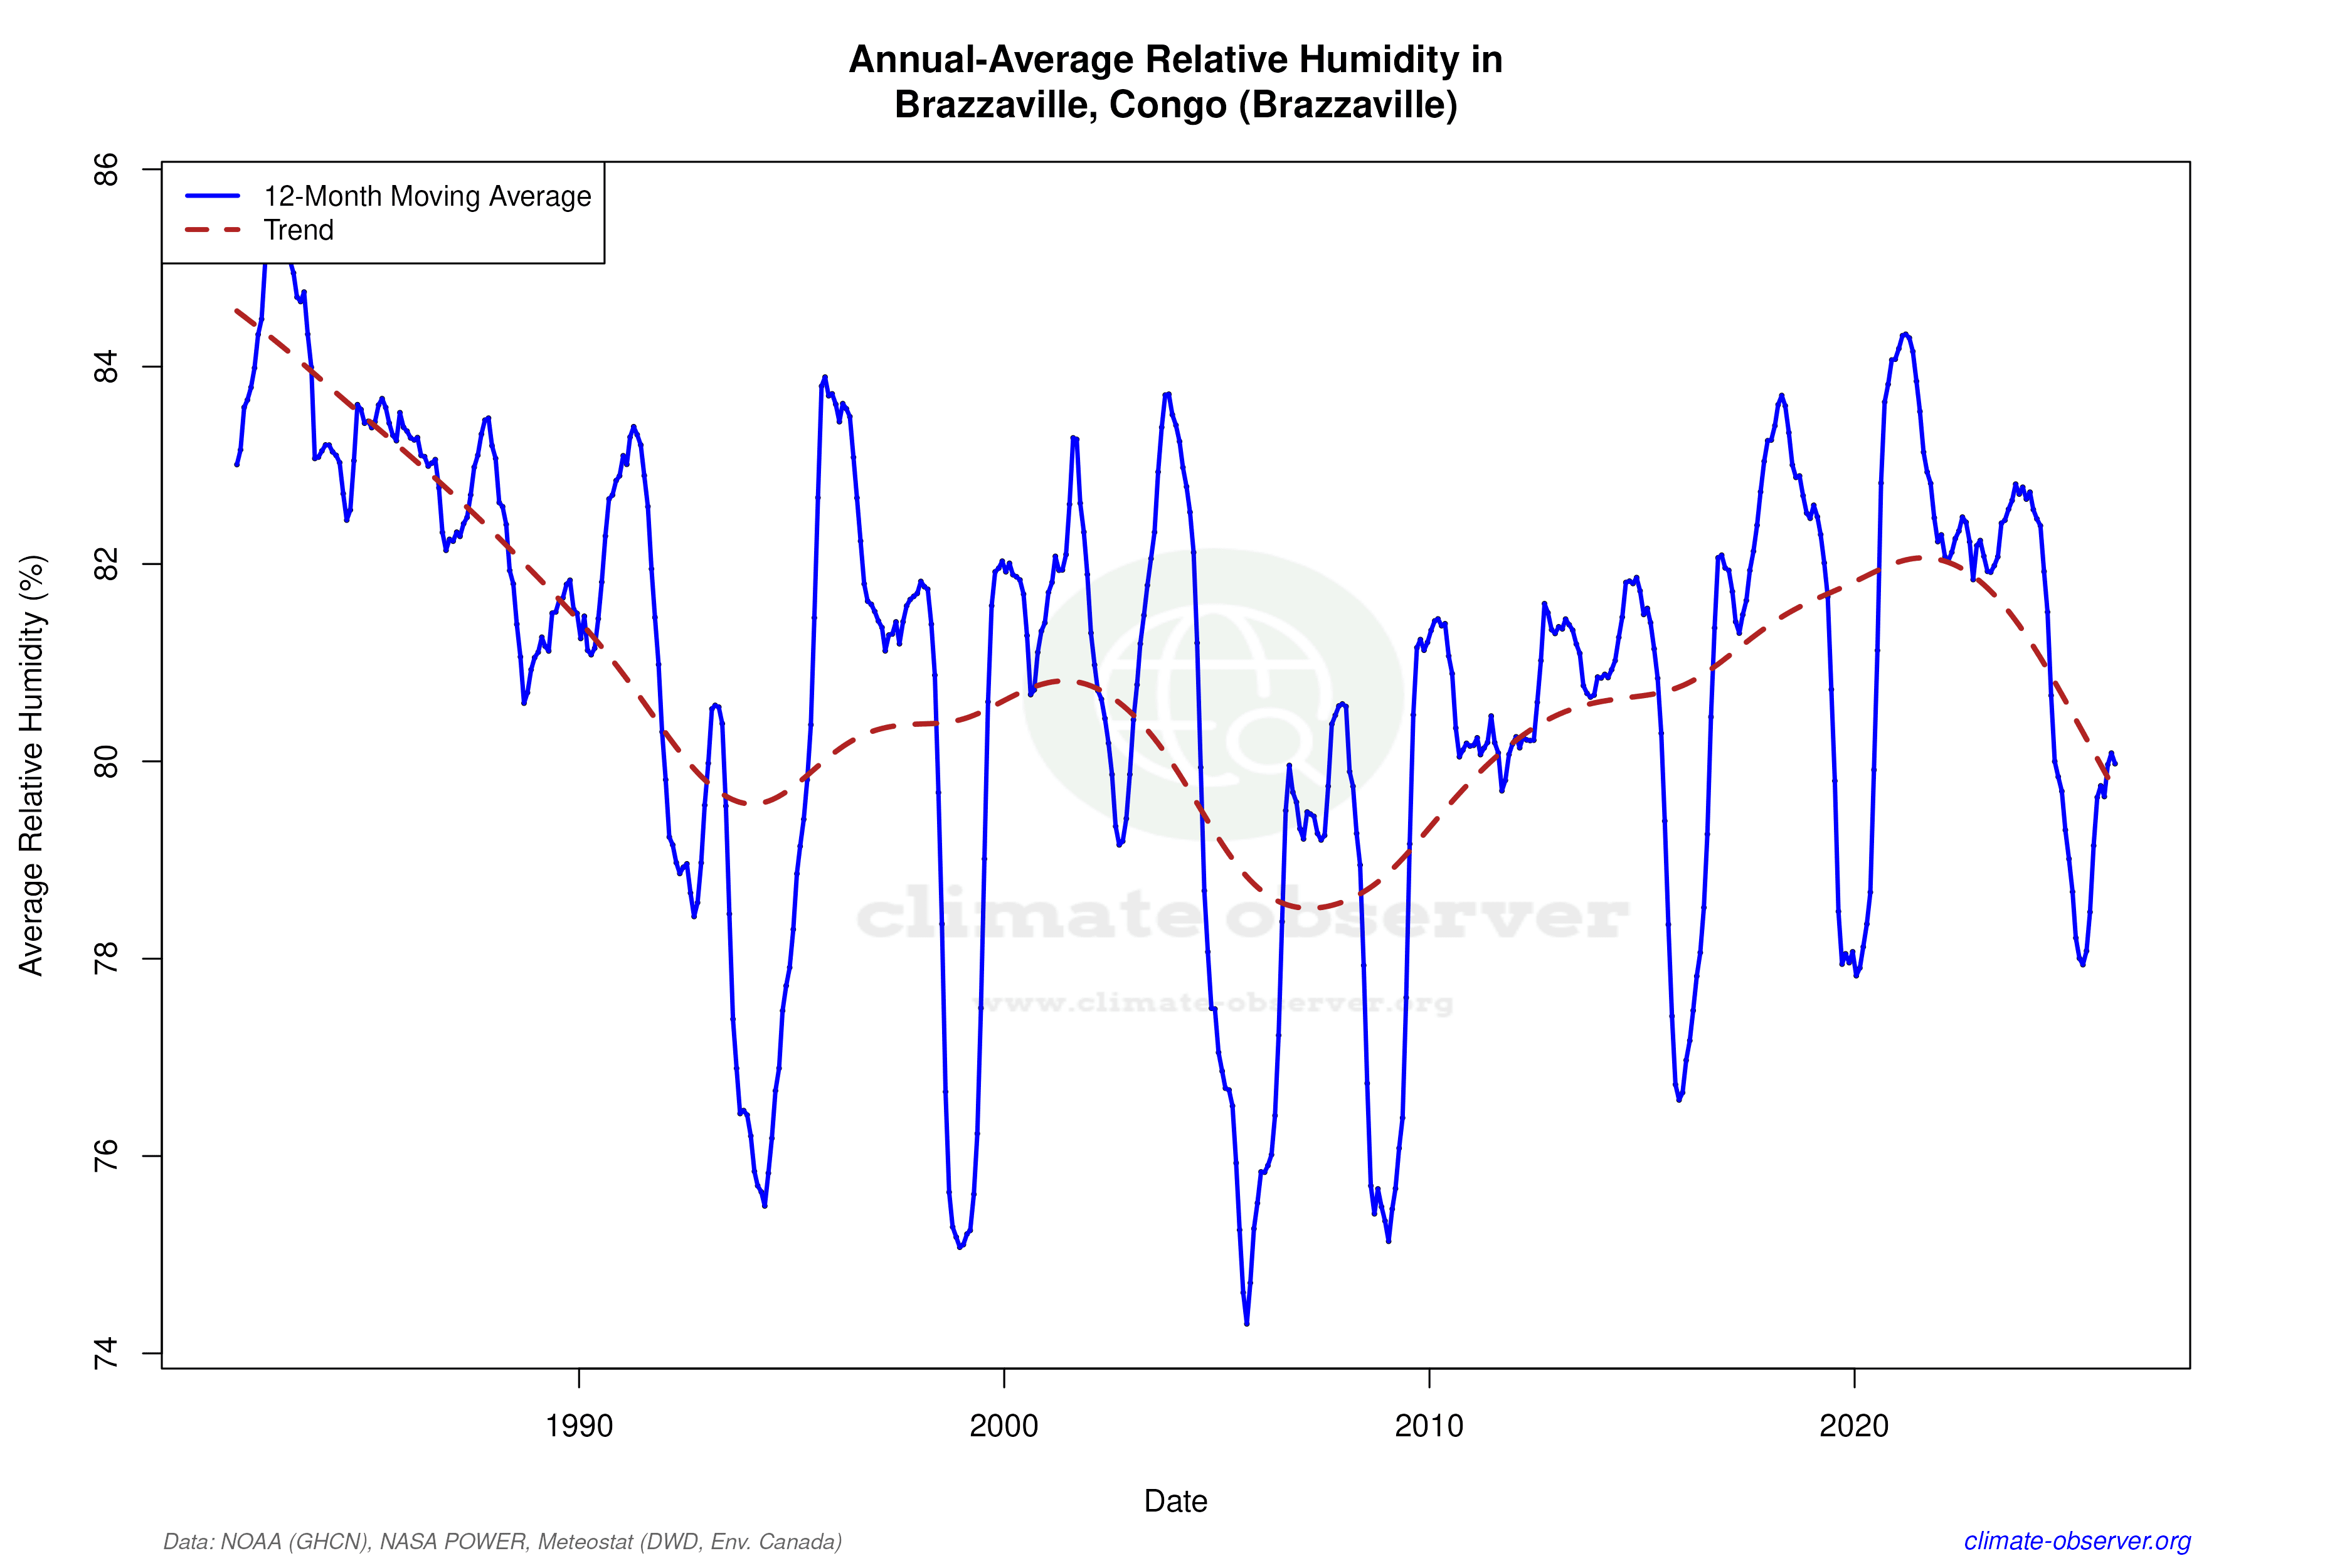

Max Temperature 12-Month MA | 1 of 6
Daily Data Points and Averages Throughout the Year


Average Max Temperature Throughout Year | 1 of 5
