Climate for Station: Lubumbashi Intl, Haut Katanga, Congo (Kinshasa)
Loading live weather...
Climate Analysis & Overview
Lubumbashi International Airport is experiencing a nuanced climate evolution, with a notable warming trend in low temperatures over the past decade. The Precipitation Concentration Index shows a shift towards more evenly distributed rainfall, indicating potential changes in local hydrological patterns.
Köppen Climate Contextualisation
Lubumbashi, located in the southern part of the Democratic Republic of the Congo, falls under the Köppen climate classification of Cwa, which denotes a subtropical highland climate with dry winters. The region's climate is influenced by its elevation and proximity to the Lufira River, contributing to its distinct wet and dry seasons. The local geography plays a crucial role in shaping the climate data observed at Lubumbashi International Airport.
Temperature Trends and Trajectories
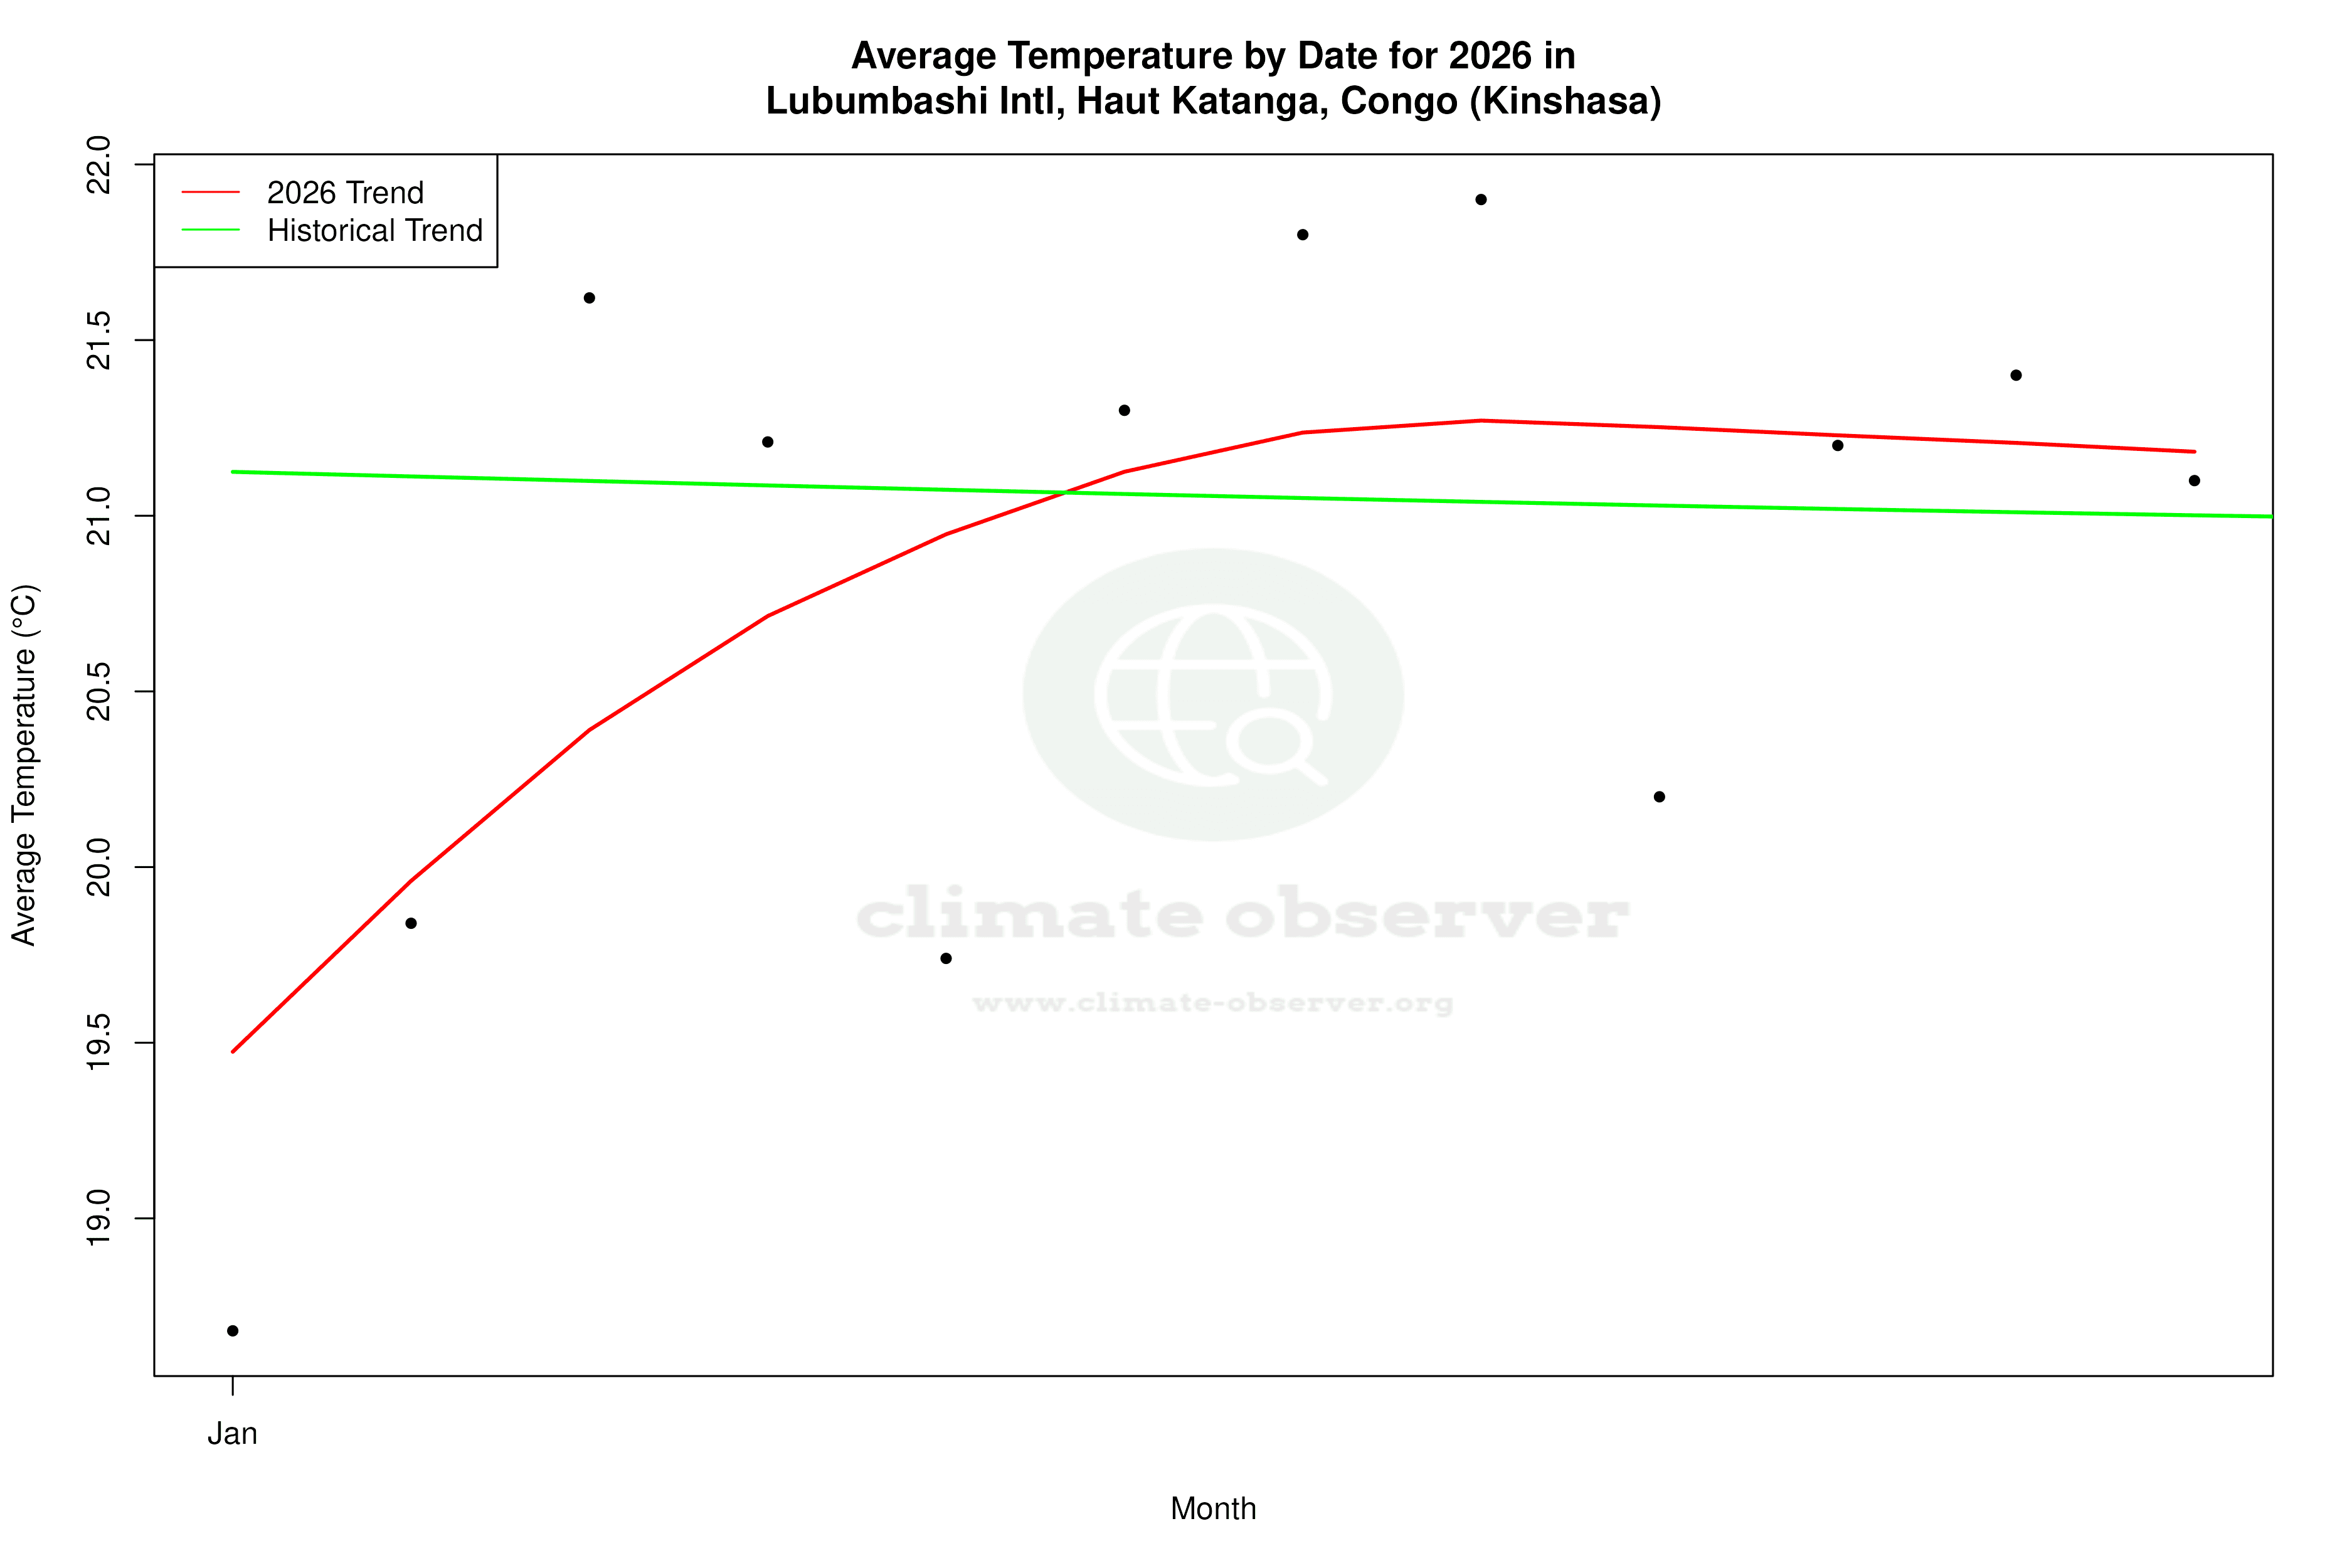
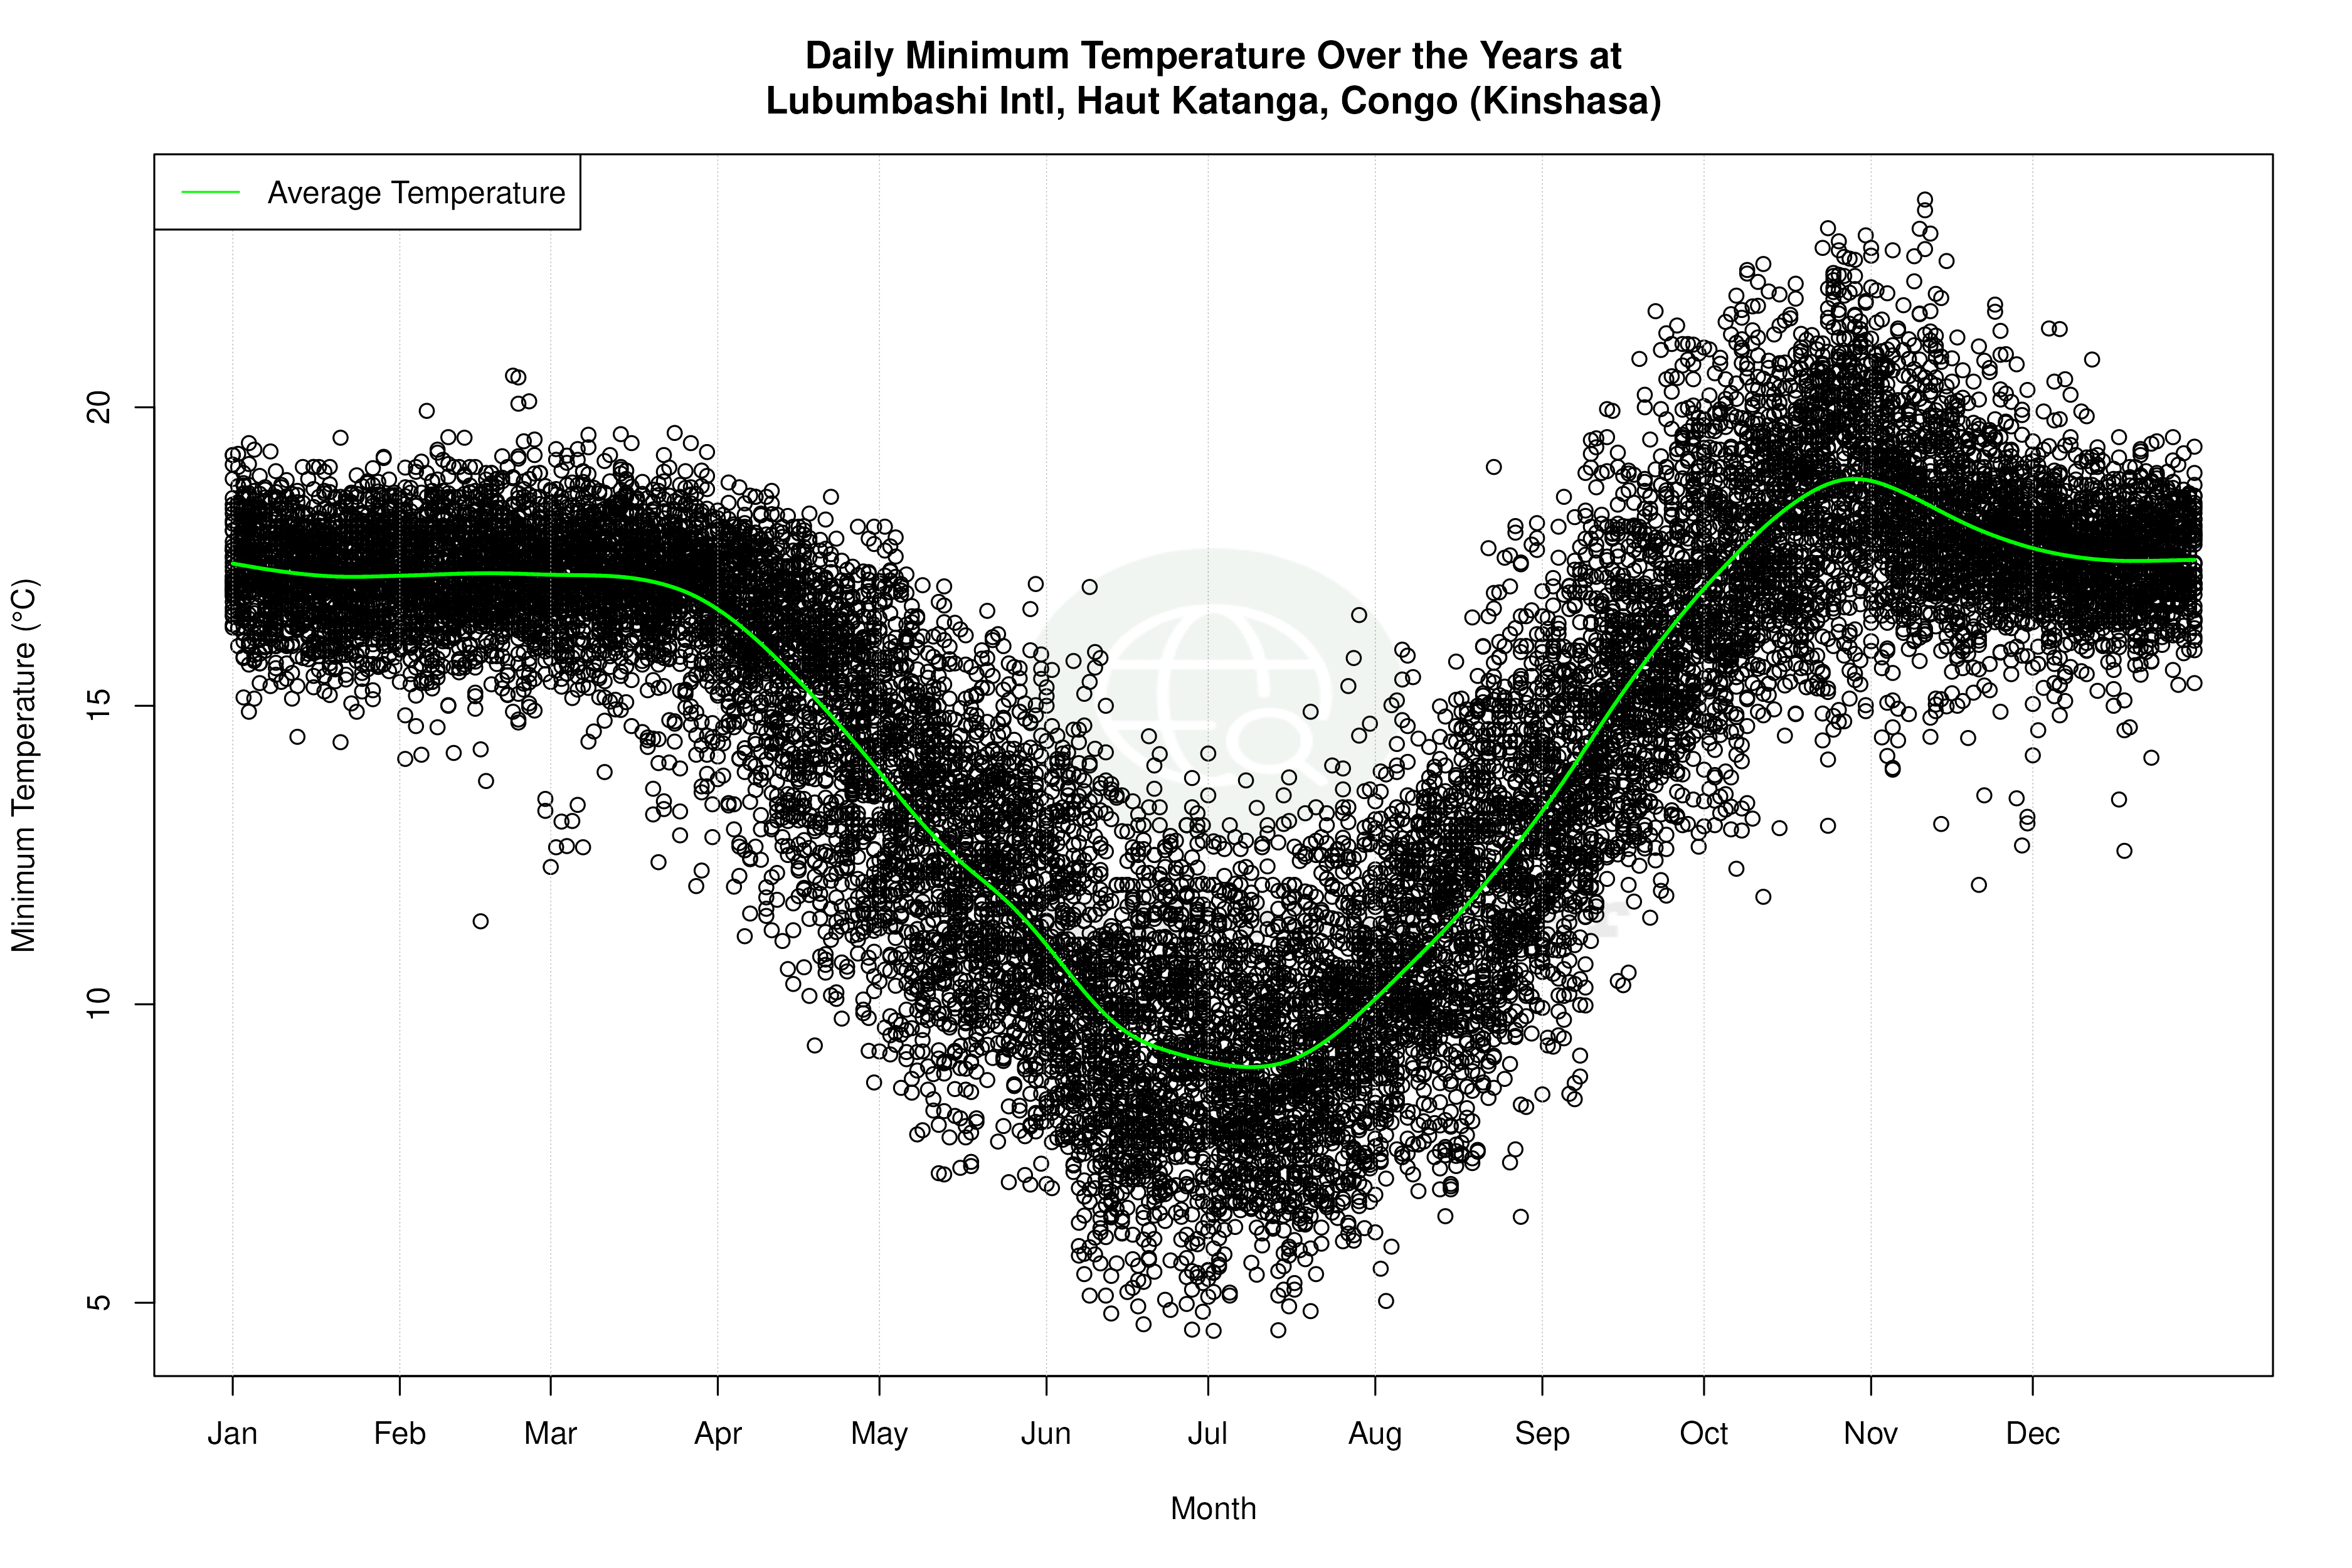
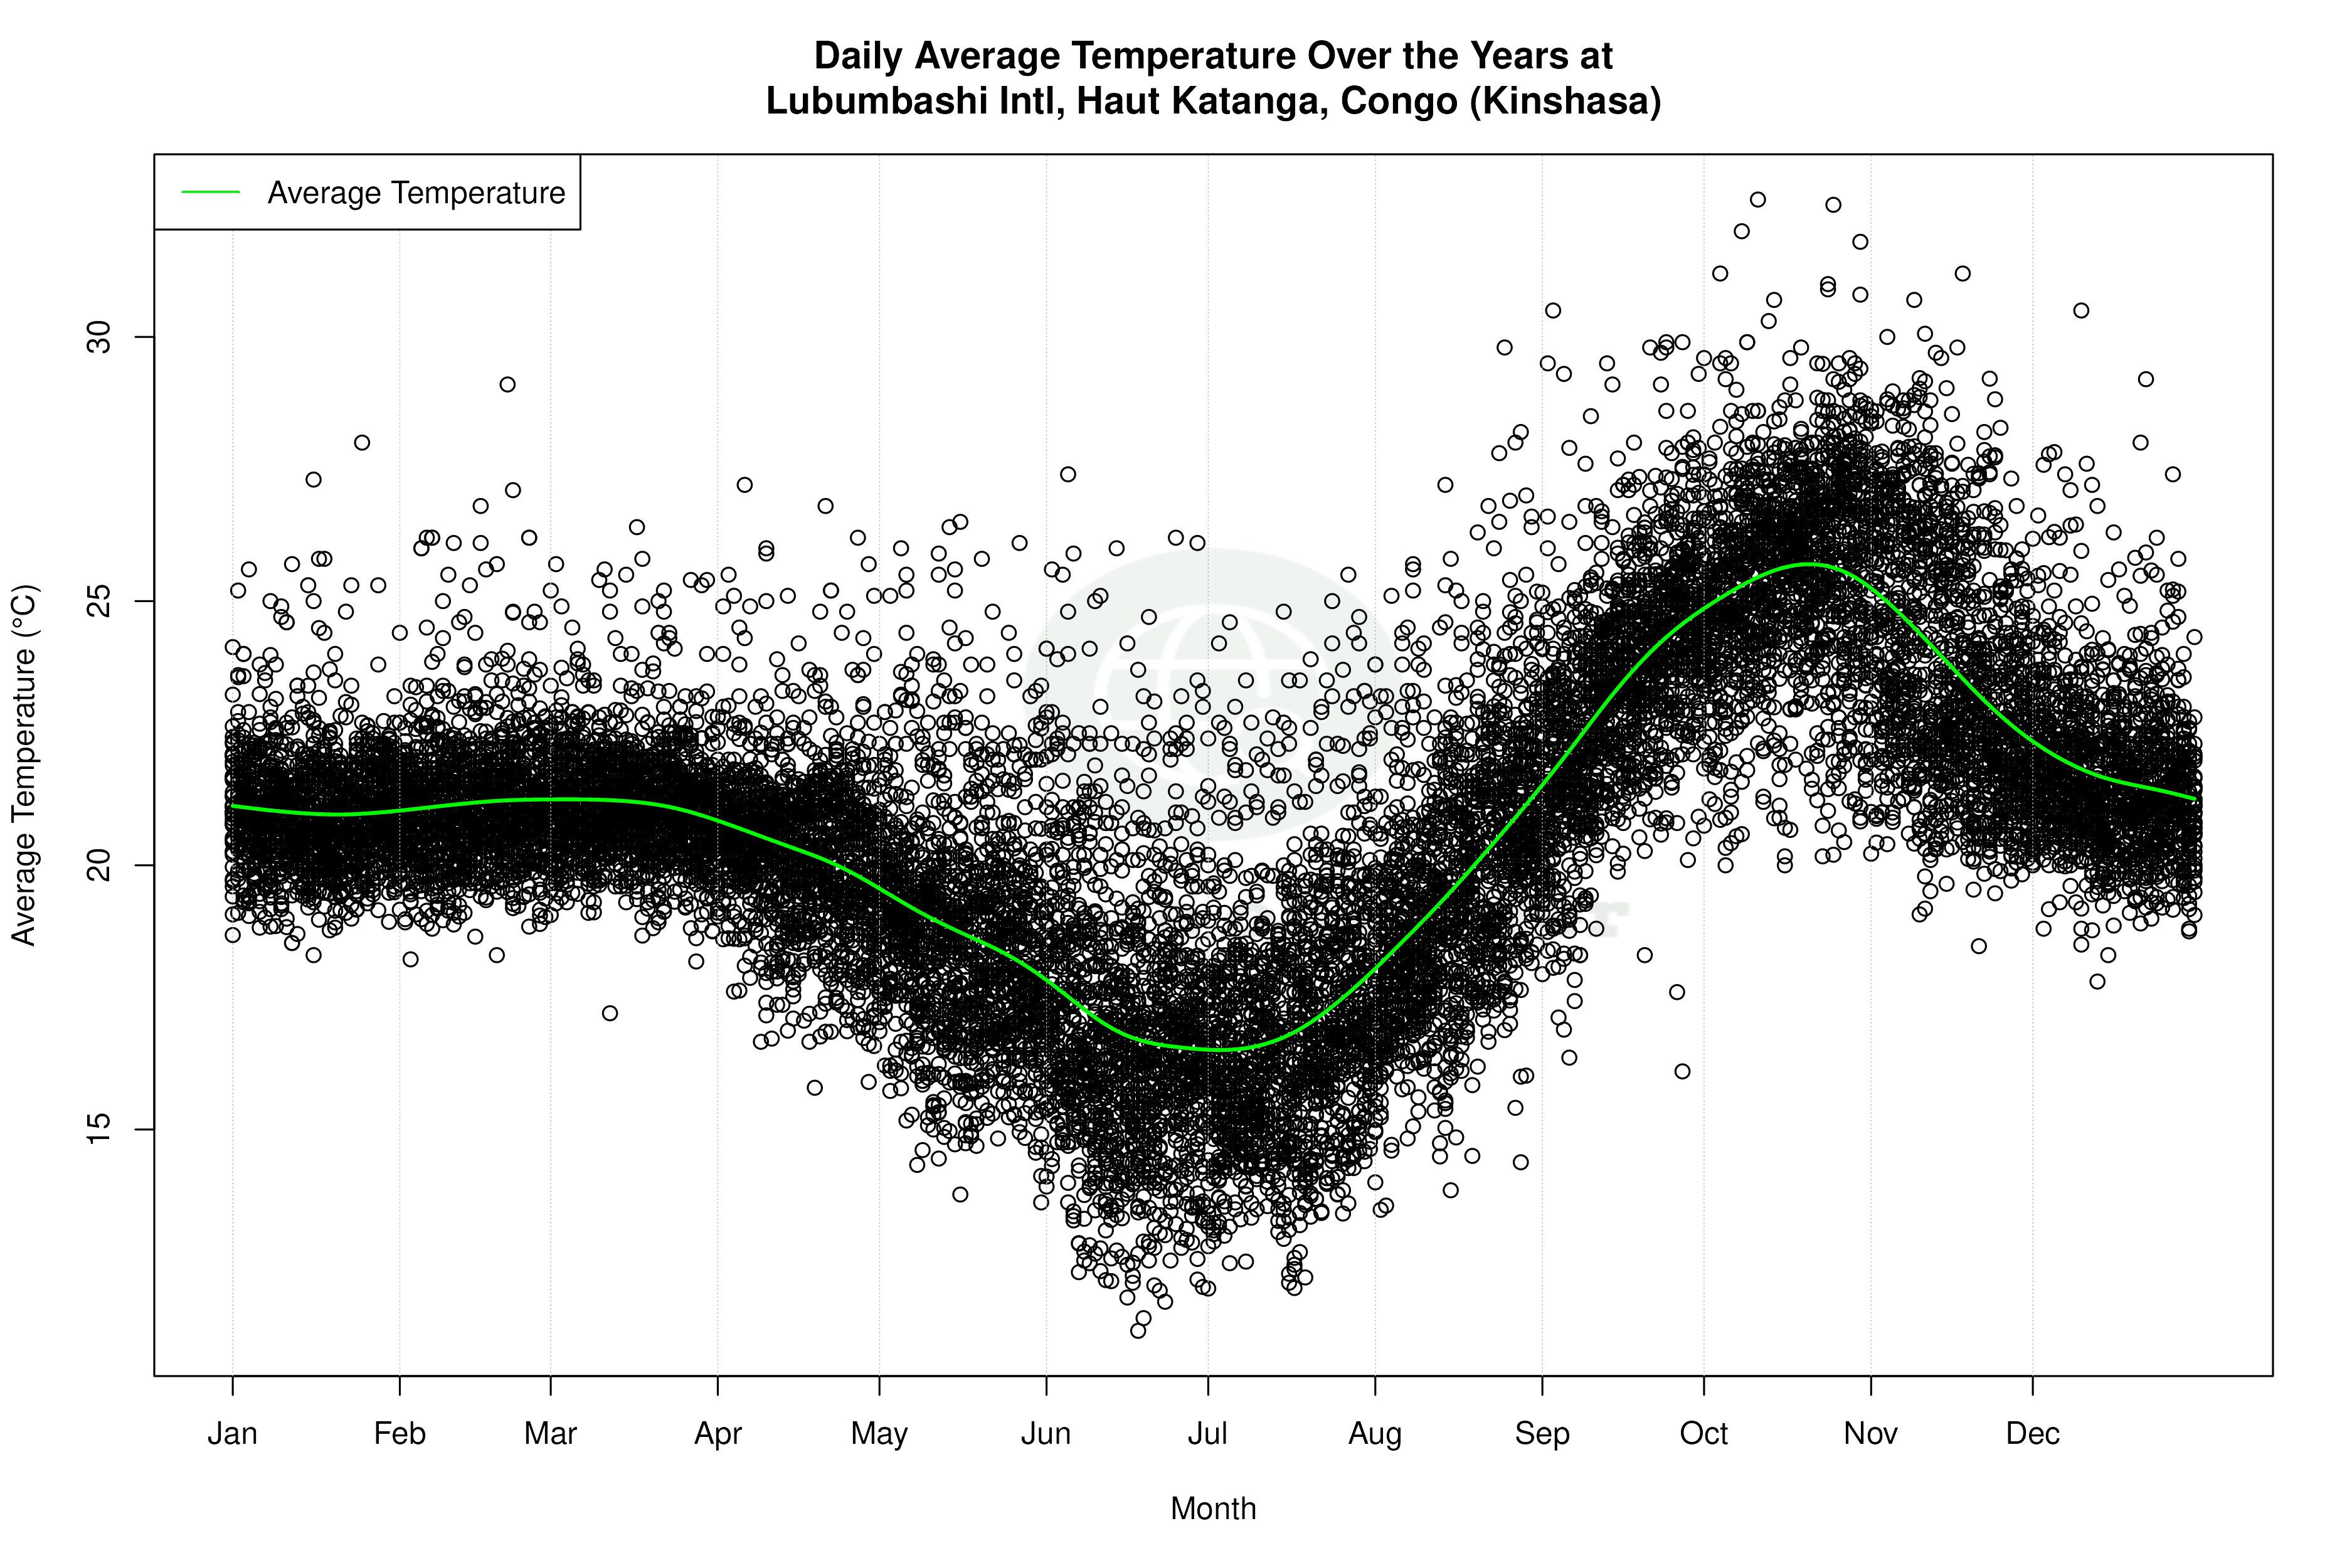
The all-time temperature trends at Lubumbashi International Airport reveal a warming pattern. High temperatures have increased by 0.22°C (0.40°F), while low temperatures have risen by 0.25°C (0.45°F). However, the past decade shows a more pronounced warming in low temperatures, with an increase of 0.93°C (1.67°F), compared to a modest rise in high temperatures of 0.03°C (0.05°F). This divergence suggests a narrowing of the diurnal temperature range, which could have implications for local agriculture and energy consumption.
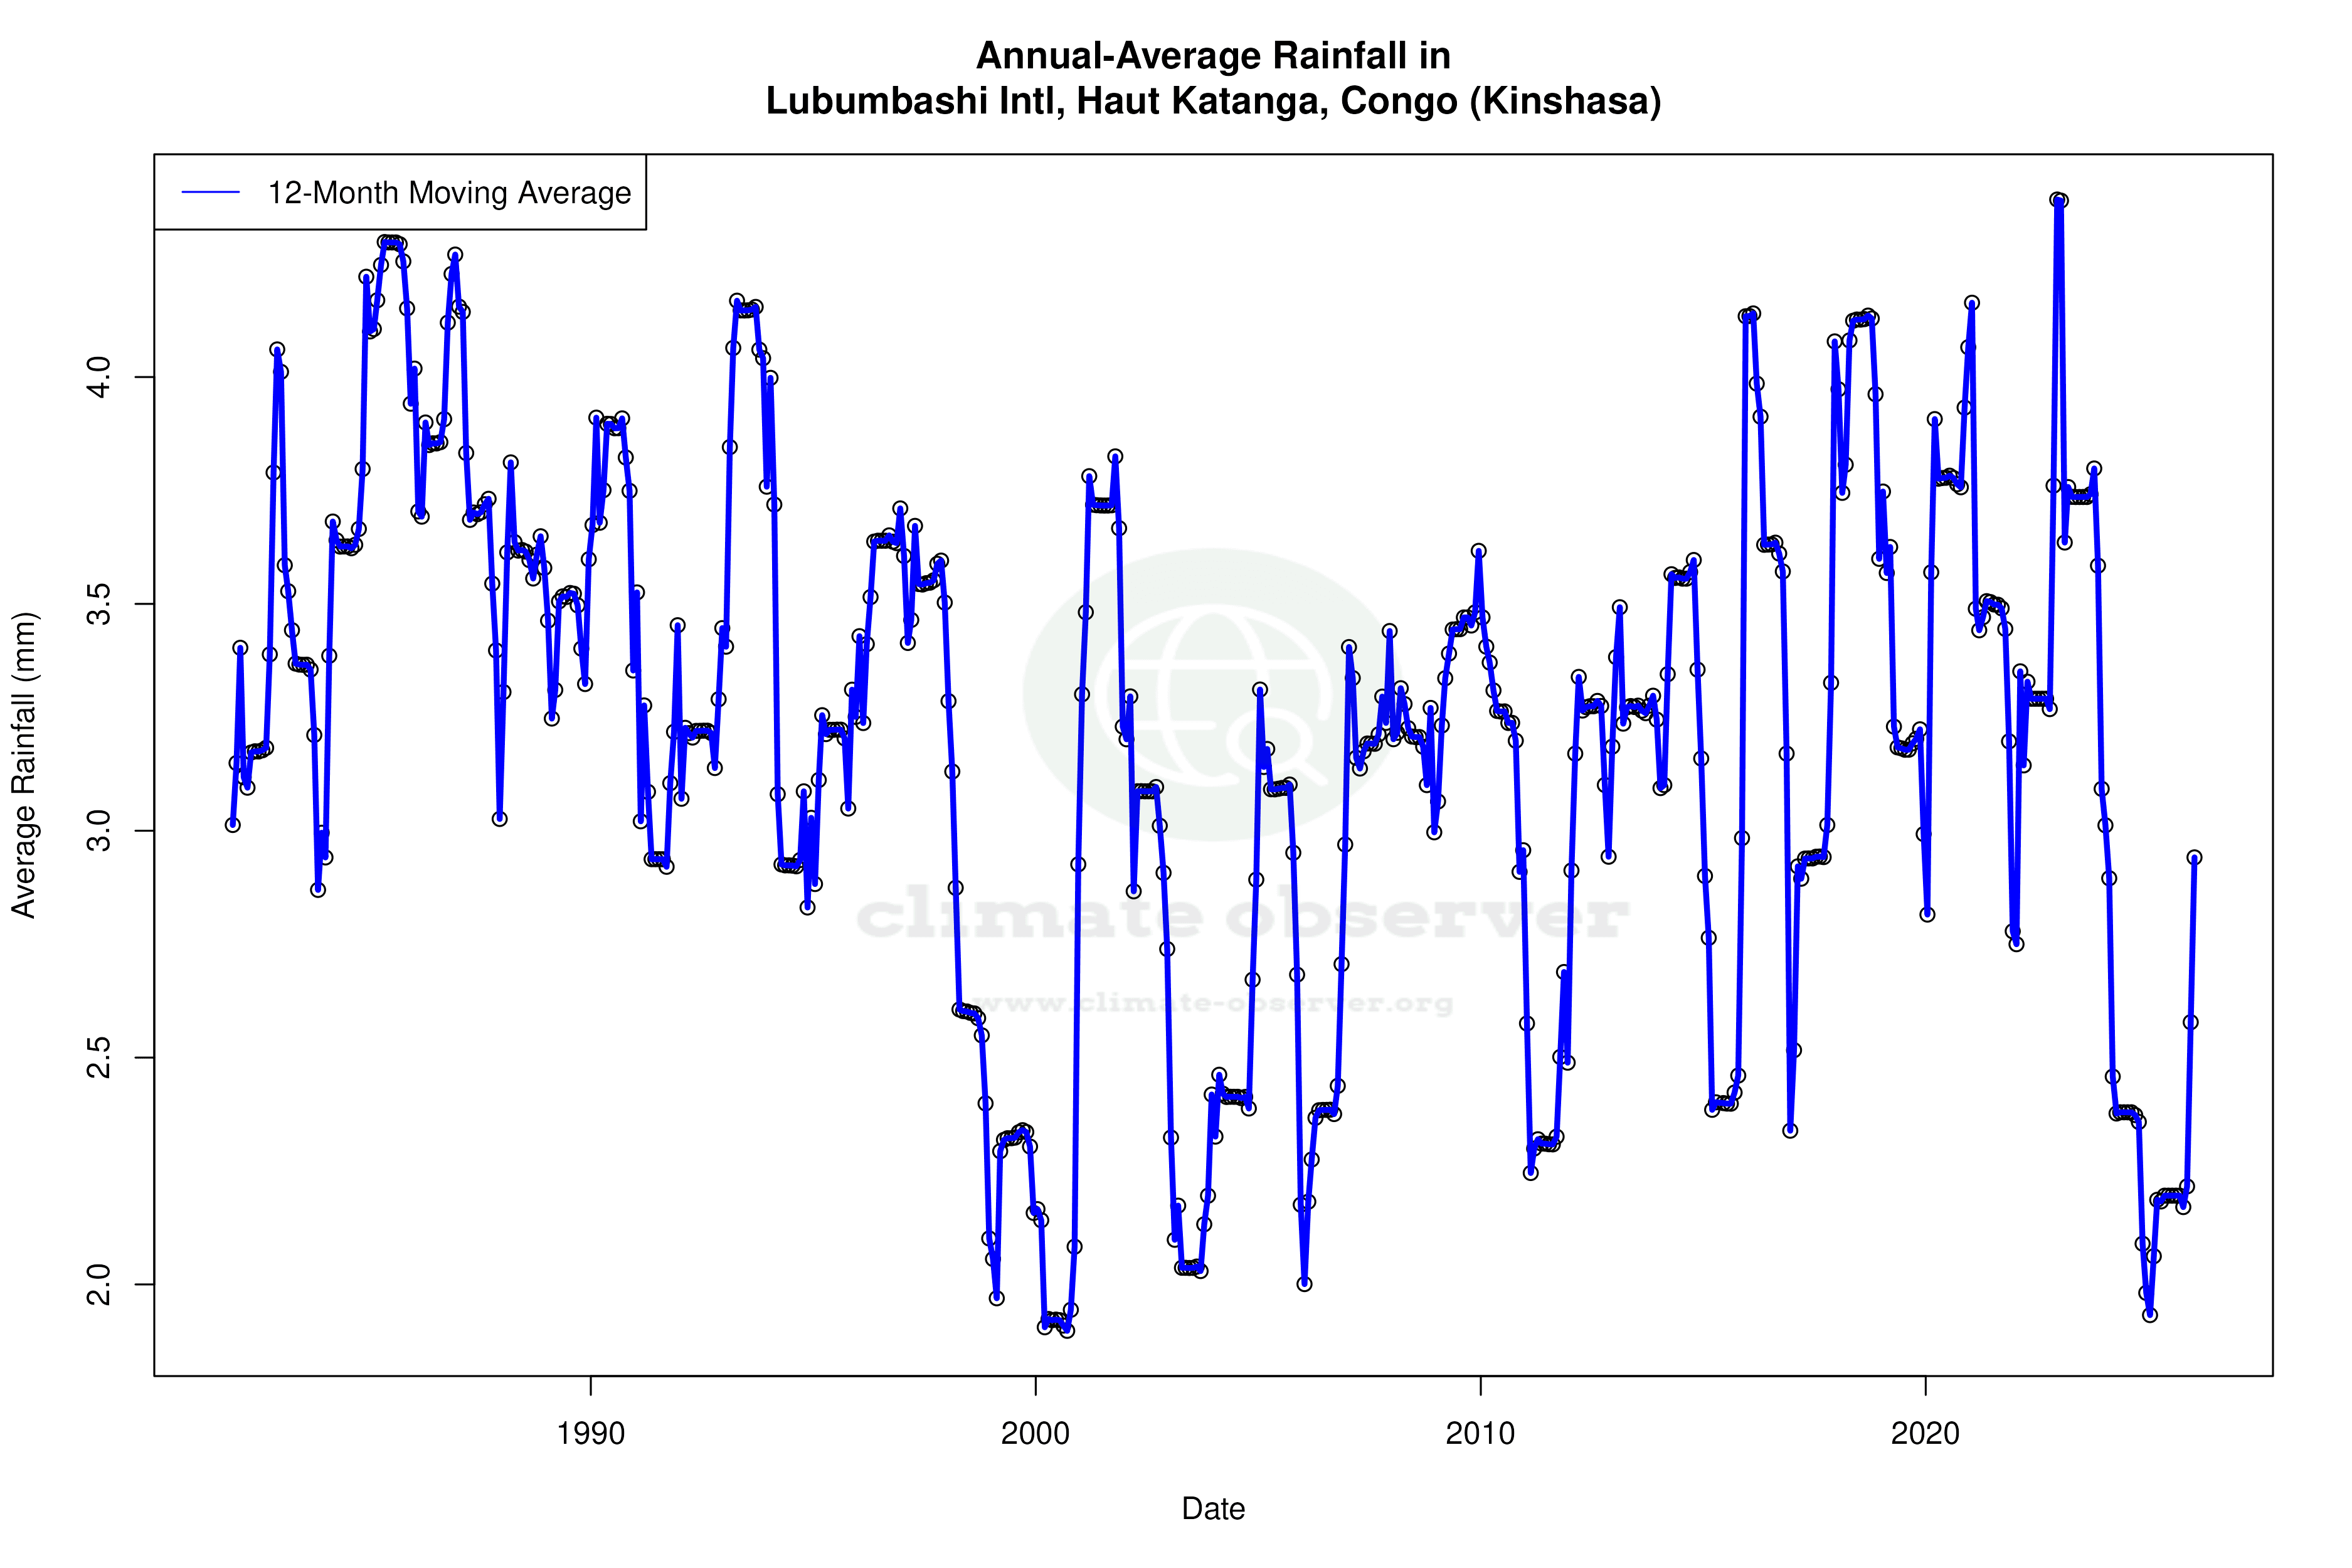
Precipitation Patterns and Distribution
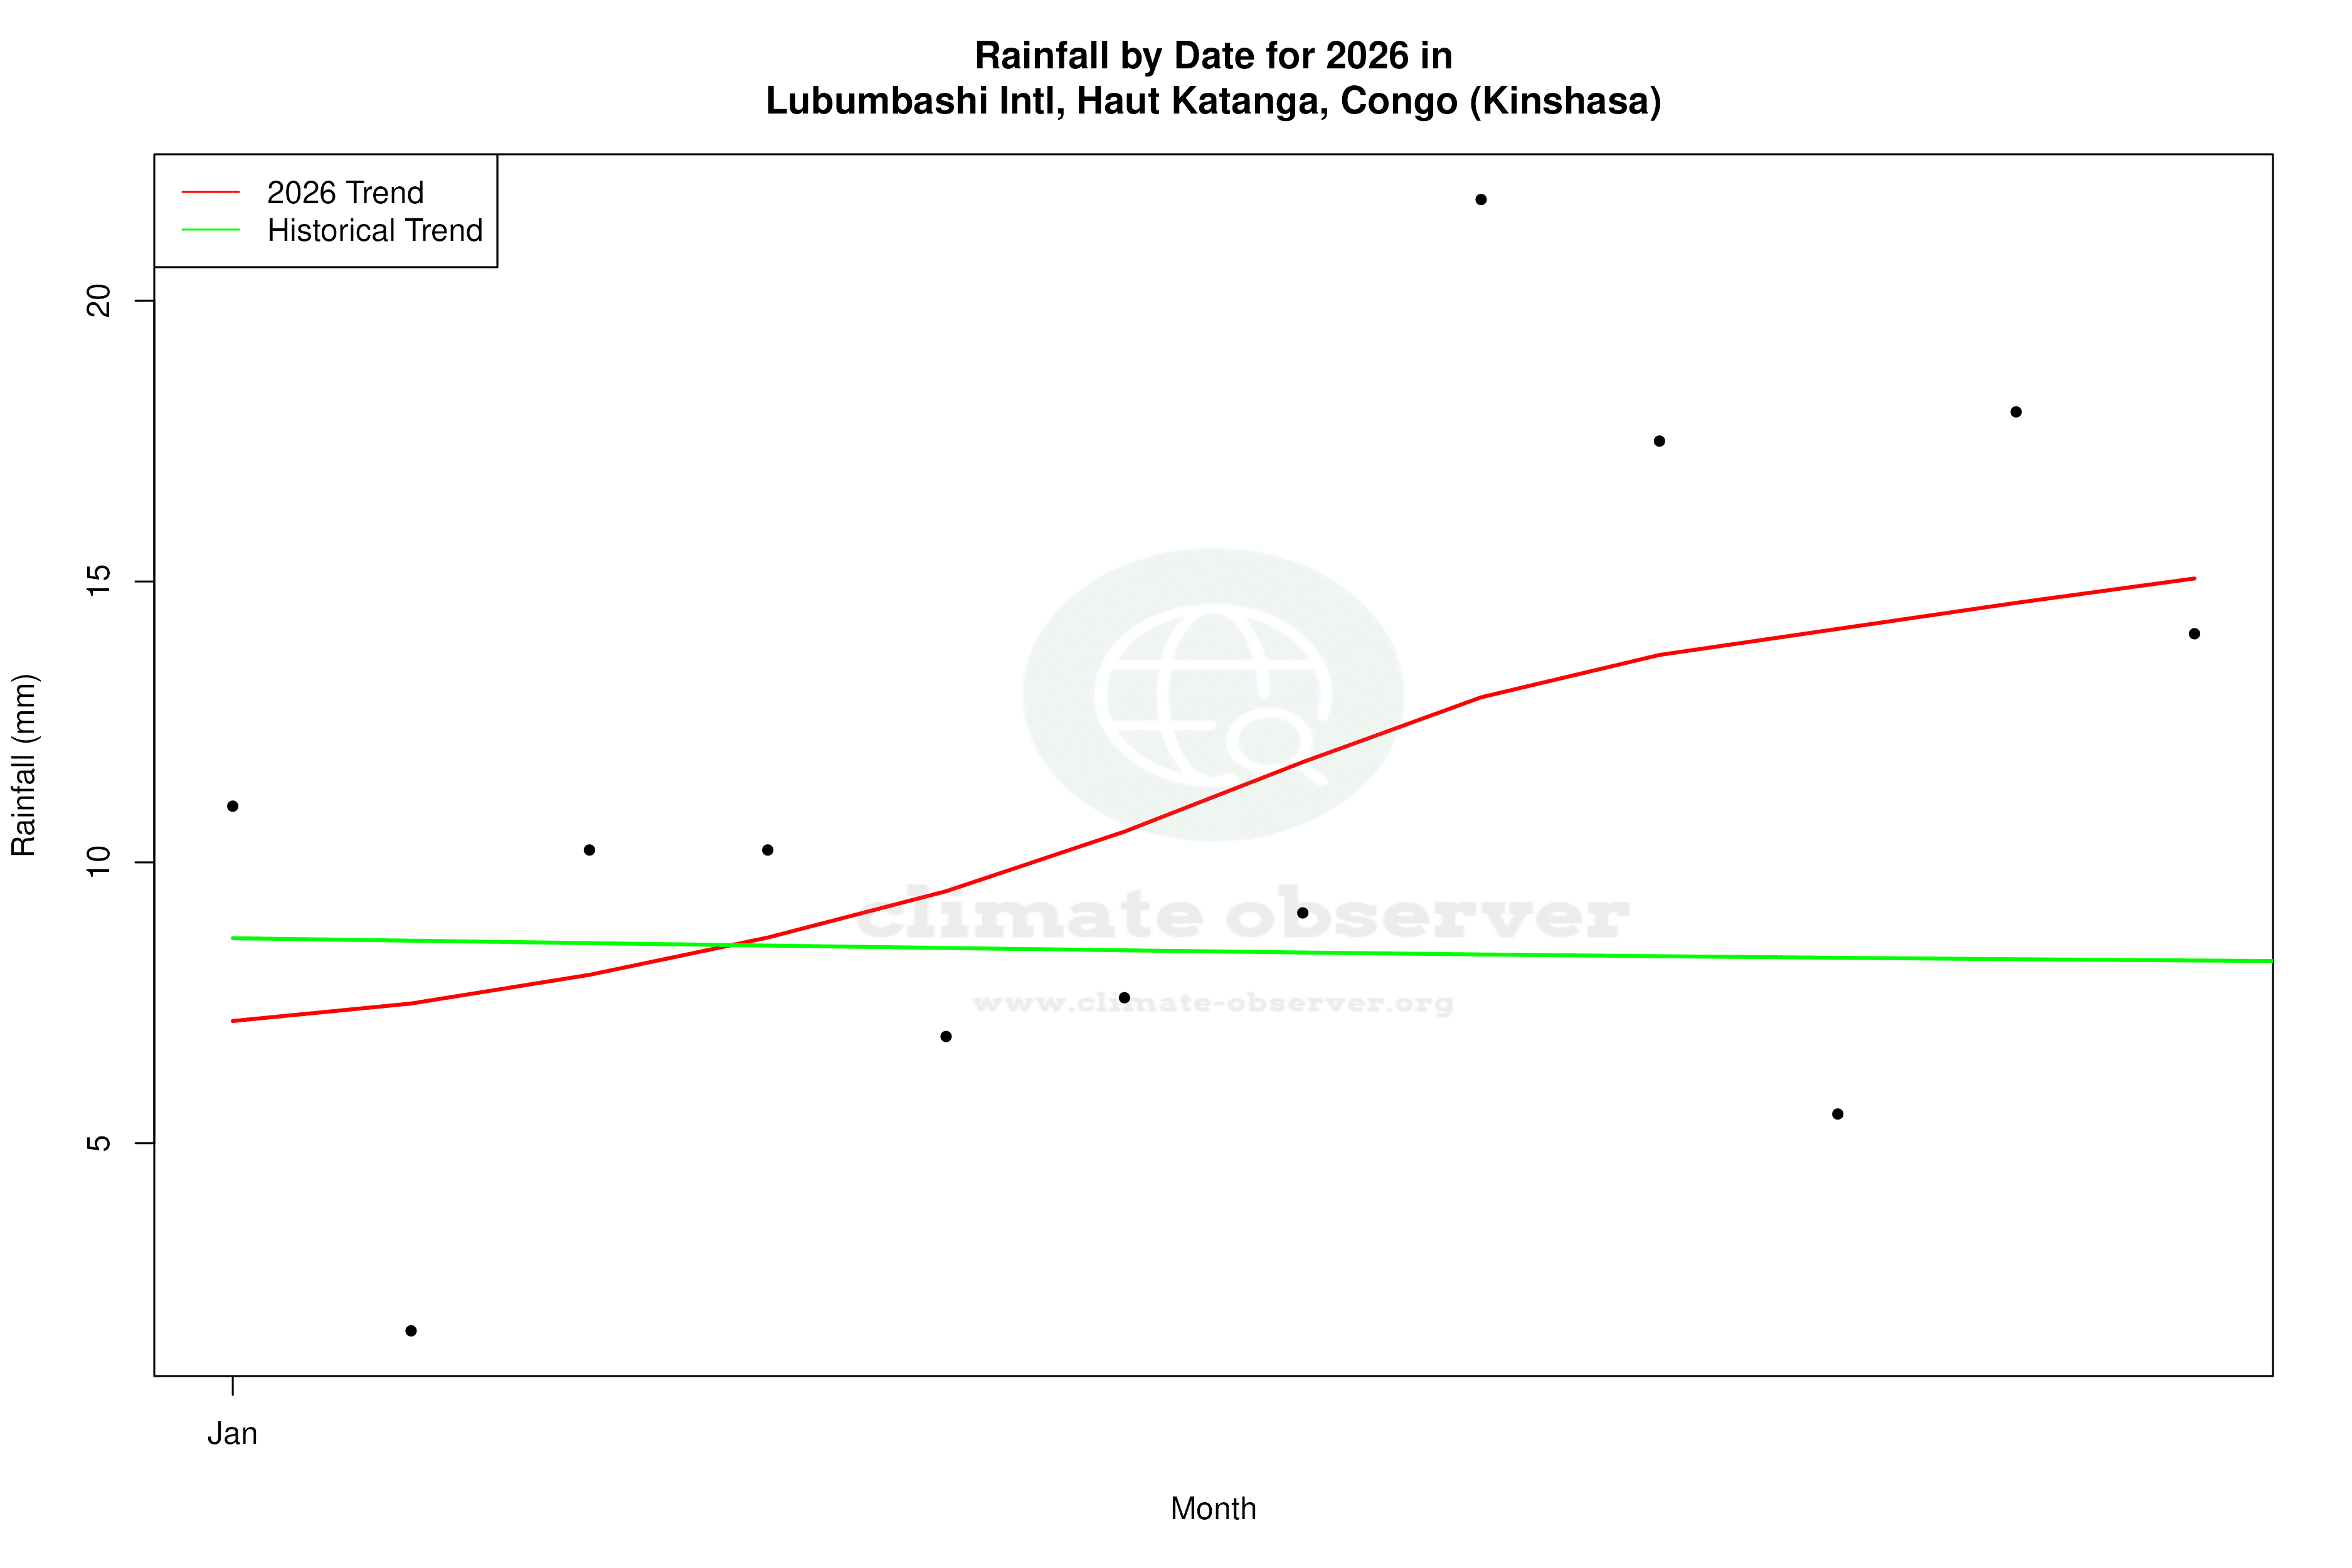
The Precipitation Concentration Index (PCI) at Lubumbashi International Airport has decreased from a baseline of 19.90 to a current value of 16.16. This indicates a shift towards more evenly distributed rainfall throughout the year. A lower PCI suggests that precipitation events are becoming less concentrated, potentially reducing the risk of flooding and improving water availability for agriculture. This trend aligns with regional climate goals aimed at enhancing water resource management.
Record Extremes and Implications
The station has recorded an absolute maximum temperature of 39.0°C (102.2°F) and a minimum of 4.53°C (40.15°F). These extremes highlight the variability in Lubumbashi's climate, which can challenge infrastructure and human health. Understanding these records is crucial for planning and adaptation strategies, particularly in the context of increasing temperatures and changing precipitation patterns.
Regional Climate Goals and Adaptation
The Democratic Republic of the Congo has been focusing on climate resilience and sustainable development. The observed trends at Lubumbashi International Airport provide valuable insights into the local manifestations of broader climatic changes. As the region works towards its climate goals, including improved water management and agricultural sustainability, these data points underscore the importance of integrating scientific insights into policy-making and community planning.
Station Statistics
10-Year Trend
High: +0.04 °C/decade
Low: +0.99 °C/decade
Rain: -1.05 mm/decade
25-Year Trend
High: -0.20 °C/decade
Low: +0.44 °C/decade
Rain: +0.14 mm/decade
50-Year Trend
High: +0.21 °C/decade
Low: +0.26 °C/decade
Rain: -0.11 mm/decade
All-Time Trend
High: +0.21 °C/decade
Low: +0.26 °C/decade
Rain: -0.11 mm/decade
Percentage Above-Average Days
Last 12 Months: 33.2%
This Year: 51.5%
Precipitation Concentration Index (PCI) ℹ️
Last 12 Months: 18.0
Historical Average: 19.4
Percentile Rank of Last 12 Months ℹ️
High: 40th percentile
Low: 98th percentile
Rain: 19th percentile
Change in Variance ℹ️
High: -18.1%
Low: -22.0%
Intraday: -23.4%
Data Coverage
85.6%
First Year of Data
1973
Station Location
Historical Weather Records
| Max High | Avg High | Min High | Max Avg | Avg Avg | Min Avg | Max Low | Avg Low | Min Low | Max Precipitation | Avg Precipitation | Max Snow | Avg Snow | |
|---|---|---|---|---|---|---|---|---|---|---|---|---|---|
| Record | 39.0 °C | — | 18.3 °C | 32.6 °C | — | 11.2 °C | 23.5 °C | — | 4.5 °C | 84.7 mm | — | — | — |
| January | 31.9 °C | 25.6 °C | 21.3 °C | 28.0 °C | 21.0 °C | 18.3 °C | 19.5 °C | 17.2 °C | 14.4 °C | 66.0 mm | 8.2 mm | — | — |
| February | 35.0 °C | 25.8 °C | 20.8 °C | 29.1 °C | 21.2 °C | 18.2 °C | 20.5 °C | 17.2 °C | 11.4 °C | 84.7 mm | 7.8 mm | — | — |
| March | 31.1 °C | 26.1 °C | 21.1 °C | 26.4 °C | 21.2 °C | 17.2 °C | 19.6 °C | 17.1 °C | 12.0 °C | 54.6 mm | 6.2 mm | — | — |
| April | 30.6 °C | 26.1 °C | 20.4 °C | 27.2 °C | 20.3 °C | 15.8 °C | 18.7 °C | 15.4 °C | 8.7 °C | 58.3 mm | 2.0 mm | — | — |
| May | 32.3 °C | 25.7 °C | 18.3 °C | 26.5 °C | 18.7 °C | 13.6 °C | 18.0 °C | 12.5 °C | 7.0 °C | 21.4 mm | 0.2 mm | — | — |
| June | 31.1 °C | 24.9 °C | 19.1 °C | 27.4 °C | 17.0 °C | 11.2 °C | 17.0 °C | 9.7 °C | 4.5 °C | 2.5 mm | 0.0 mm | — | — |
| July | 31.6 °C | 25.5 °C | 20.0 °C | 25.5 °C | 16.9 °C | 12.0 °C | 16.5 °C | 9.2 °C | 4.5 °C | 2.0 mm | 0.0 mm | — | — |
| August | 34.0 °C | 28.7 °C | 22.4 °C | 29.8 °C | 19.7 °C | 13.5 °C | 19.0 °C | 11.5 °C | 5.0 °C | 9.0 mm | 0.0 mm | — | — |
| September | 37.2 °C | 32.4 °C | 25.0 °C | 30.5 °C | 23.3 °C | 16.1 °C | 21.6 °C | 15.1 °C | 8.4 °C | 14.8 mm | 0.1 mm | — | — |
| October | 39.0 °C | 33.4 °C | 22.8 °C | 32.6 °C | 25.4 °C | 20.0 °C | 23.0 °C | 18.2 °C | 11.8 °C | 42.1 mm | 1.0 mm | — | — |
| November | 38.0 °C | 30.1 °C | 21.4 °C | 31.2 °C | 23.8 °C | 18.5 °C | 23.5 °C | 18.2 °C | 12.0 °C | 62.0 mm | 4.3 mm | — | — |
| December | 35.8 °C | 26.7 °C | 21.5 °C | 30.5 °C | 21.7 °C | 17.8 °C | 21.3 °C | 17.5 °C | 12.6 °C | 71.1 mm | 8.4 mm | — | — |
Data Visualisations
Remove WatermarksCurrent Year Climate Trends vs Historical
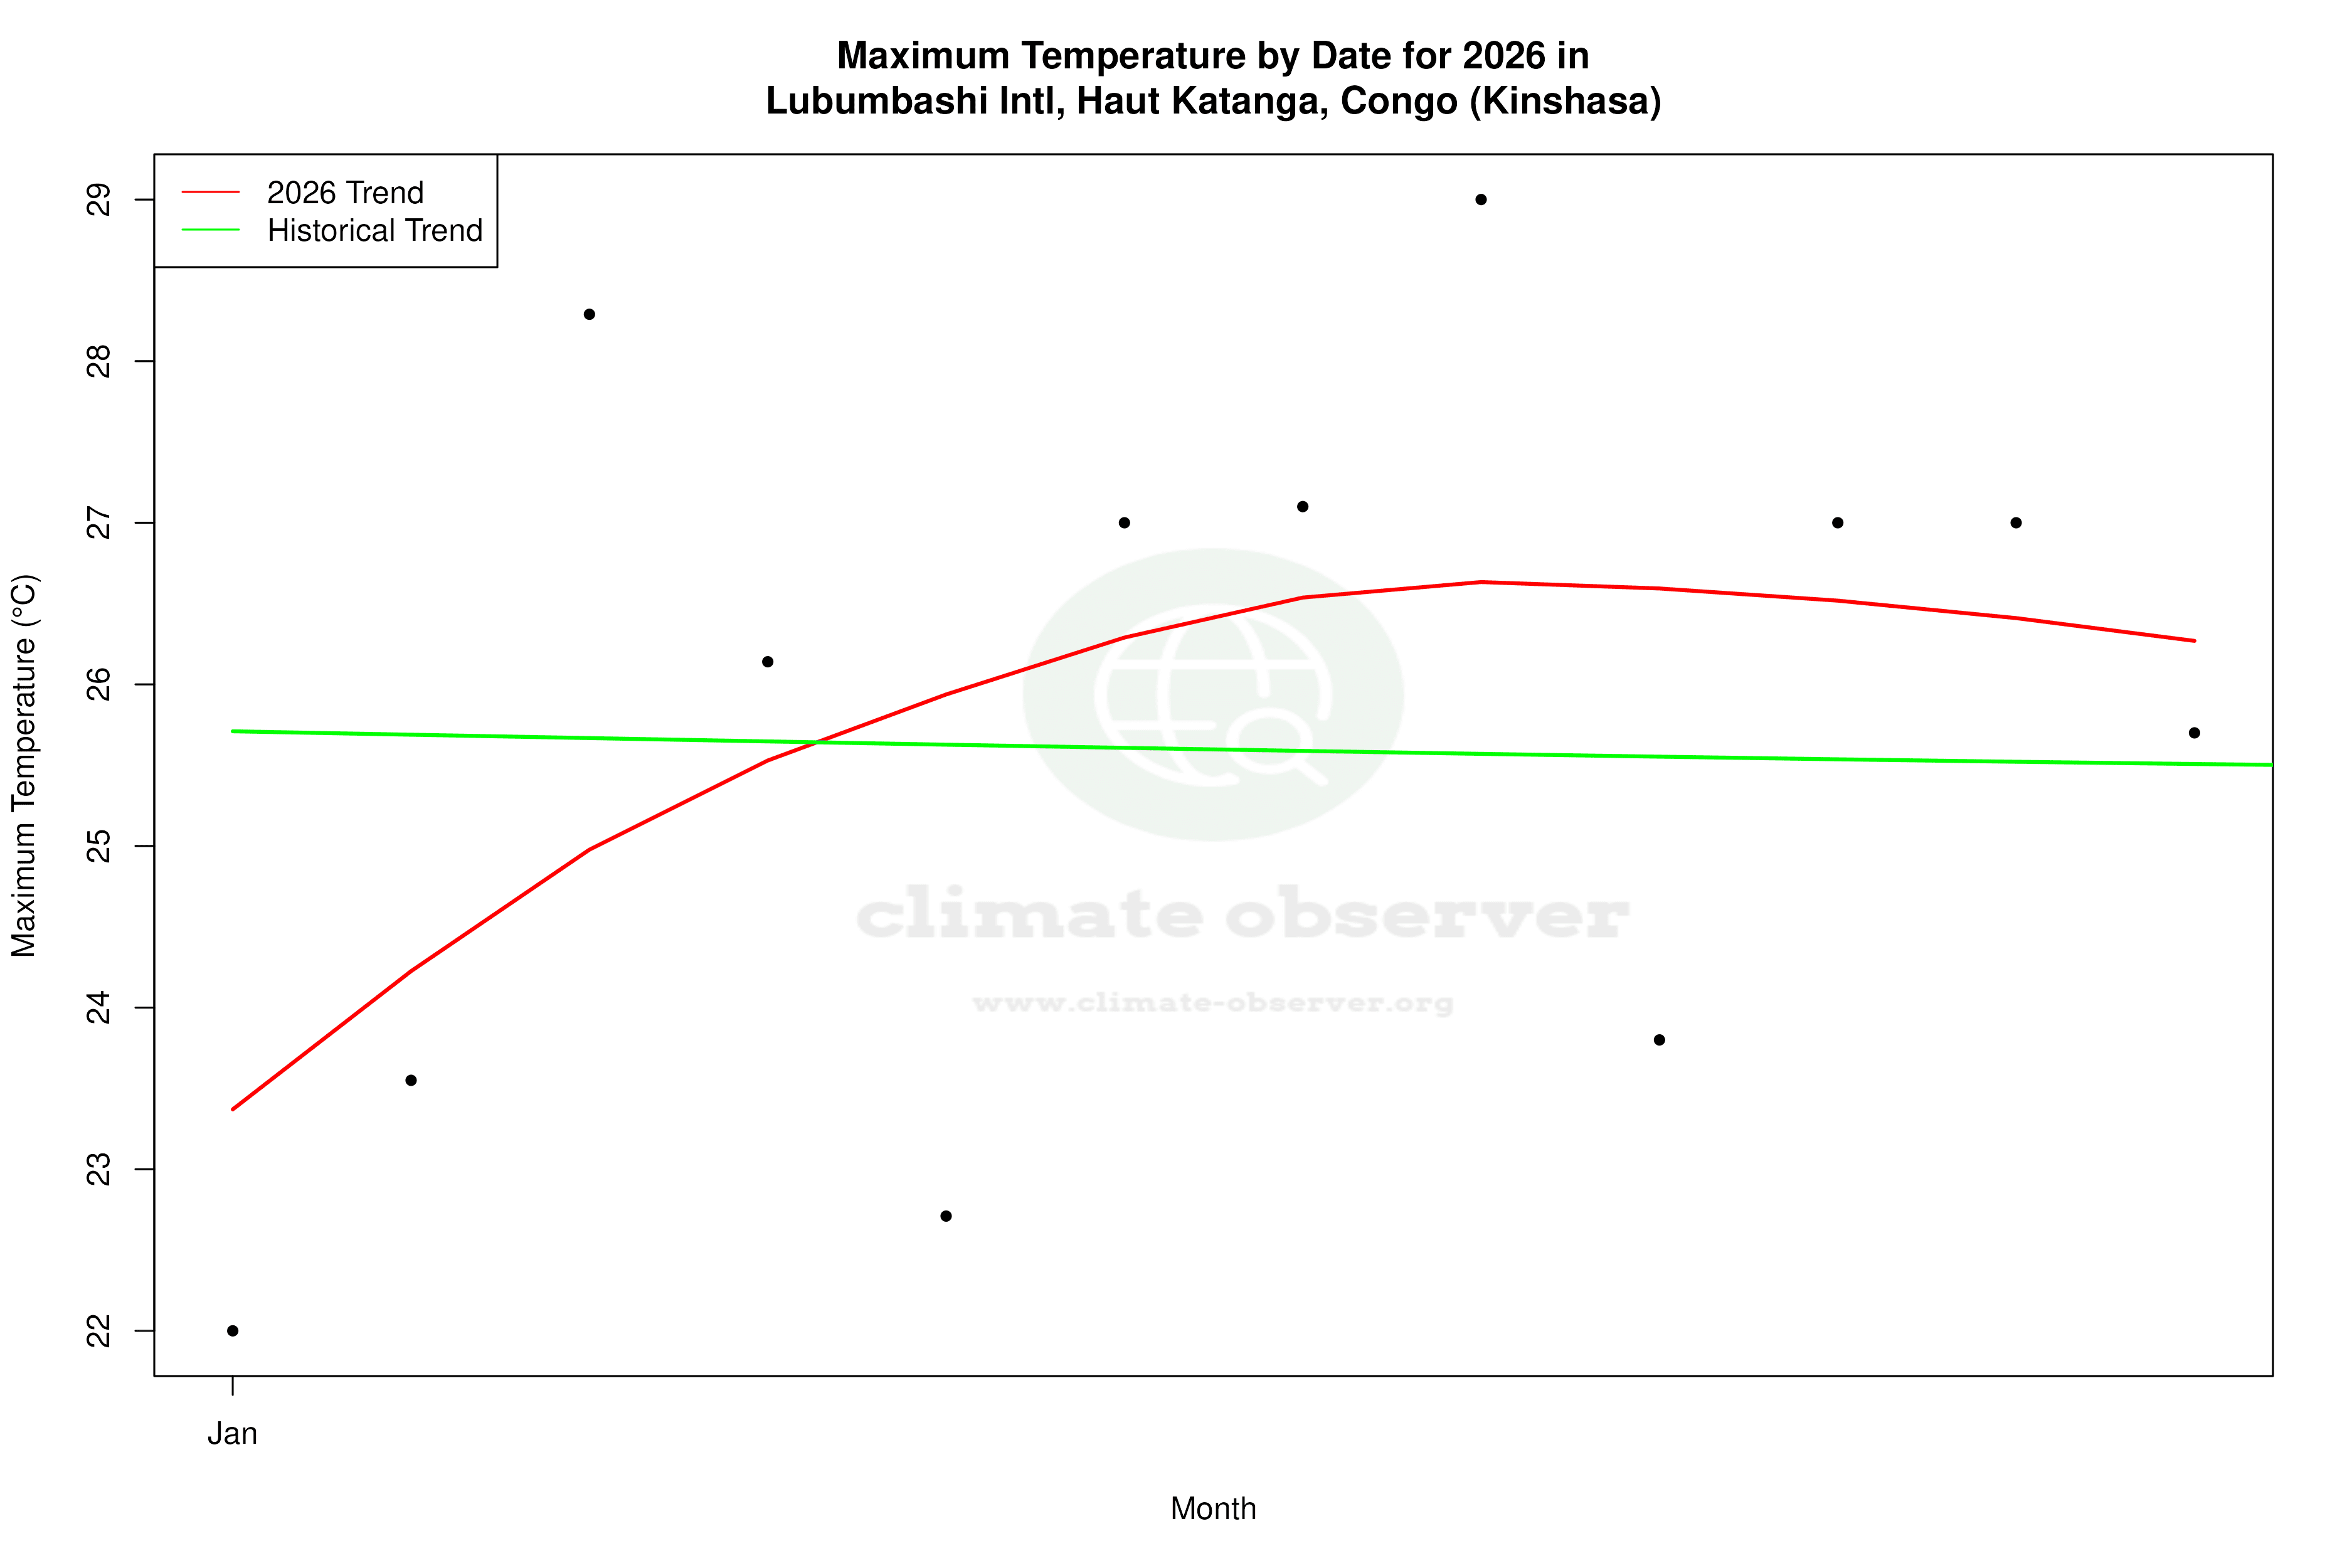


Max Temperature this Year | 1 of 6
Climate 12-Month Moving Averages

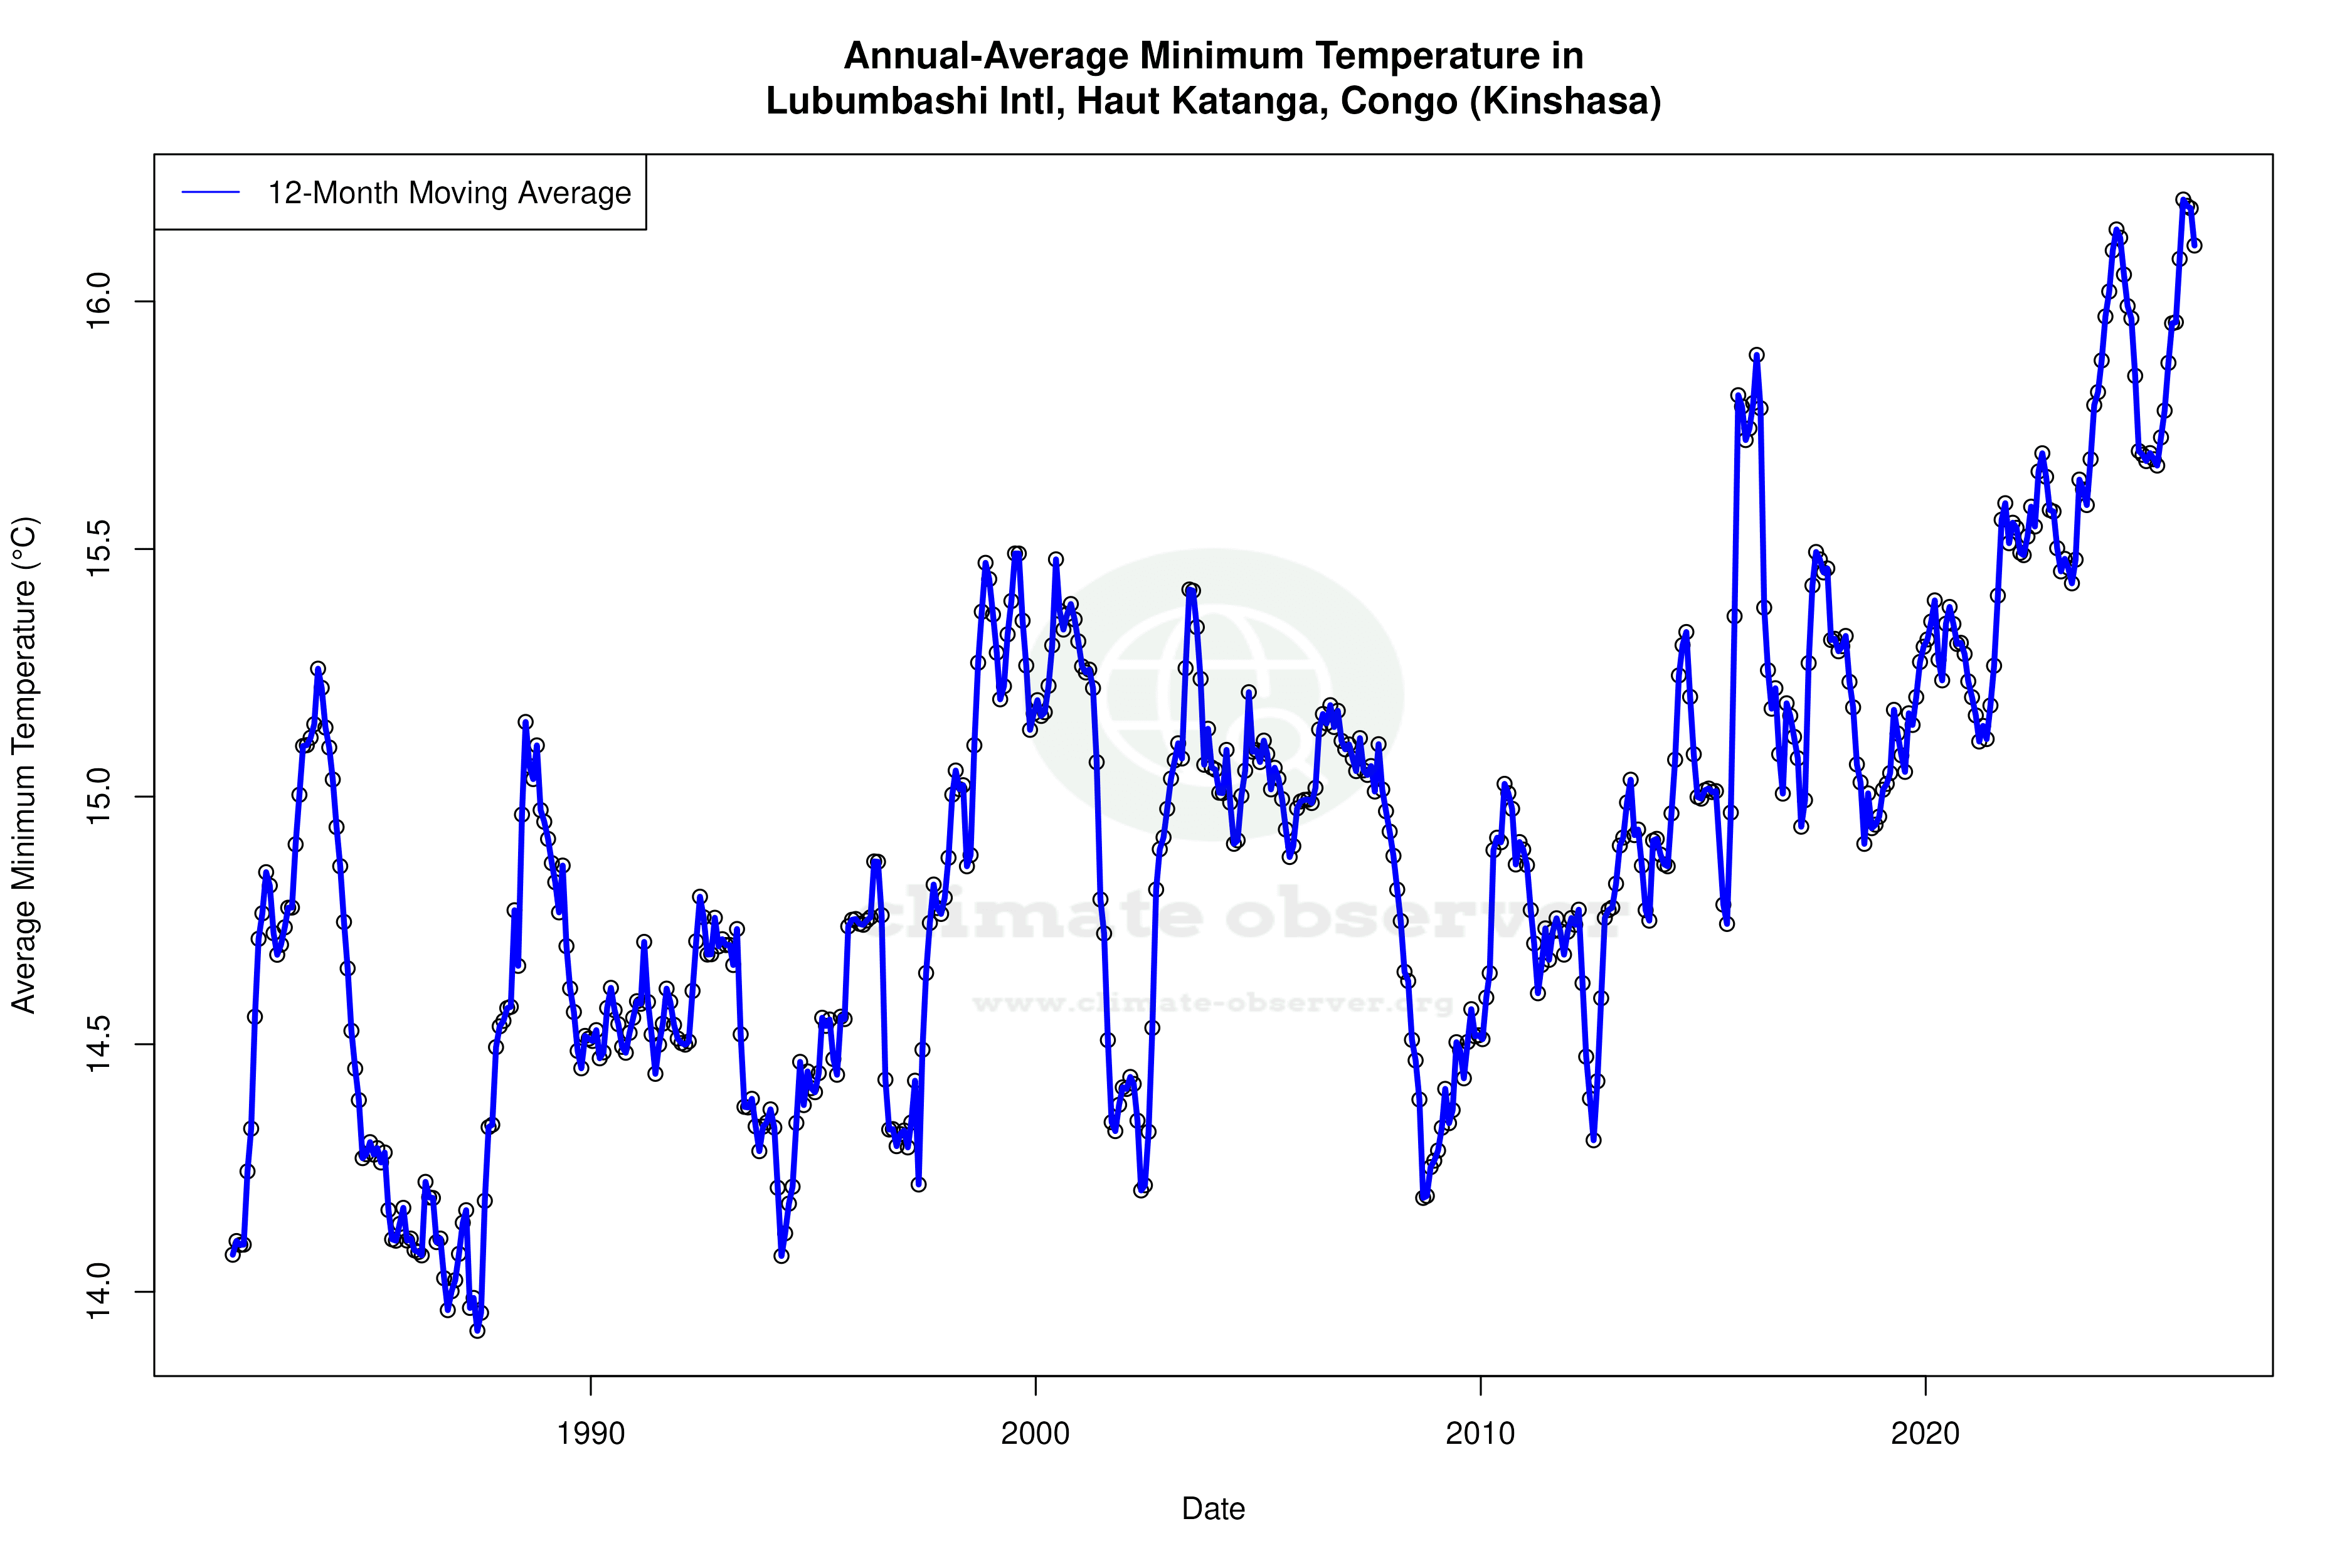


Max Temperature 12-Month MA | 1 of 6
Daily Data Points and Averages Throughout the Year
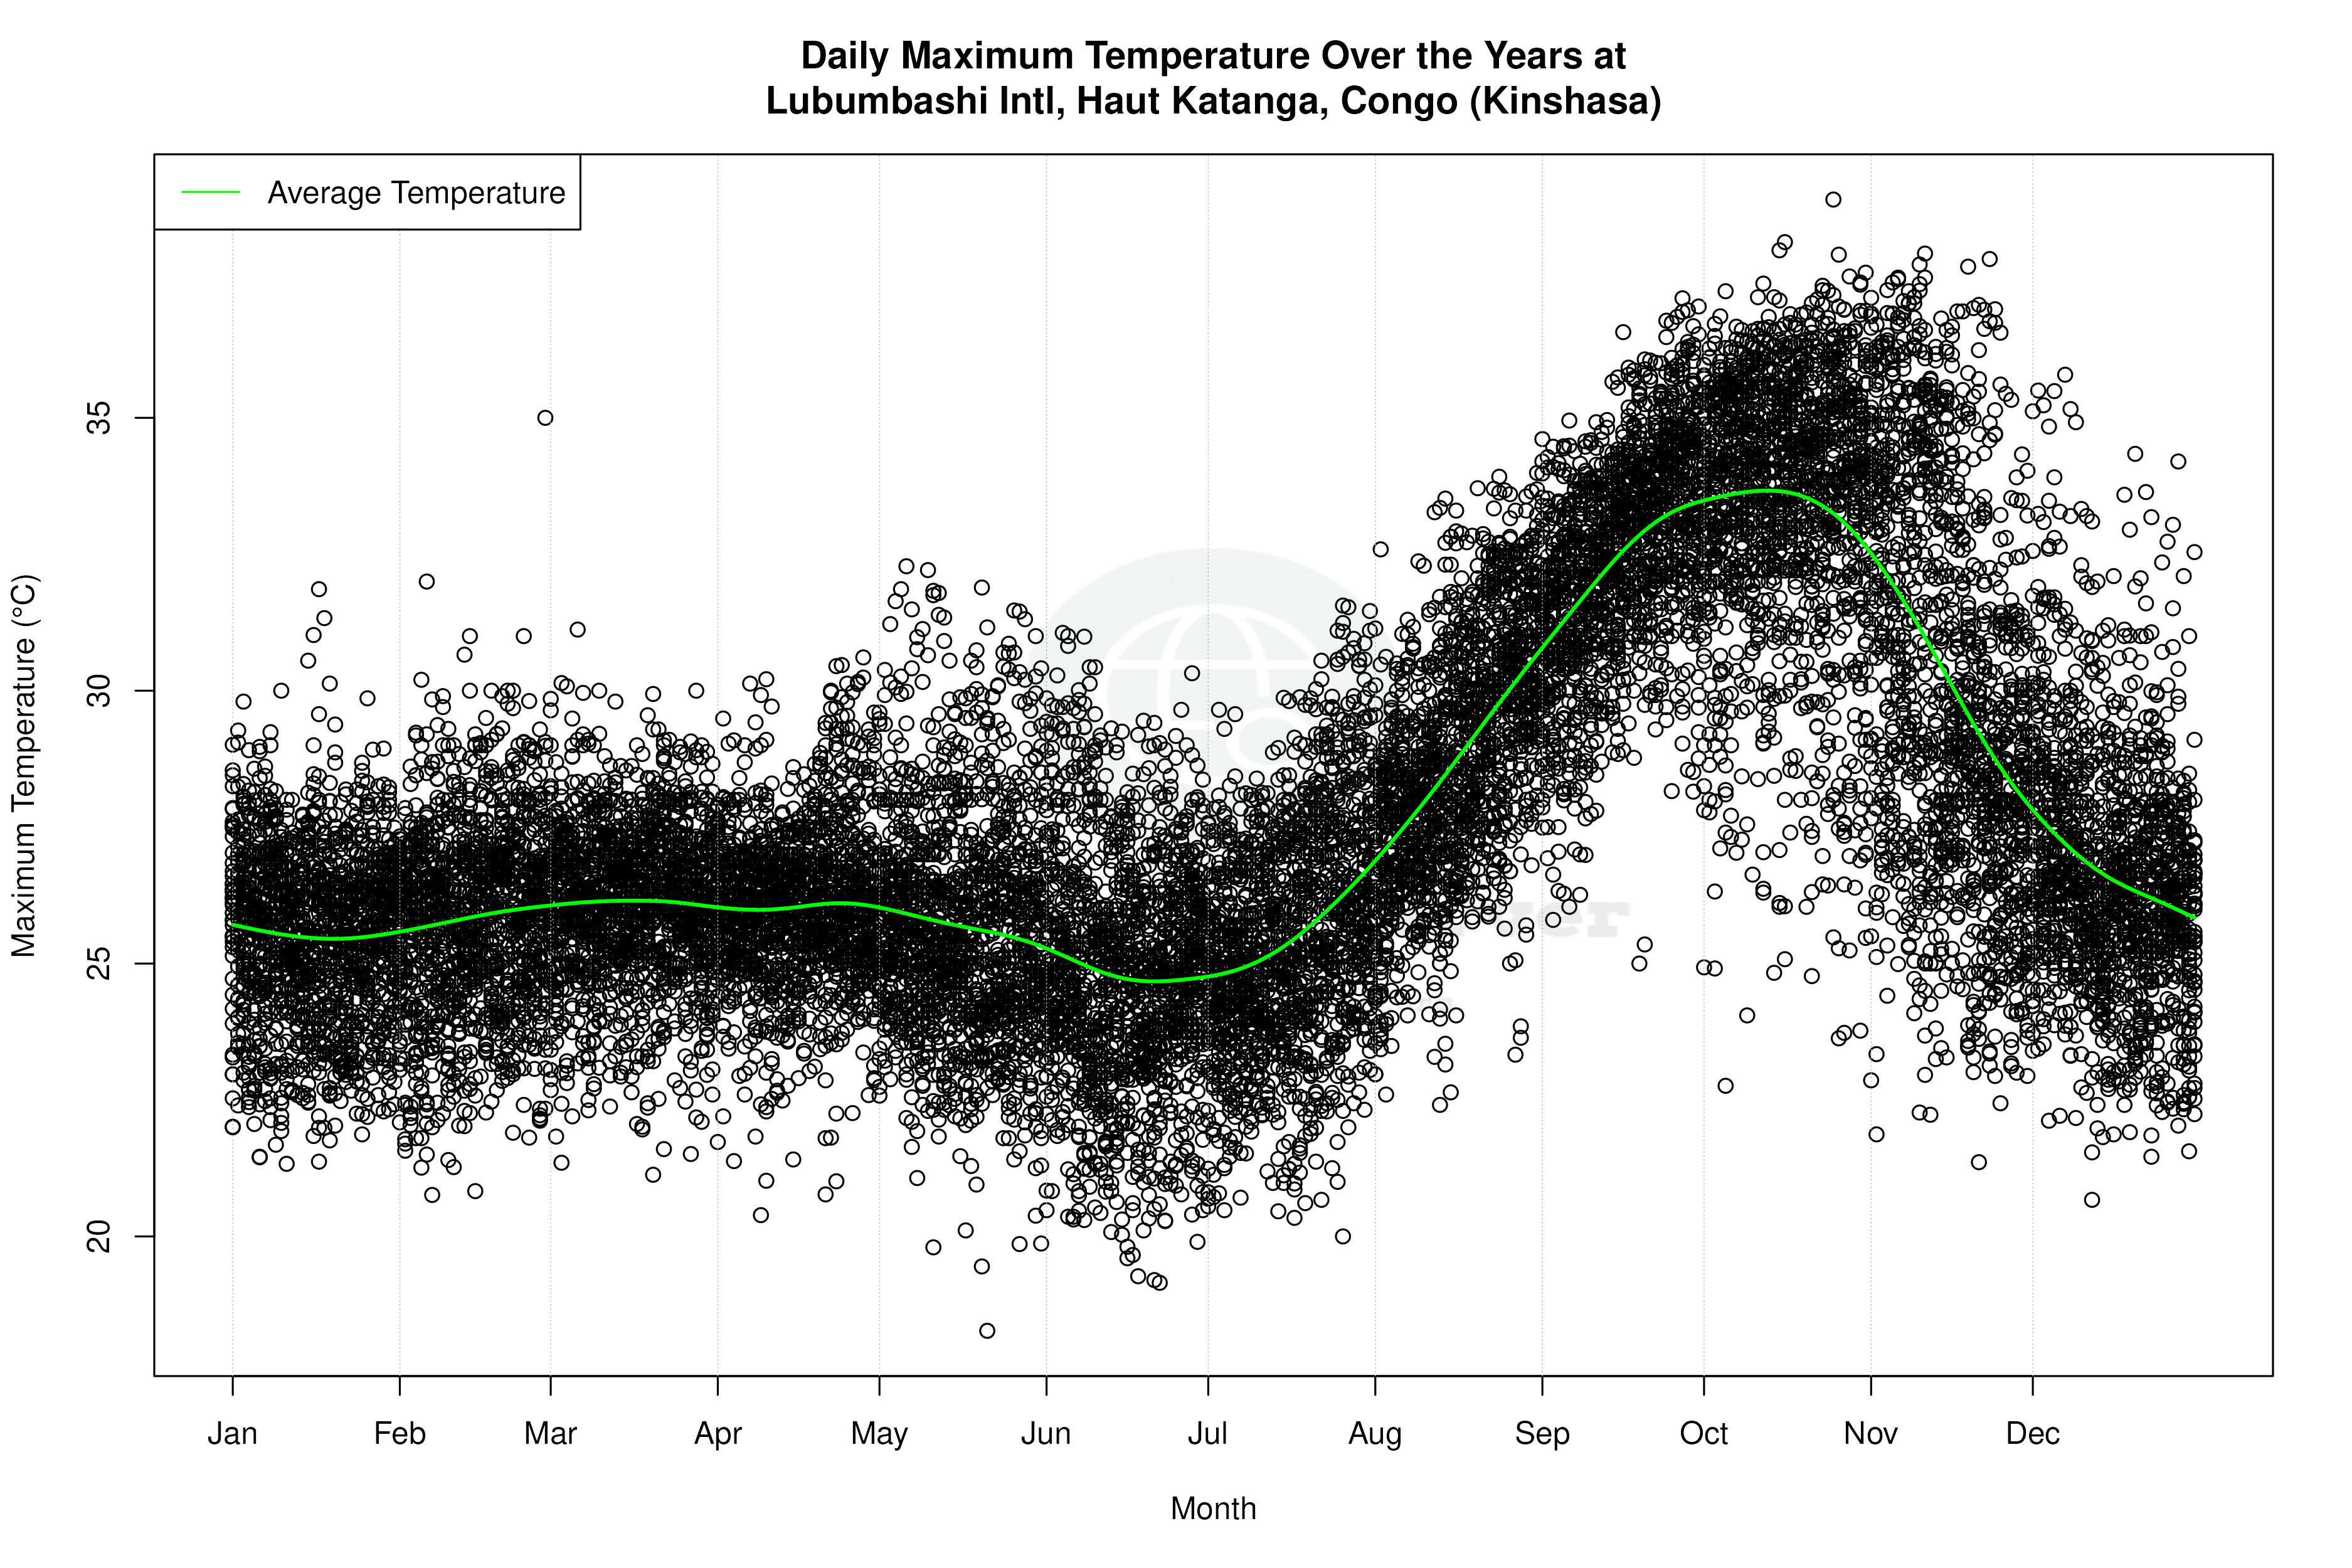


Average Max Temperature Throughout Year | 1 of 5
