Climate for Station: Hailar, Inner Mongolia, China
Loading live weather...
Climate Analysis & Overview
Hailar's climate is marked by a warming trend in both high and low temperatures, with a notable shift towards more evenly distributed precipitation. This aligns with regional climate goals aimed at managing extreme weather events more effectively.
Continental Climate Dynamics
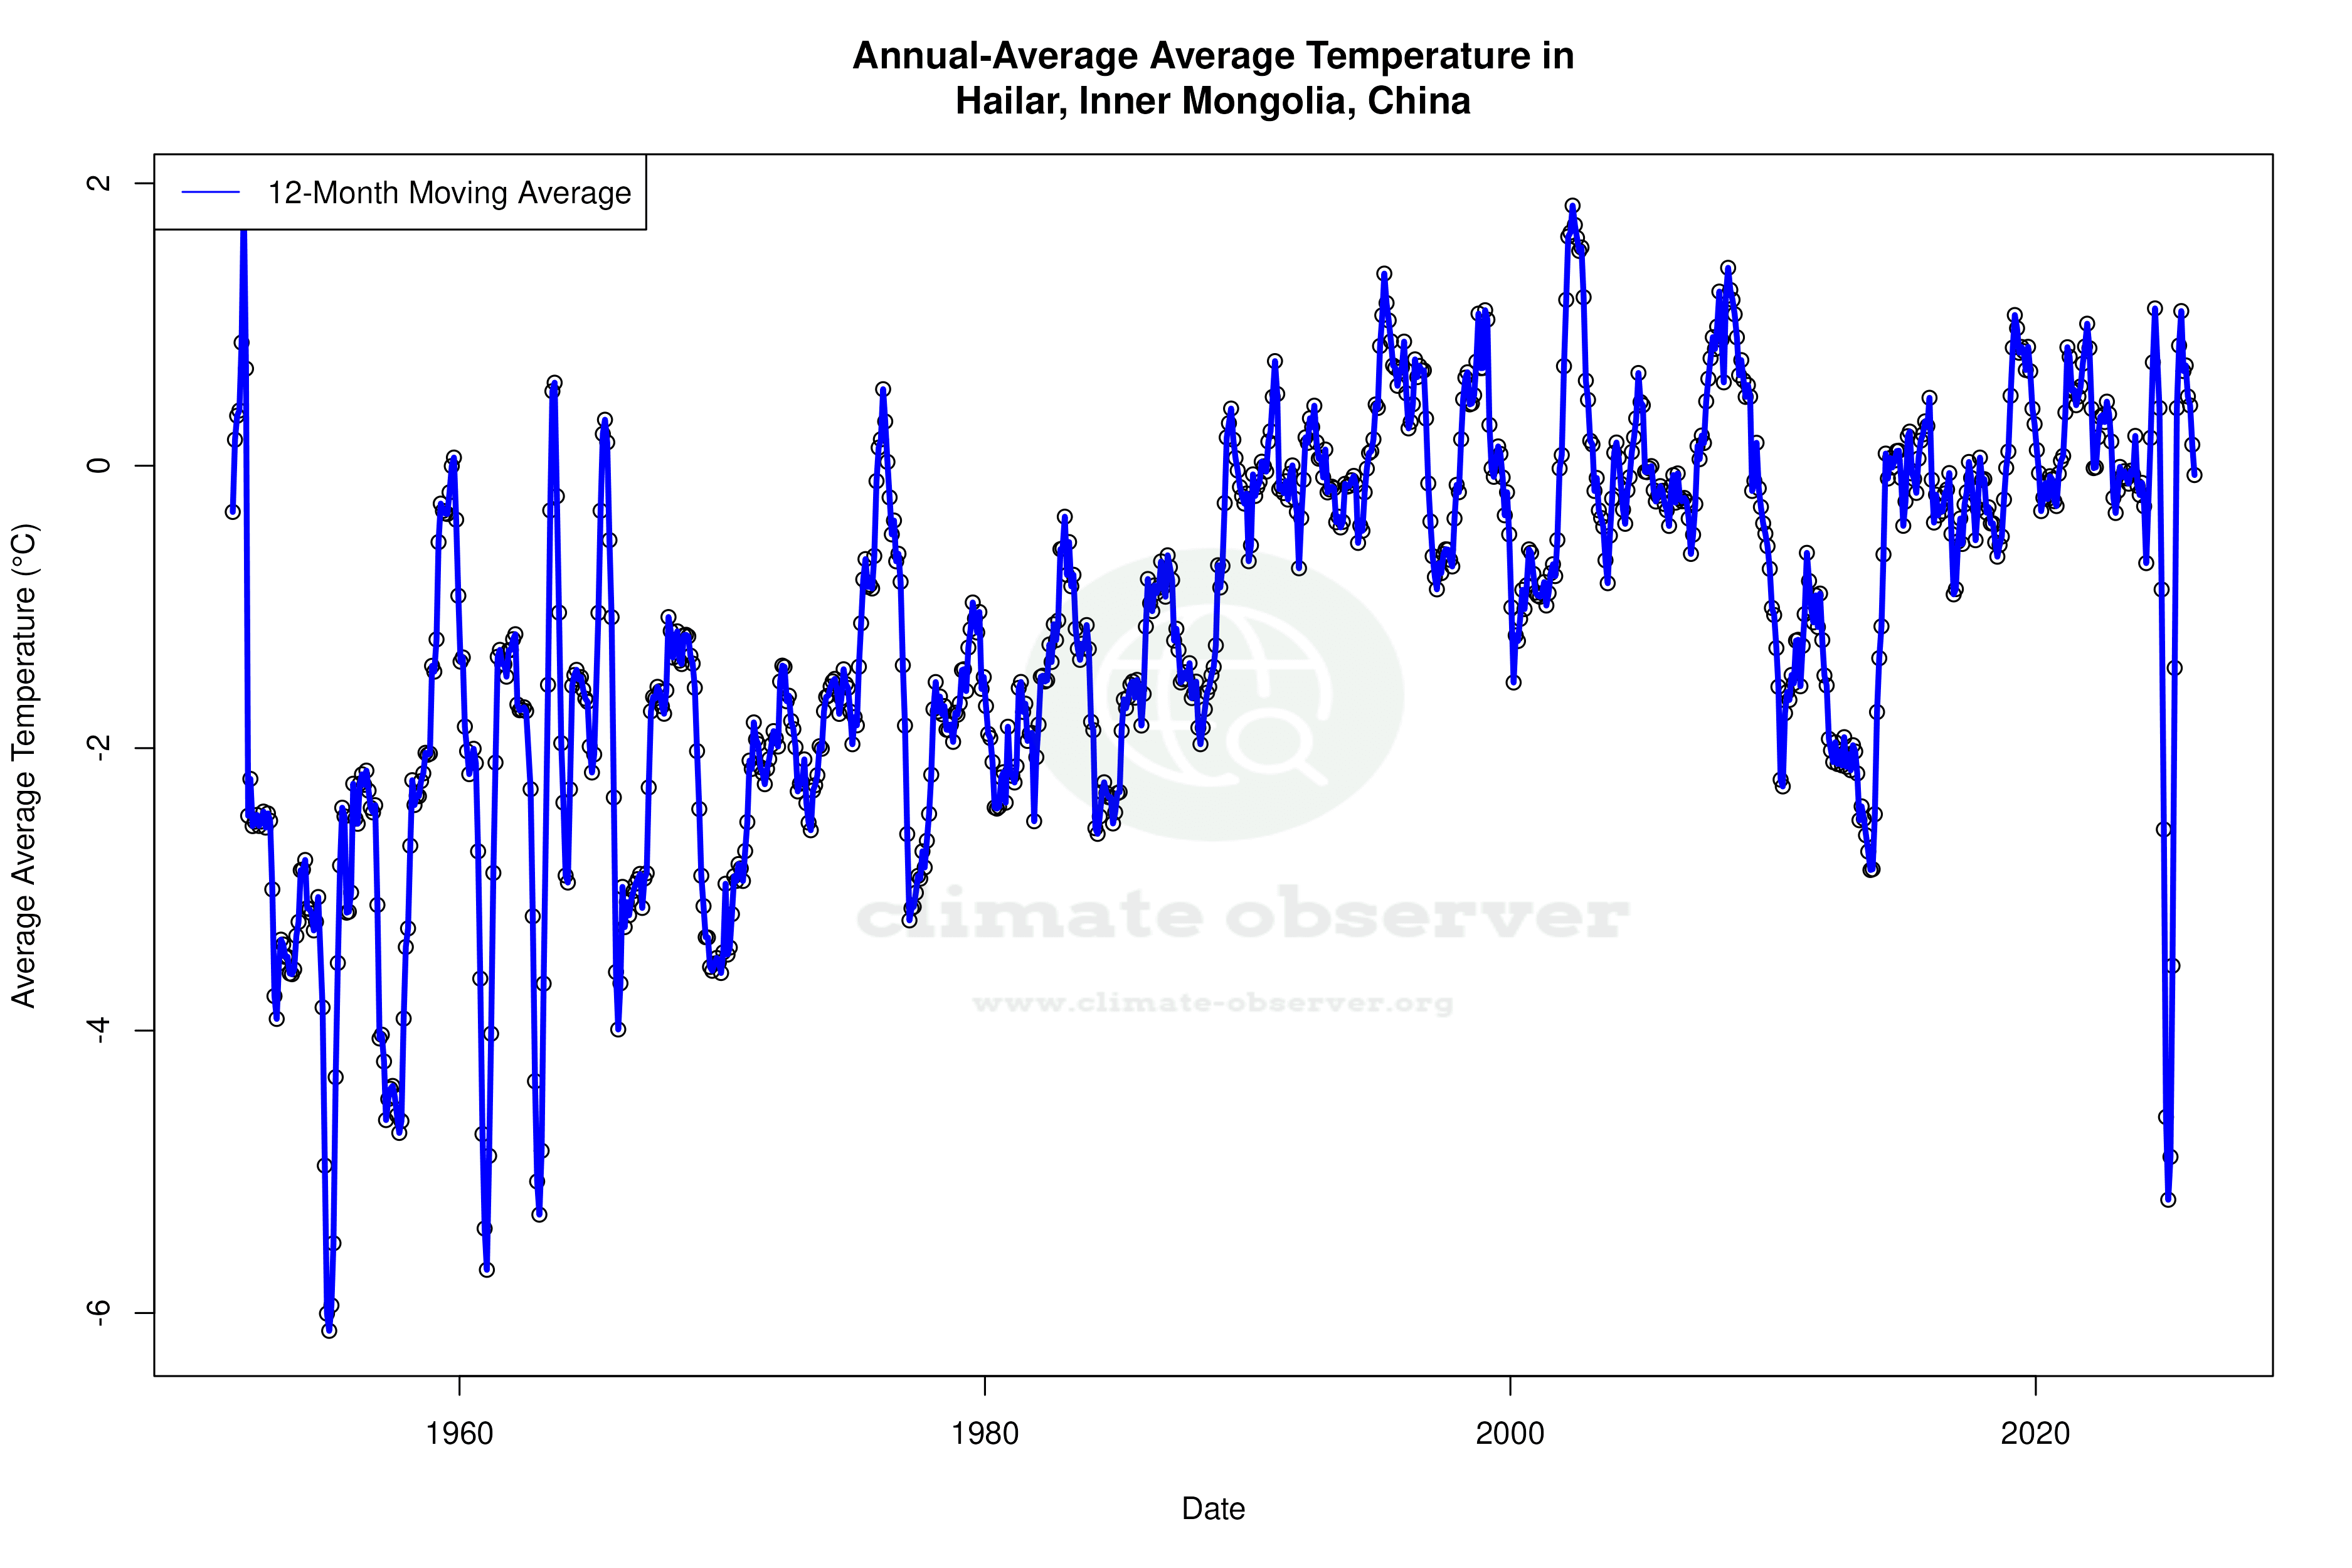
Hailar, located in the Inner Mongolia Autonomous Region of China, is classified under the Köppen climate classification as Dwb, indicating a monsoon-influenced subarctic climate. This region experiences long, frigid winters and short, warm summers. The geographical setting, characterised by its elevation and distance from large bodies of water, contributes to significant temperature variations. Over the past decade, Hailar has experienced a warming trend, with high temperatures rising by 1.04°C (1.87°F) and lows increasing by 0.17°C (0.31°F). This recent warming is more pronounced than the all-time trend, which shows a rise of 0.23°C (0.41°F) in highs and 0.50°C (0.90°F) in lows, indicating a long-term warming pattern.
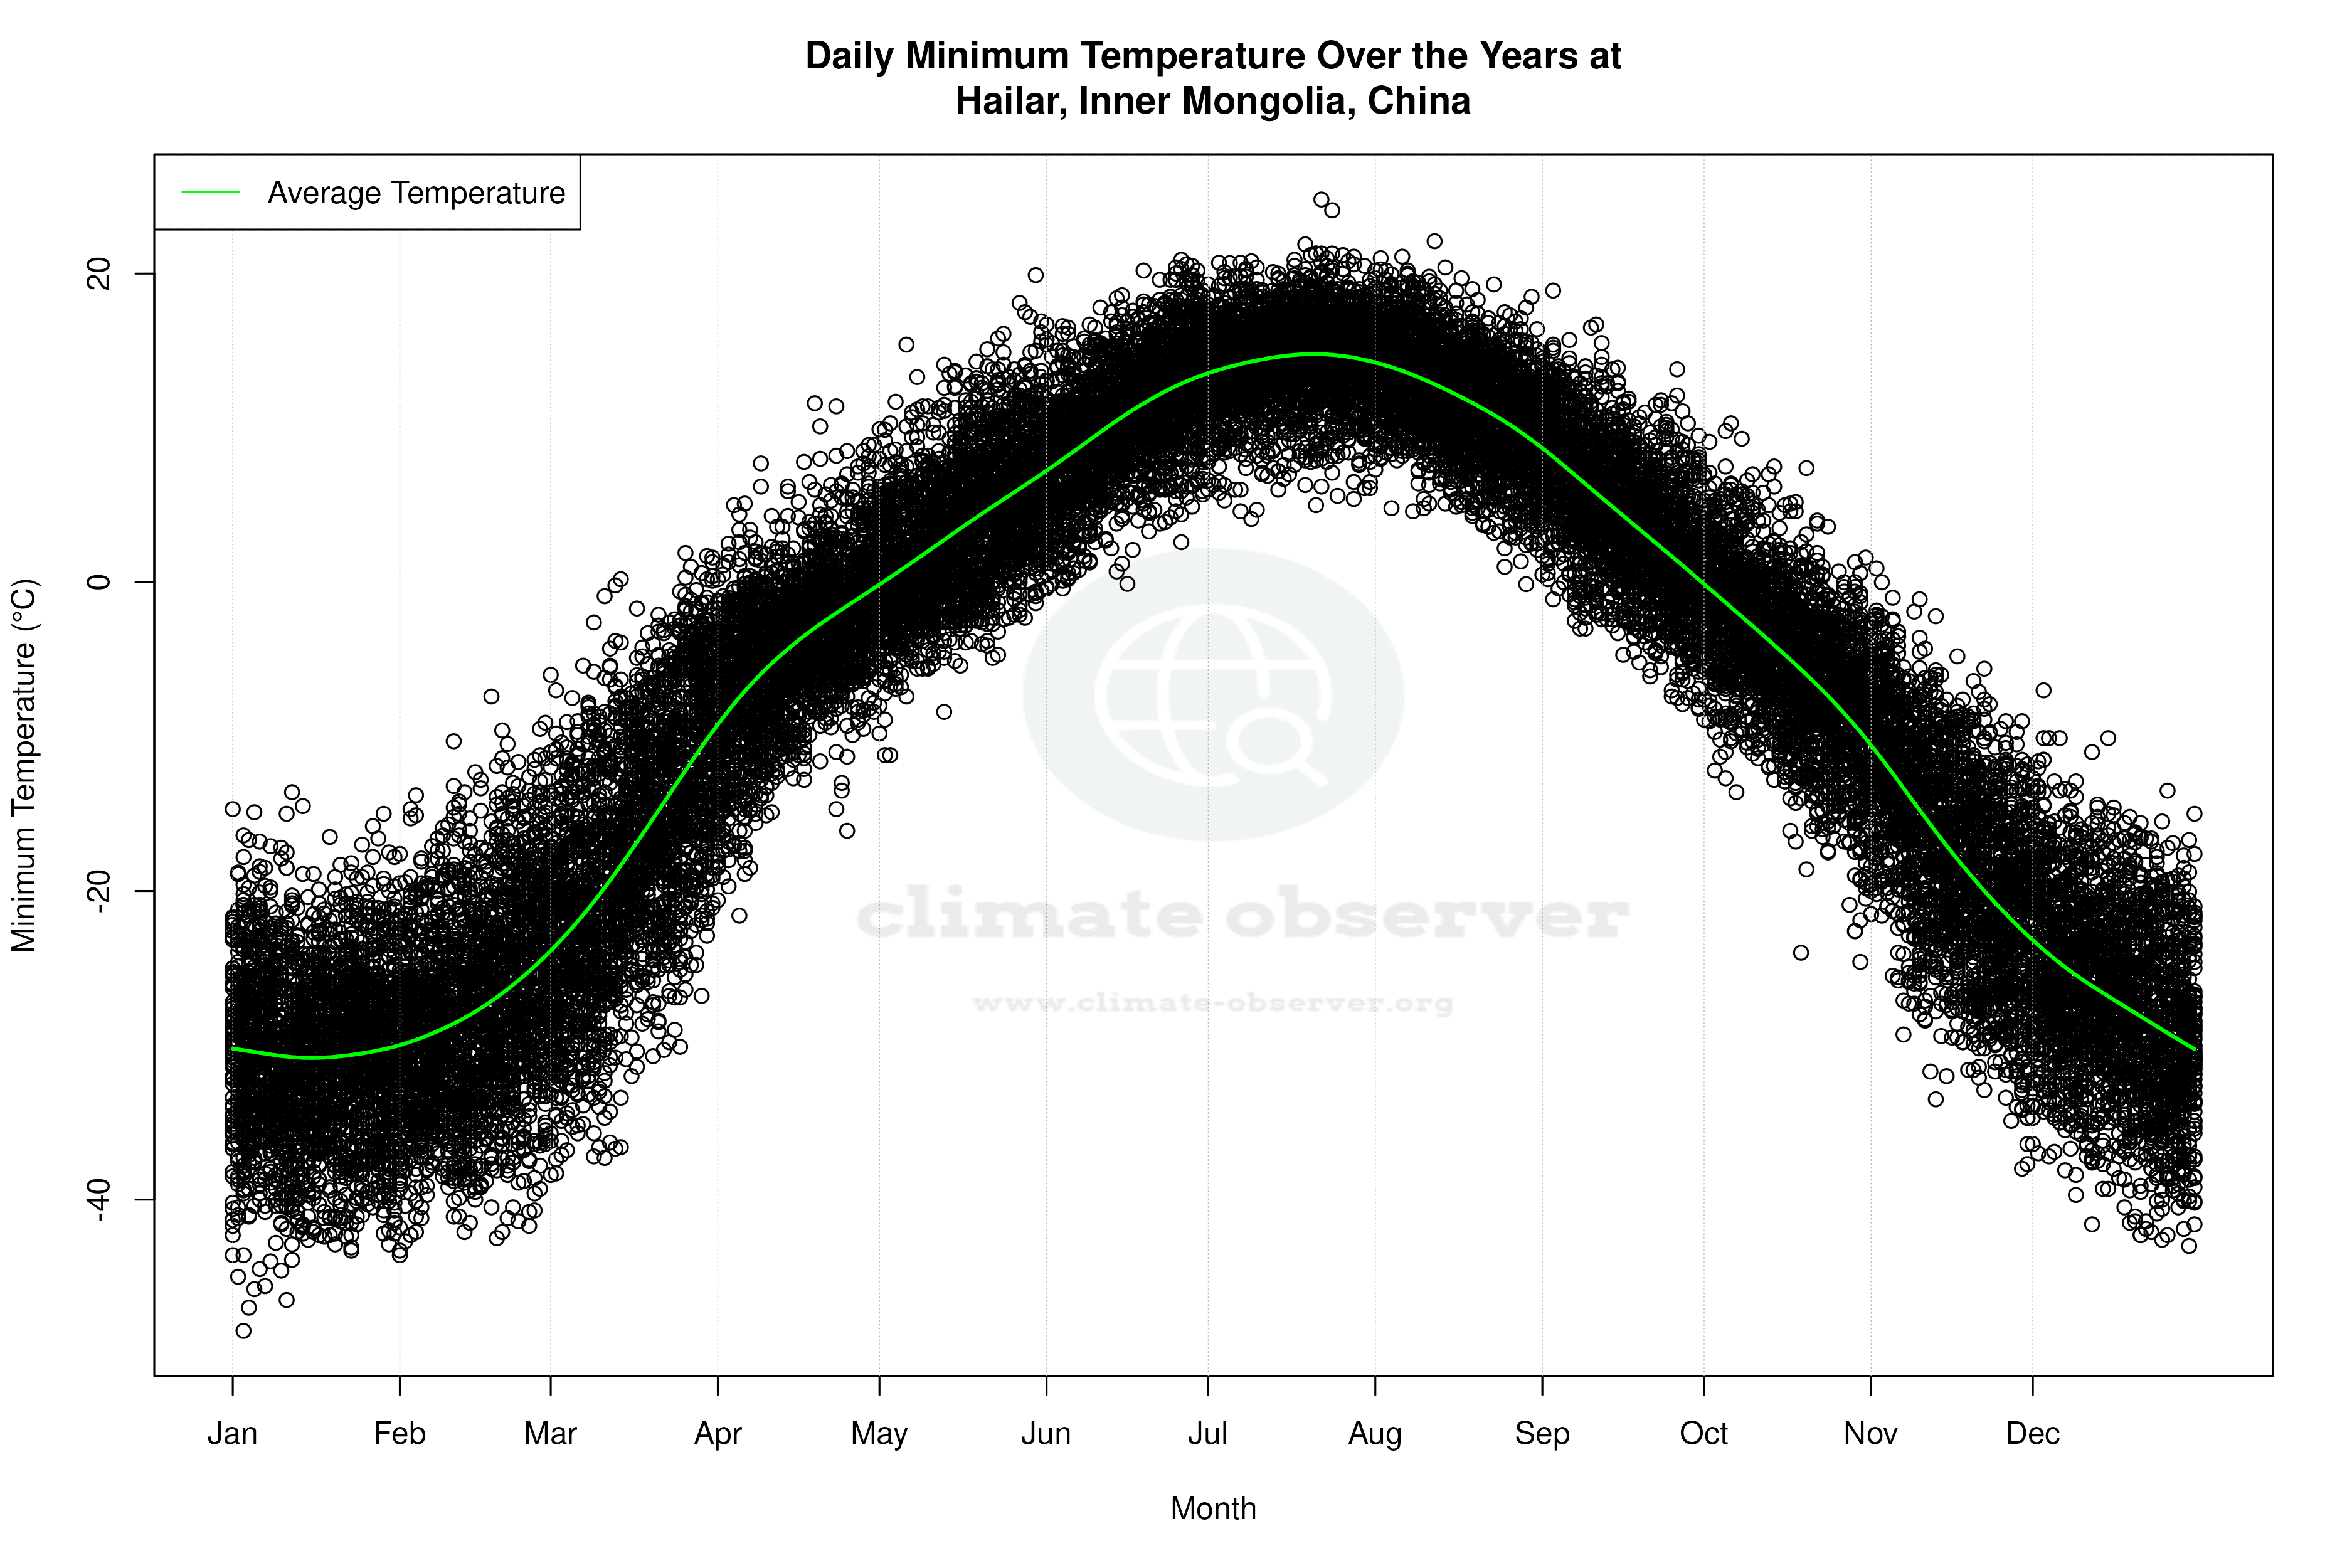
Temperature Extremes and Records
Hailar's climate is defined by its temperature extremes, with a record high of 39.73°C (103.51°F) and a record low of -48.5°C (-55.3°F). These extremes underscore the region's susceptibility to significant thermal oscillations, a common feature in continental climates. The warming trend noted in both recent and long-term data suggests a shift towards milder conditions, which may influence local ecosystems and agricultural practices.
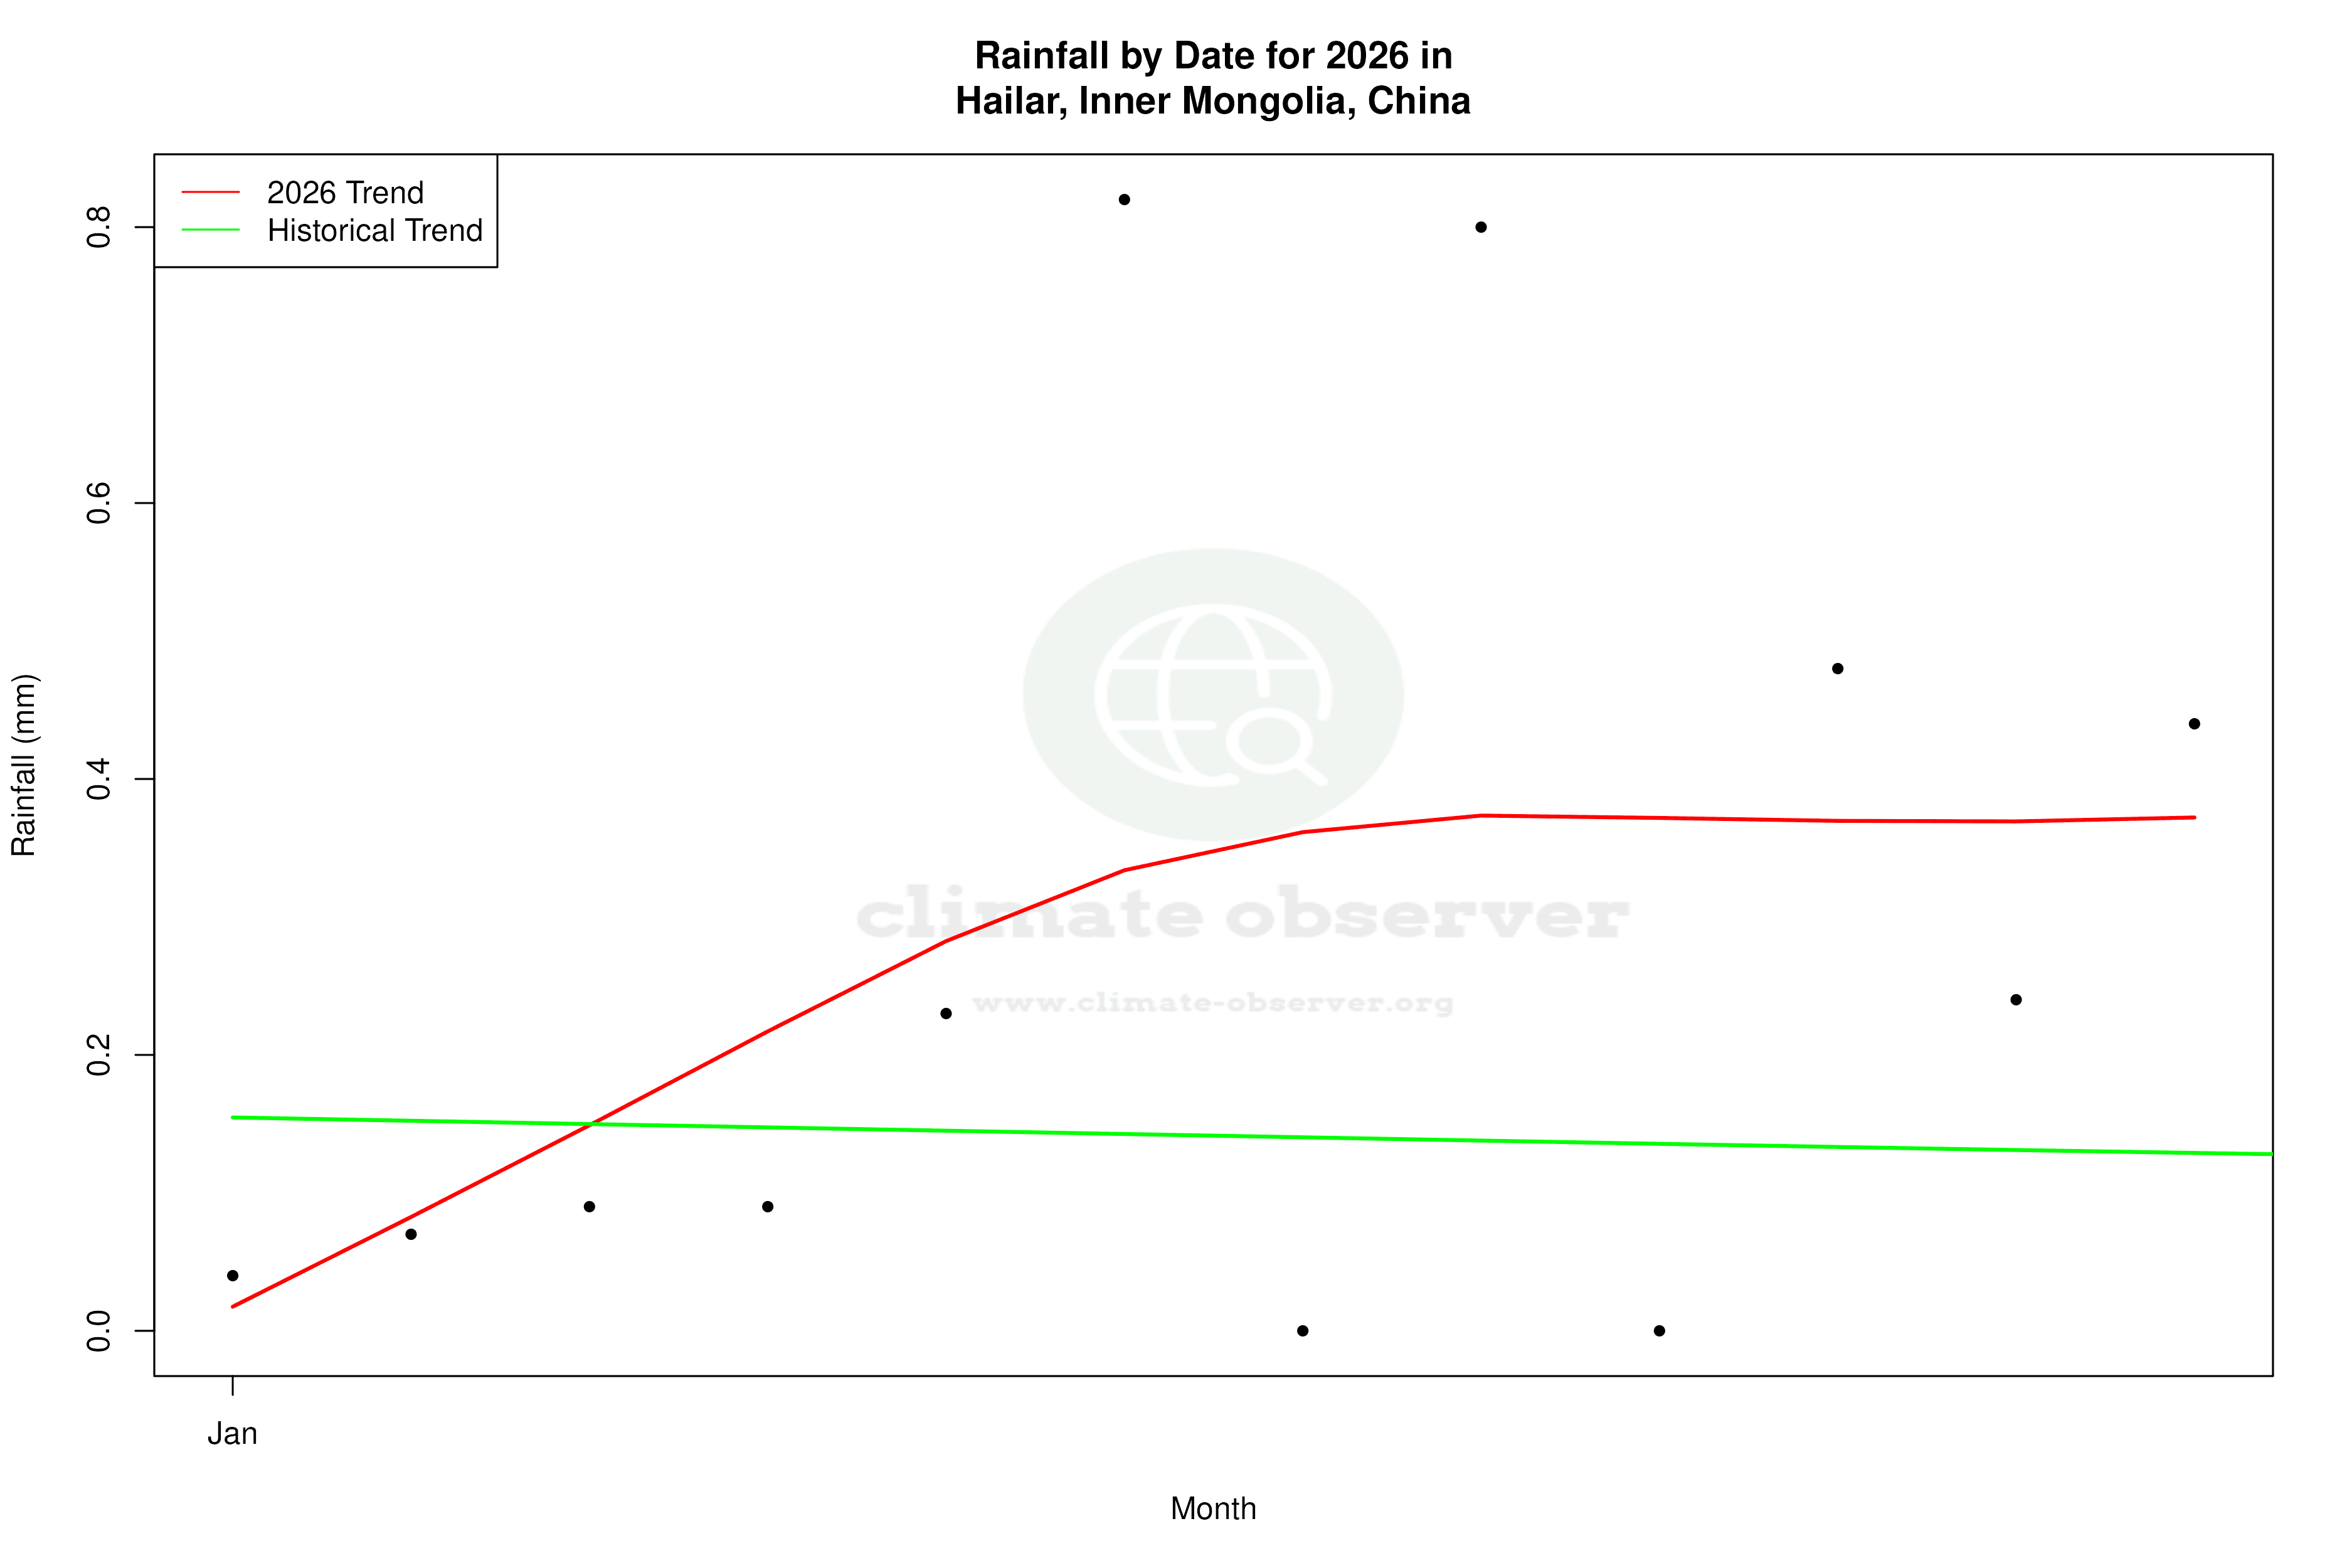
Precipitation Patterns and PCI Insights
The Precipitation Concentration Index (PCI) for Hailar has decreased from a baseline of 19.01 to a current value of 16.59, indicating a shift towards more evenly distributed rainfall events. The PCI measures how precipitation is spread over time, with higher values indicating concentration in fewer events. This decrease suggests that precipitation is becoming less concentrated, potentially reducing the risk of flooding and improving water availability throughout the year. This trend aligns with China's regional climate goals, which focus on mitigating the impacts of extreme weather events and promoting sustainable water management.
Regional Climate Implications
The observed warming trends and changes in precipitation patterns in Hailar are consistent with broader climatic shifts across China. These changes are critical as the nation works towards its climate goals, including reducing greenhouse gas emissions and enhancing resilience to climate change. The shift towards more evenly distributed precipitation can aid in achieving these objectives by reducing the frequency and severity of extreme weather events, which are a significant concern for local communities and policymakers.
Future Considerations
As Hailar continues to experience these climatic changes, ongoing monitoring and adaptation strategies will be essential. The warming trends and evolving precipitation patterns highlight the need for proactive measures to manage potential impacts on agriculture, water resources, and infrastructure. These insights are vital for informing policy decisions and ensuring the region's resilience in the face of a changing climate.
Station Statistics
10-Year Trend
High: +1.93 °C/decade
Low: -0.70 °C/decade
Rain: +0.23 mm/decade
25-Year Trend
High: +0.18 °C/decade
Low: -0.29 °C/decade
Rain: +0.24 mm/decade
50-Year Trend
High: +0.23 °C/decade
Low: +0.27 °C/decade
Rain: +0.04 mm/decade
All-Time Trend
High: +0.25 °C/decade
Low: +0.49 °C/decade
Rain: +0.03 mm/decade
Percentage Above-Average Days
Last 12 Months: 53.2%
This Year: 76.3%
Precipitation Concentration Index (PCI) ℹ️
Last 12 Months: 17.8
Historical Average: 22.9
Percentile Rank of Last 12 Months ℹ️
High: 96th percentile
Low: 73rd percentile
Rain: 76th percentile
Change in Variance ℹ️
High: -3.0%
Low: -7.6%
Intraday: -6.6%
Data Coverage
100.0%
First Year of Data
1980
Station Location
Historical Weather Records
| Max High | Avg High | Min High | Max Avg | Avg Avg | Min Avg | Max Low | Avg Low | Min Low | Max Precipitation | Avg Precipitation | Max Snow | Avg Snow | |
|---|---|---|---|---|---|---|---|---|---|---|---|---|---|
| Record | 39.7 °C | — | -37.6 °C | 30.9 °C | — | -42.6 °C | 24.8 °C | — | -48.5 °C | 85.6 mm | — | — | — |
| January | -1.0 °C | -19.8 °C | -37.6 °C | -6.9 °C | -25.7 °C | -42.6 °C | -13.6 °C | -30.6 °C | -48.5 °C | 5.6 mm | 0.1 mm | — | — |
| February | 4.3 °C | -14.7 °C | -30.7 °C | -2.6 °C | -21.8 °C | -37.7 °C | -7.4 °C | -27.6 °C | -43.6 °C | 3.9 mm | 0.1 mm | — | — |
| March | 19.3 °C | -4.0 °C | -24.2 °C | 11.6 °C | -10.8 °C | -31.8 °C | 1.9 °C | -17.2 °C | -38.4 °C | 7.9 mm | 0.2 mm | — | — |
| April | 29.4 °C | 8.7 °C | -8.2 °C | 19.1 °C | 2.1 °C | -14.0 °C | 11.6 °C | -4.2 °C | -21.6 °C | 19.1 mm | 0.5 mm | — | — |
| May | 35.4 °C | 18.0 °C | 1.3 °C | 27.3 °C | 11.0 °C | -1.4 °C | 19.9 °C | 3.4 °C | -11.2 °C | 36.6 mm | 0.8 mm | — | — |
| June | 38.8 °C | 24.2 °C | 9.1 °C | 30.2 °C | 17.6 °C | 3.0 °C | 20.9 °C | 10.7 °C | -0.4 °C | 54.3 mm | 1.9 mm | — | — |
| July | 39.5 °C | 26.1 °C | 14.2 °C | 30.5 °C | 20.2 °C | 10.5 °C | 24.8 °C | 14.4 °C | 4.1 °C | 85.6 mm | 3.4 mm | — | — |
| August | 39.7 °C | 23.9 °C | 7.4 °C | 30.9 °C | 17.7 °C | 4.6 °C | 22.1 °C | 12.0 °C | -0.1 °C | 60.8 mm | 2.8 mm | — | — |
| September | 33.2 °C | 17.4 °C | 2.9 °C | 23.8 °C | 10.5 °C | -1.3 °C | 18.9 °C | 4.4 °C | -8.2 °C | 59.1 mm | 1.3 mm | — | — |
| October | 26.9 °C | 7.7 °C | -11.8 °C | 18.2 °C | 0.8 °C | -17.2 °C | 10.3 °C | -4.8 °C | -24.6 °C | 24.2 mm | 0.5 mm | — | — |
| November | 13.7 °C | -6.0 °C | -25.6 °C | 5.4 °C | -12.1 °C | -32.7 °C | 0.9 °C | -17.1 °C | -38.0 °C | 6.9 mm | 0.2 mm | — | — |
| December | 2.4 °C | -16.8 °C | -33.8 °C | -4.9 °C | -22.3 °C | -38.4 °C | -7.0 °C | -27.0 °C | -43.0 °C | 8.4 mm | 0.2 mm | — | — |
Data Visualisations
Remove WatermarksCurrent Year Climate Trends vs Historical


Max Temperature this Year | 1 of 6
Climate 12-Month Moving Averages


Max Temperature 12-Month MA | 1 of 6
Daily Data Points and Averages Throughout the Year


Average Max Temperature Throughout Year | 1 of 5
