Climate for Station: Kuqa, Xinjiang Uygur, China
Loading live weather...
Climate Analysis & Overview
Kuqa's climate has experienced a complex interplay of warming highs and cooling lows over the decades. While recent years have shown a notable warming trend in high temperatures, the long-term data indicates a more nuanced picture with cooling lows. The region's precipitation is becoming slightly more evenly distributed, reflecting subtle shifts in its arid climate dynamics.
Desert Climate Dynamics
Kuqa, located in the Xinjiang Uygur Autonomous Region of China, is classified under the Köppen climate system as a cold desert (BWk). This classification is shaped by its geographical position, nestled between the Tianshan Mountains to the north and the Taklamakan Desert to the south. These natural barriers significantly influence local weather patterns, creating a unique climate profile characterised by extreme temperature variations and limited precipitation.
Temperature Trends: A Tale of Two Extremes
Over the past decade, Kuqa has witnessed a warming trend in its high temperatures, with an increase of 0.56°C (1.01°F). This recent warming contrasts with the all-time trend, which shows a more modest rise of 0.20°C (0.36°F). Meanwhile, the low temperatures tell a different story, with a cooling trend of -0.33°C (-0.59°F) over the last ten years, which aligns with the all-time cooling trend of -0.24°C (-0.43°F). These contrasting trends highlight the region's complex thermal dynamics, where daytime warming is juxtaposed with nighttime cooling.
Precipitation Patterns: Subtle Shifts
Kuqa's Precipitation Concentration Index (PCI) has seen a slight decrease from a baseline of 21.84 to the current 20.83. The PCI measures how precipitation is distributed throughout the year, with higher values indicating more concentrated rainfall events. Despite the slight decrease, the PCI remains above 20, suggesting that precipitation is still relatively concentrated, though now slightly more evenly distributed than before. This subtle shift may have implications for local water resource management and agricultural practices.
Record Extremes: A Region of Contrasts
The region's temperature extremes further underscore its climatic volatility. Kuqa has recorded a maximum temperature of 43.28°C (109.90°F), reflecting its potential for intense summer heat. Conversely, the minimum temperature has plummeted to -27.40°C (-17.32°F), highlighting the harshness of its winters. These extremes are emblematic of the broader climatic challenges faced by the region, where adaptation and resilience are key to managing the impacts of such variability.
Implications for Regional Climate Goals
China's regional climate goals aim to balance economic development with sustainable environmental practices. In this context, understanding Kuqa's climate dynamics is crucial. The warming trend in high temperatures and the slight shift towards more evenly distributed precipitation could influence local policy decisions, particularly in sectors like agriculture and water management. As the nation continues to address climate change, insights from regions like Kuqa will be vital in shaping effective strategies.
Station Statistics
10-Year Trend
High: +0.96 °C/decade
Low: -1.10 °C/decade
Rain: -0.24 mm/decade
25-Year Trend
High: +0.68 °C/decade
Low: -0.50 °C/decade
Rain: +0.05 mm/decade
50-Year Trend
High: +0.35 °C/decade
Low: -0.30 °C/decade
Rain: +0.02 mm/decade
All-Time Trend
High: +0.20 °C/decade
Low: -0.25 °C/decade
Rain: +0.01 mm/decade
Percentage Above-Average Days
Last 12 Months: 54.8%
This Year: 36.8%
Precipitation Concentration Index (PCI) ℹ️
Last 12 Months: 23.7
Historical Average: 24.7
Percentile Rank of Last 12 Months ℹ️
High: 93rd percentile
Low: 6th percentile
Rain: 65th percentile
Change in Variance ℹ️
High: +3.7%
Low: -7.3%
Intraday: +45.1%
Data Coverage
100.0%
First Year of Data
1990
Station Location
Historical Weather Records
| Max High | Avg High | Min High | Max Avg | Avg Avg | Min Avg | Max Low | Avg Low | Min Low | Max Precipitation | Avg Precipitation | Max Snow | Avg Snow | |
|---|---|---|---|---|---|---|---|---|---|---|---|---|---|
| Record | 43.3 °C | — | -17.7 °C | 34.9 °C | — | -22.5 °C | 28.7 °C | — | -27.4 °C | 56.3 mm | — | — | — |
| January | 7.8 °C | -1.8 °C | -17.7 °C | 1.1 °C | -7.9 °C | -22.5 °C | -0.6 °C | -12.8 °C | -27.4 °C | 6.9 mm | 0.1 mm | — | — |
| February | 16.2 °C | 4.5 °C | -10.1 °C | 8.8 °C | -1.5 °C | -17.3 °C | 3.4 °C | -6.7 °C | -23.4 °C | 9.2 mm | 0.1 mm | — | — |
| March | 29.0 °C | 13.6 °C | -4.4 °C | 19.8 °C | 7.5 °C | -10.1 °C | 13.4 °C | 1.8 °C | -14.9 °C | 14.2 mm | 0.1 mm | — | — |
| April | 33.9 °C | 21.6 °C | 3.2 °C | 25.7 °C | 15.2 °C | 0.7 °C | 20.4 °C | 8.9 °C | -2.4 °C | 22.3 mm | 0.1 mm | — | — |
| May | 36.2 °C | 27.0 °C | 11.2 °C | 29.3 °C | 20.3 °C | 6.1 °C | 24.4 °C | 13.7 °C | -1.0 °C | 56.3 mm | 0.2 mm | — | — |
| June | 39.3 °C | 30.8 °C | 15.5 °C | 31.6 °C | 23.9 °C | 12.5 °C | 27.6 °C | 17.2 °C | 6.4 °C | 35.4 mm | 0.5 mm | — | — |
| July | 43.3 °C | 32.5 °C | 19.1 °C | 34.9 °C | 25.5 °C | 15.6 °C | 28.5 °C | 18.8 °C | 8.9 °C | 38.0 mm | 0.4 mm | — | — |
| August | 40.8 °C | 31.3 °C | 17.6 °C | 32.9 °C | 24.3 °C | 14.1 °C | 28.7 °C | 17.8 °C | 7.6 °C | 29.0 mm | 0.4 mm | — | — |
| September | 35.2 °C | 26.7 °C | 14.3 °C | 28.0 °C | 19.5 °C | 8.6 °C | 23.1 °C | 13.1 °C | 2.8 °C | 21.9 mm | 0.2 mm | — | — |
| October | 30.4 °C | 19.1 °C | 3.6 °C | 21.1 °C | 11.5 °C | 1.6 °C | 16.8 °C | 5.4 °C | -4.6 °C | 15.0 mm | 0.1 mm | — | — |
| November | 21.9 °C | 8.9 °C | -10.3 °C | 13.5 °C | 2.5 °C | -15.1 °C | 7.7 °C | -2.5 °C | -19.3 °C | 24.7 mm | 0.1 mm | — | — |
| December | 9.2 °C | -0.1 °C | -16.0 °C | 4.4 °C | -5.8 °C | -21.0 °C | 3.4 °C | -10.2 °C | -25.4 °C | 7.4 mm | 0.0 mm | — | — |
Data Visualisations
Remove WatermarksCurrent Year Climate Trends vs Historical


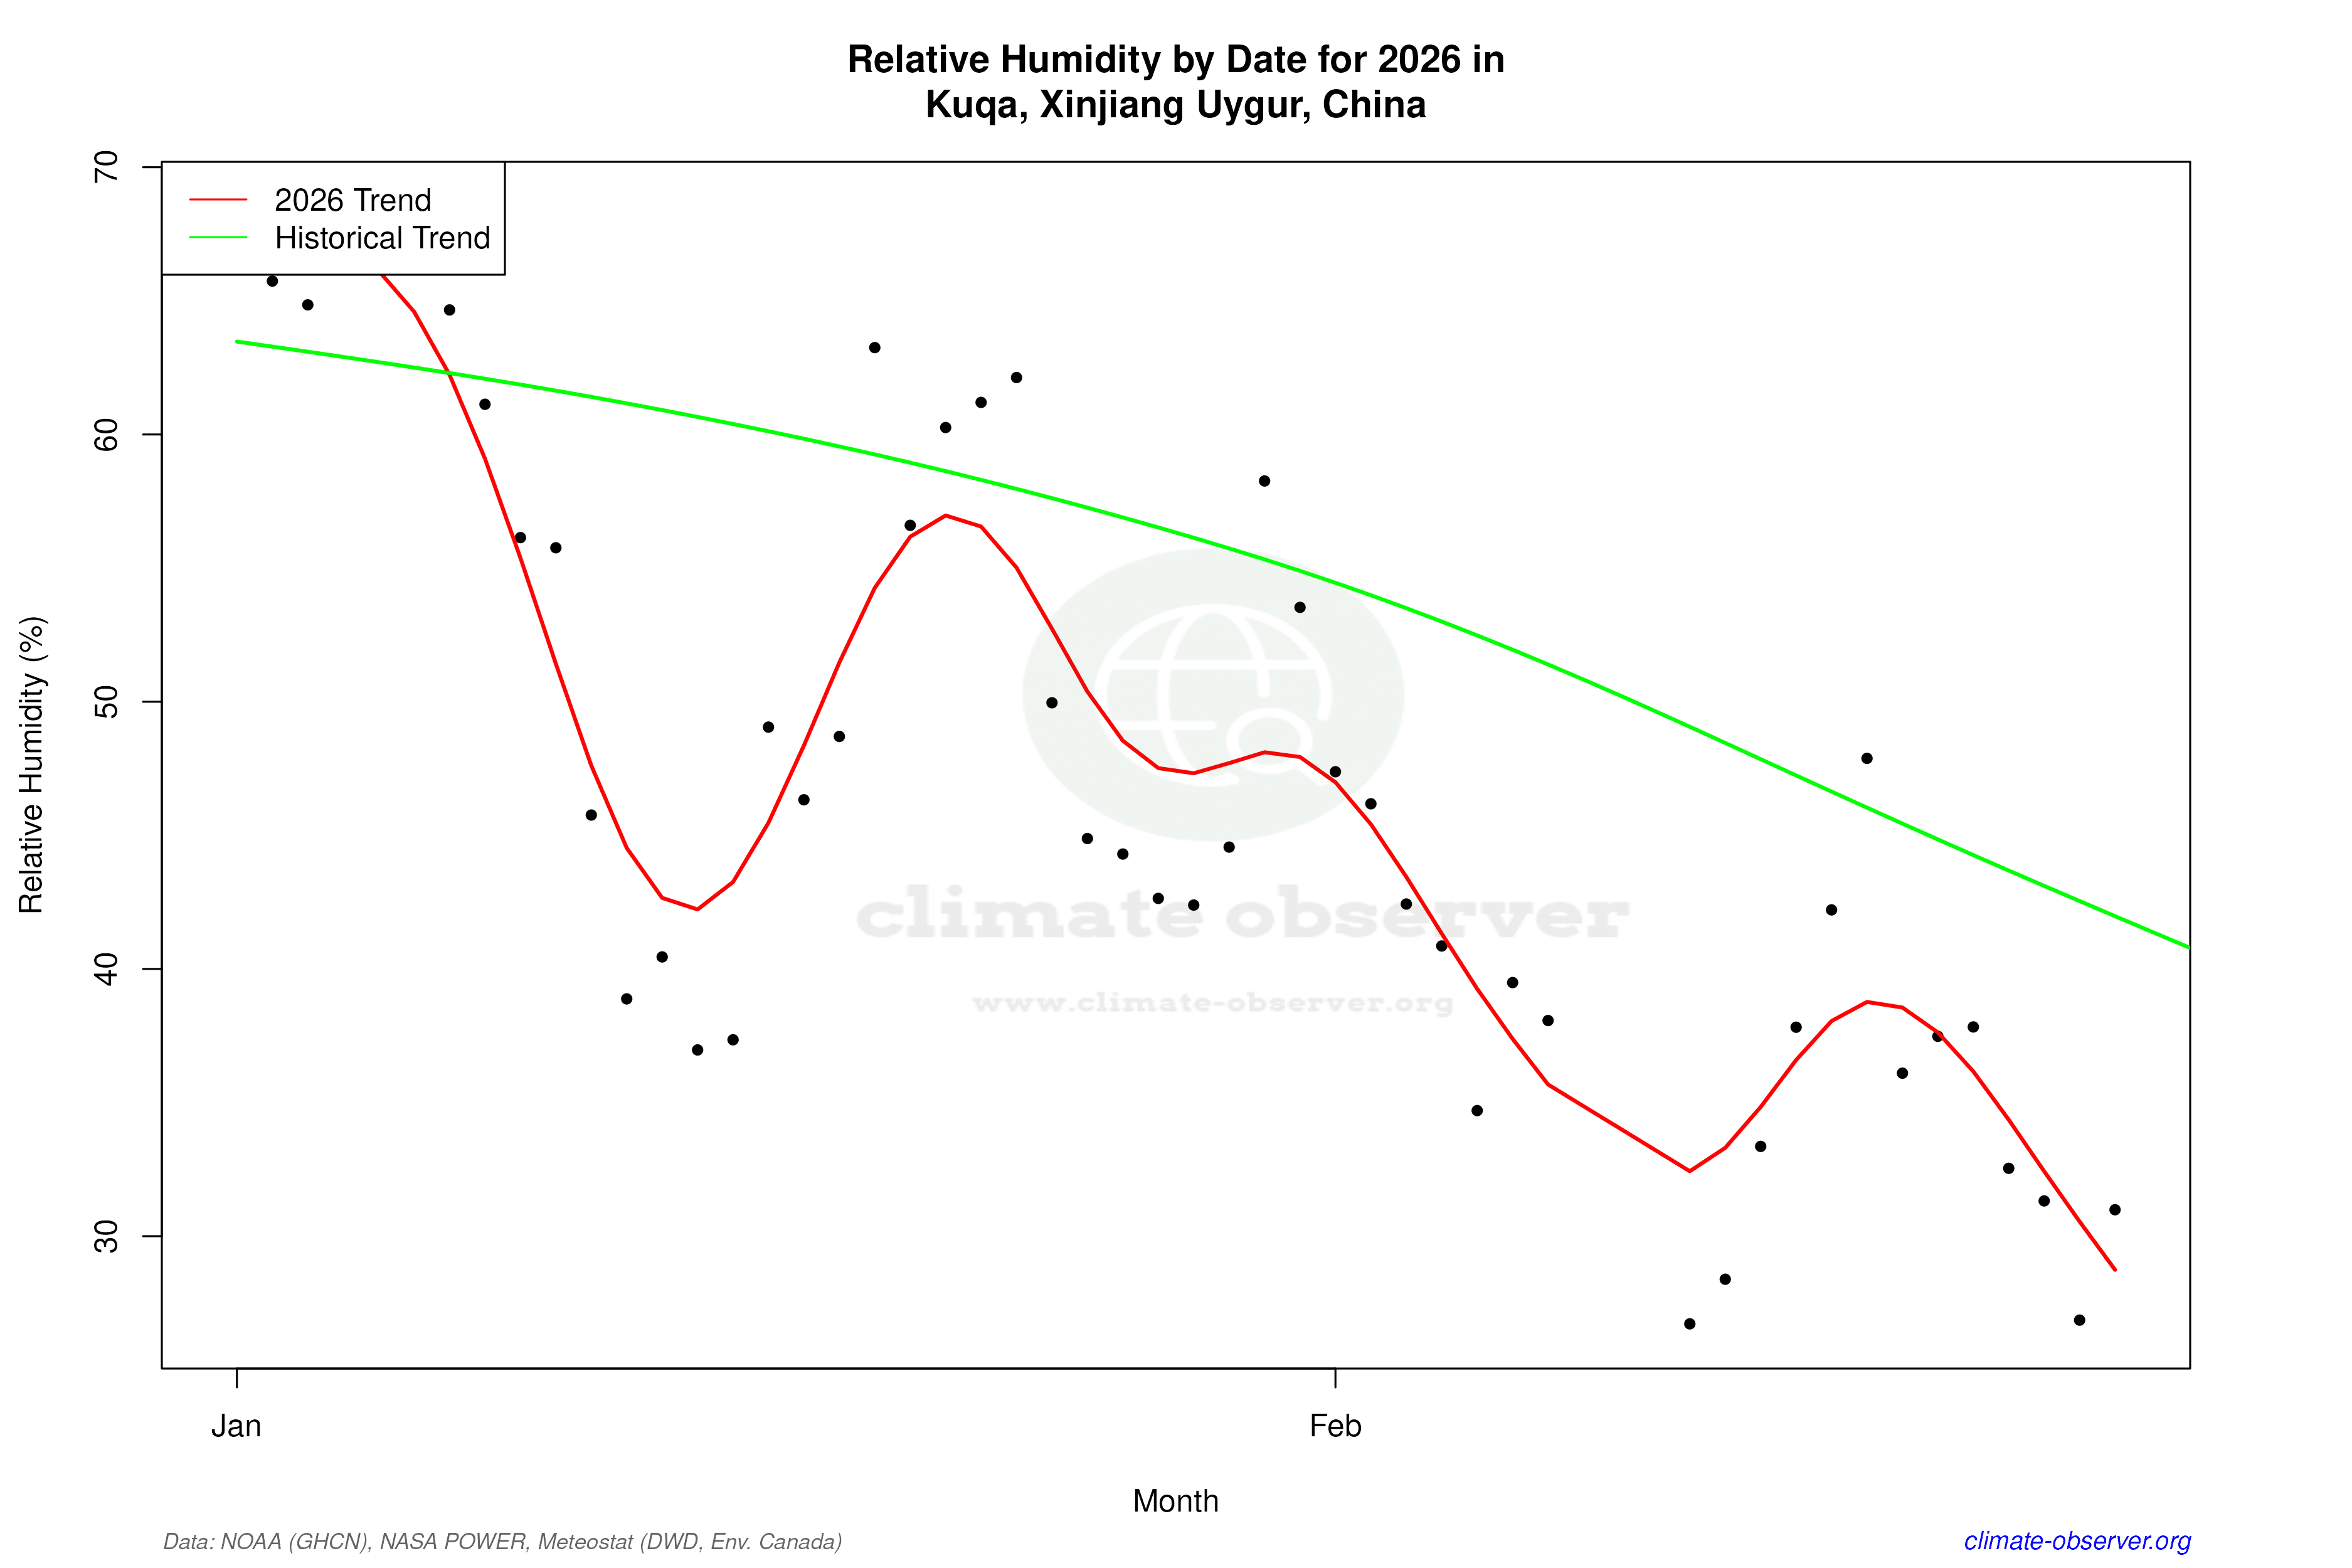

Max Temperature this Year | 1 of 6
Climate 12-Month Moving Averages


Max Temperature 12-Month MA | 1 of 6
Daily Data Points and Averages Throughout the Year

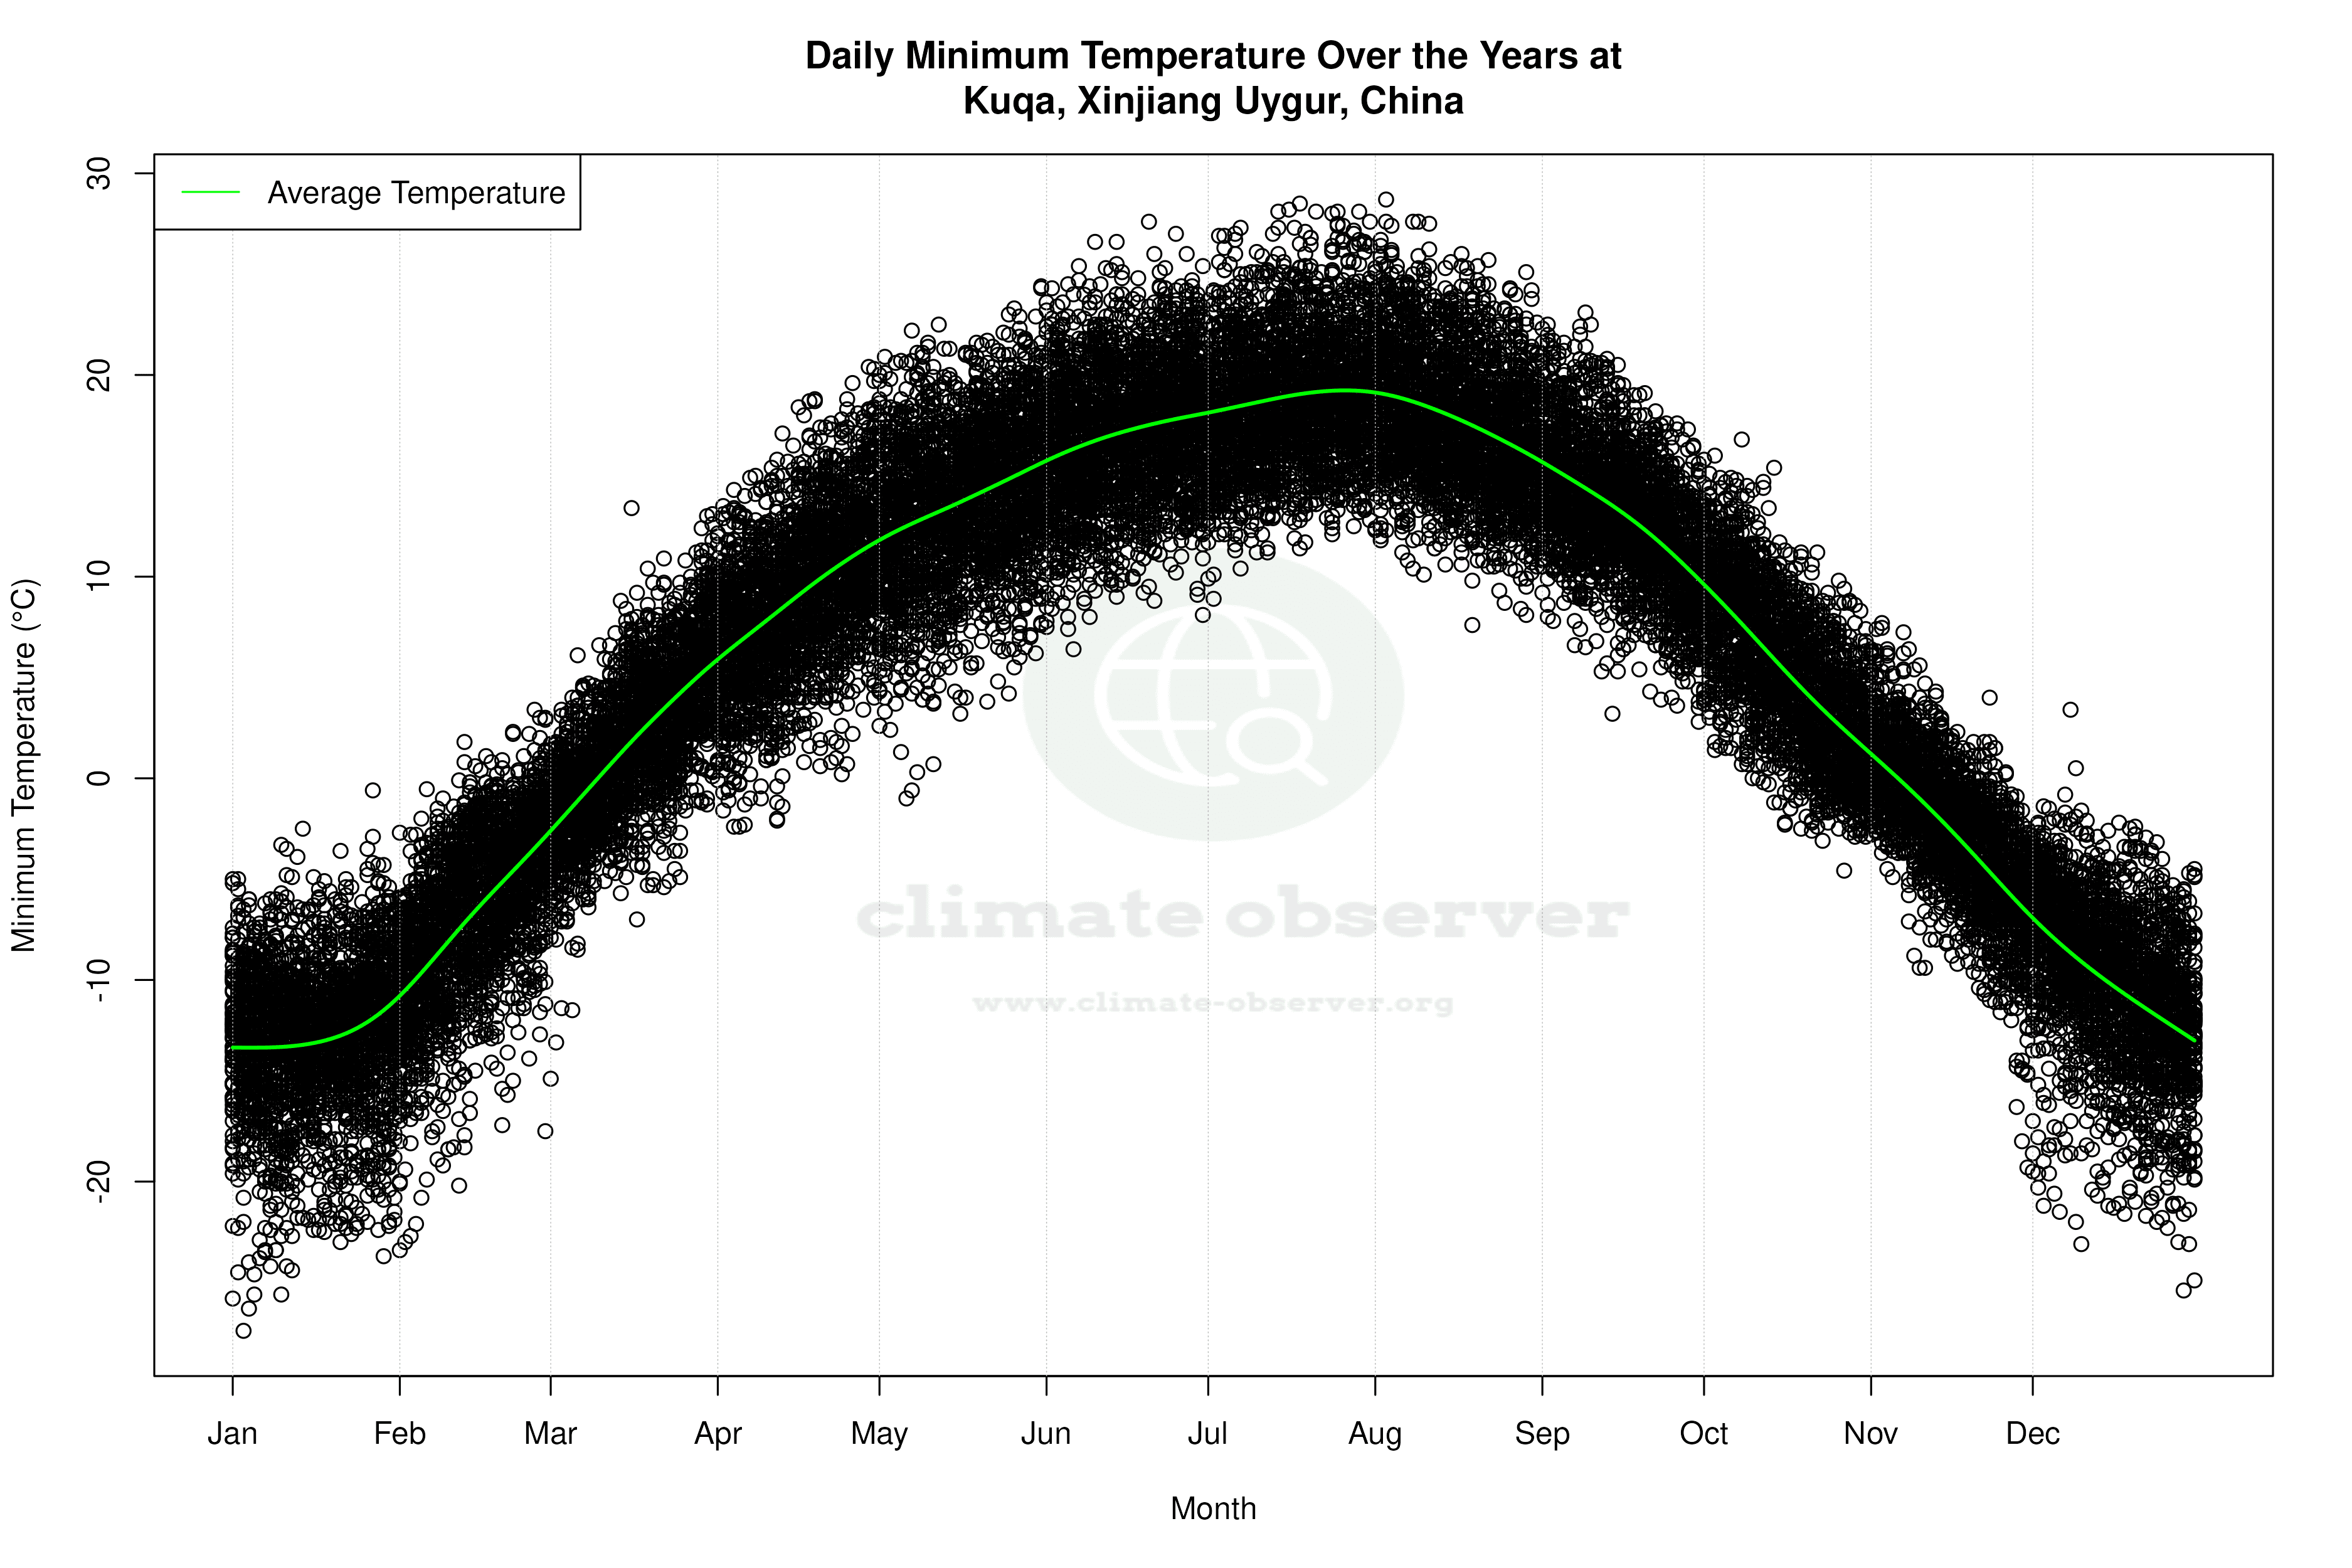

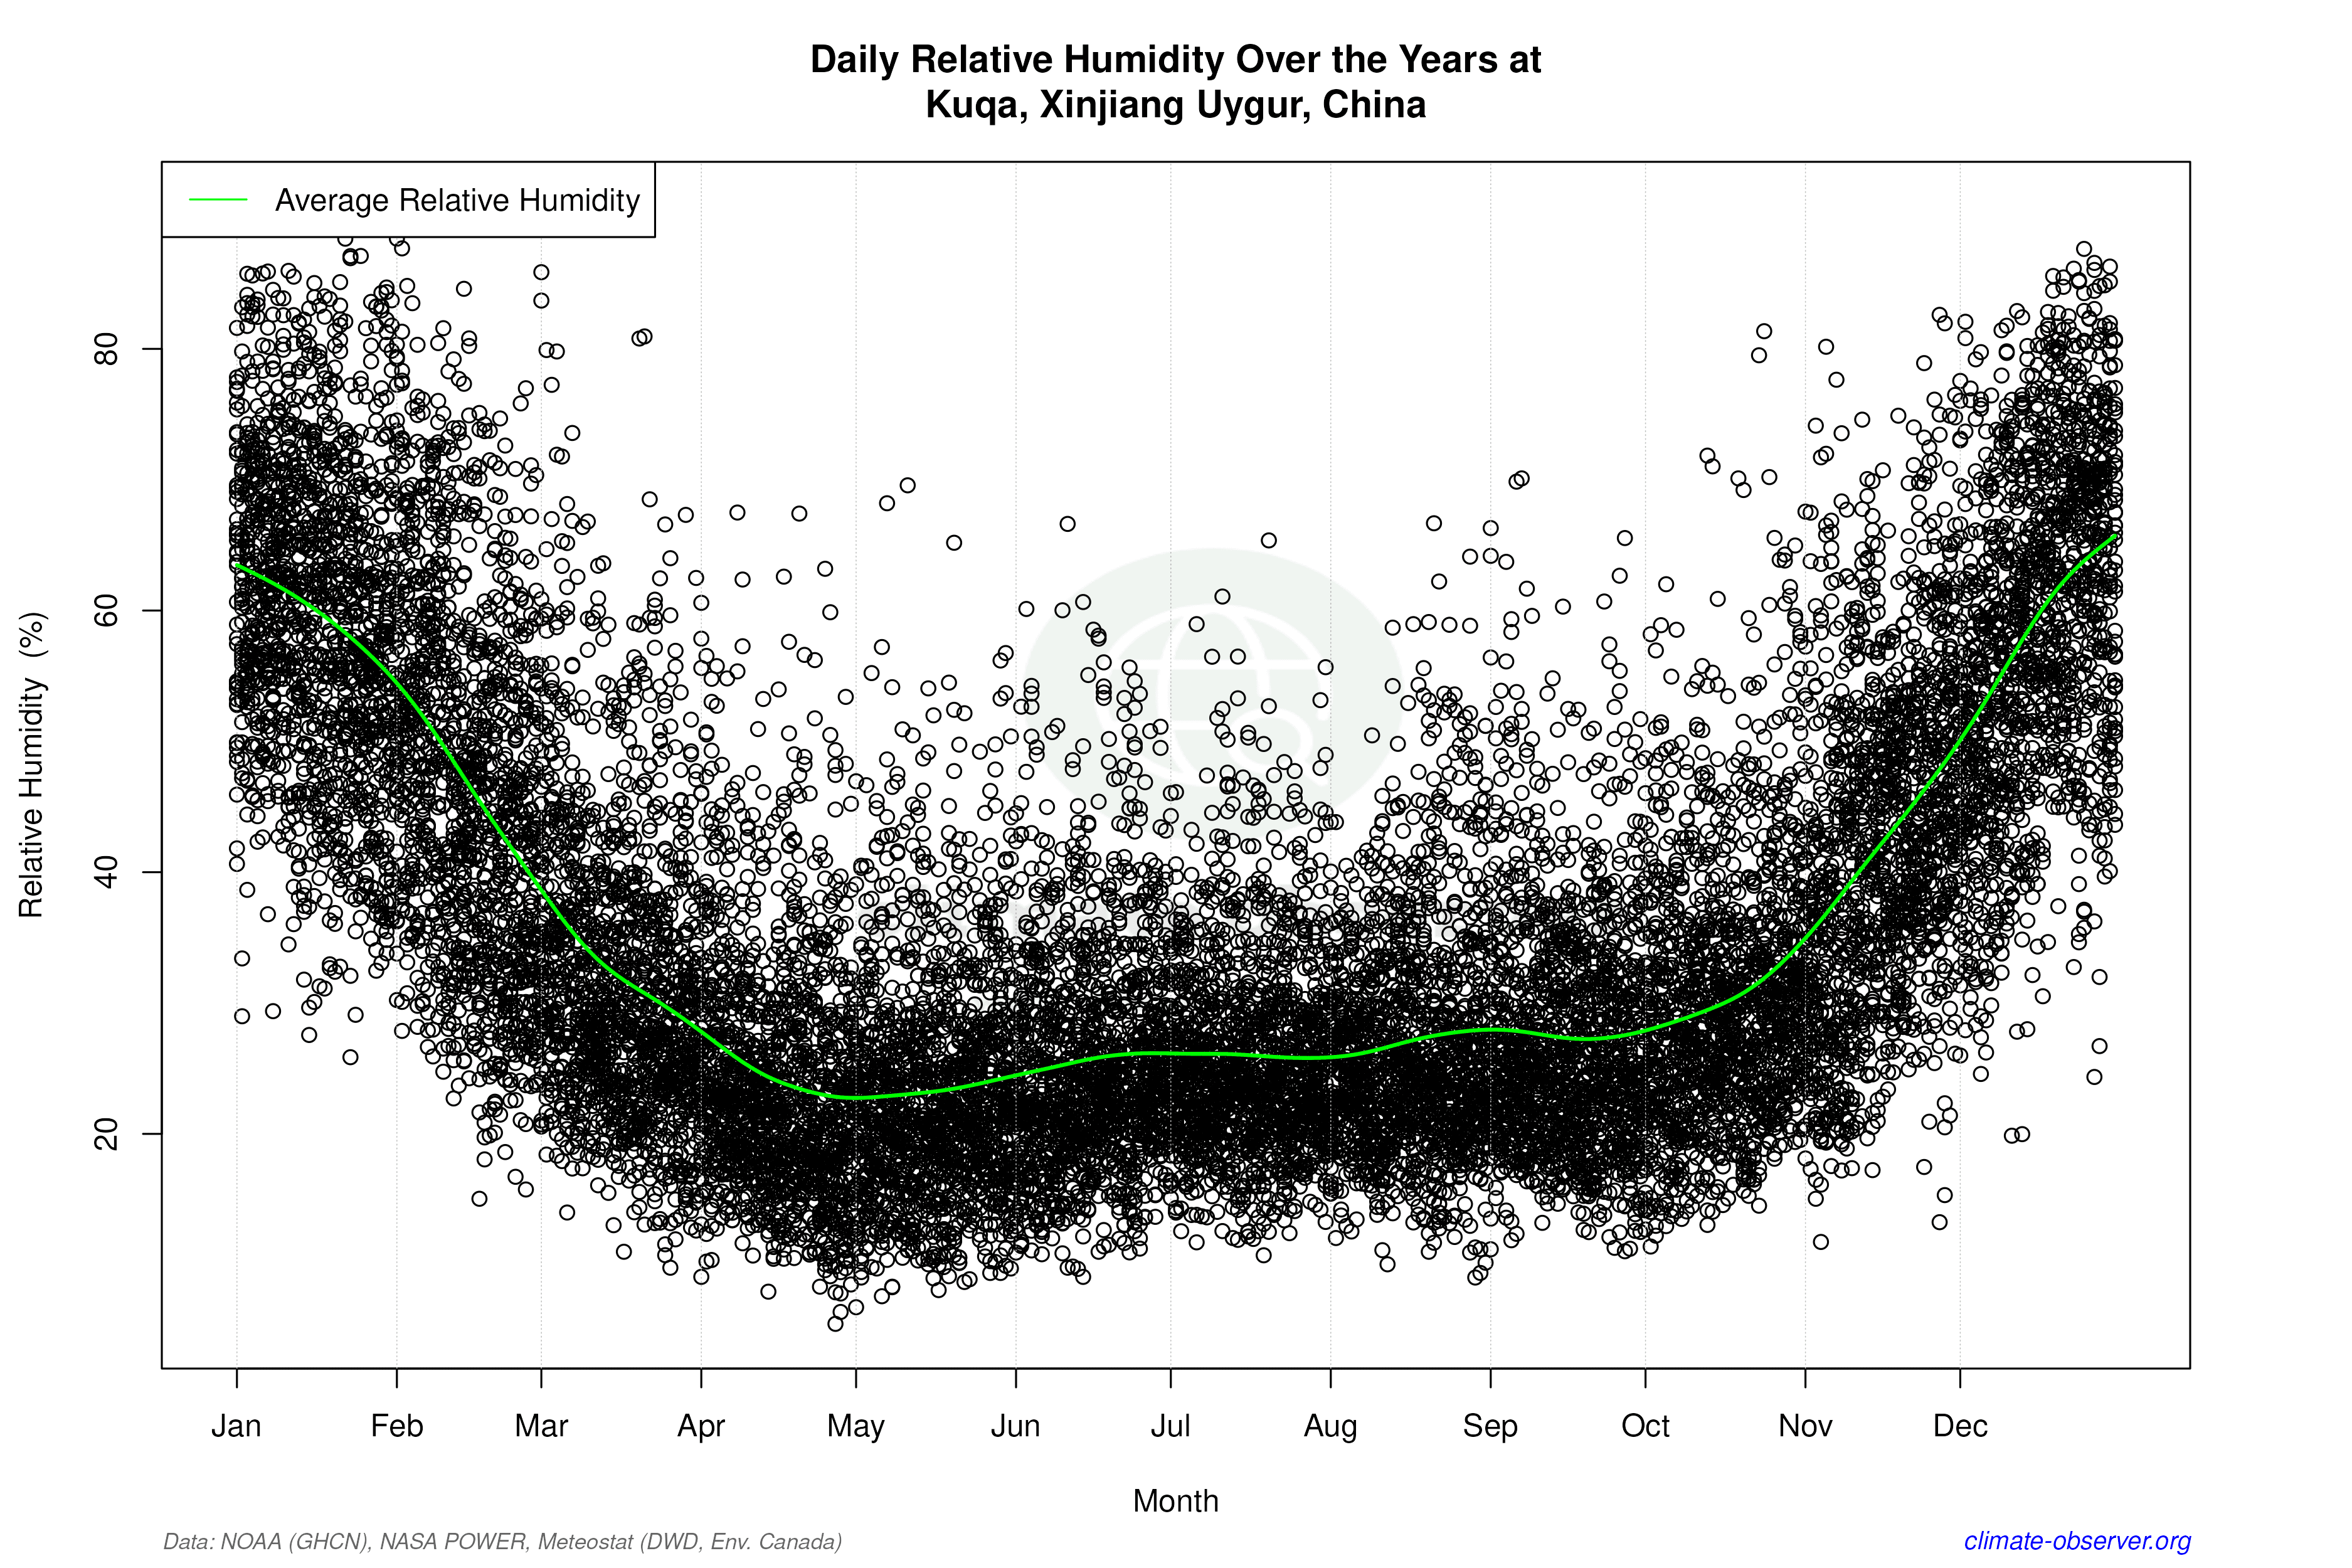

Average Max Temperature Throughout Year | 1 of 5
