Climate for Station: Yichang, Hubei, China
Loading live weather...
Climate Analysis & Overview
Yichang's climate is experiencing a notable warming trend, with a 2.17°C (3.91°F) rise in high temperatures over the past decade, contrasting with a more modest all-time increase of 0.07°C (0.13°F). Precipitation patterns have become slightly more even, as indicated by a marginal decrease in the Precipitation Concentration Index (PCI).
A City in Transition: Warming Trends in Yichang
Yichang, located at 30.7°N and 111.3°E, is nestled in the Hubei province of China, characterised by a humid subtropical climate under the Köppen classification. This region, influenced by the Yangtze River and surrounding mountainous terrain, is experiencing a warming trend. Over the last decade, high temperatures have risen by 2.17°C (3.91°F), while lows have increased by 1.60°C (2.88°F). These changes are more pronounced than the all-time trends, which show a more modest warming of 0.07°C (0.13°F) for highs and 0.05°C (0.09°F) for lows. This discrepancy suggests a recent acceleration in warming, possibly influenced by regional climate initiatives and urbanisation.
Temperature Extremes: Record Highs and Lows
Yichang's climate profile is punctuated by extreme temperatures, with a record high of 41.4°C (106.5°F) and a record low of -9.8°C (14.4°F). These extremes highlight the city's vulnerability to temperature fluctuations, which can impact both the environment and local communities. The warming trend, particularly over the past decade, suggests that such extremes may become more frequent or intense, aligning with broader global warming patterns.
Precipitation Patterns: A Slight Shift Towards Even Distribution
The Precipitation Concentration Index (PCI), which measures how precipitation is distributed over time, has shown a slight decrease from a baseline of 13.53 to a current value of 13.42. This indicates a marginal shift towards more evenly distributed rainfall events in Yichang. While the change is not significant, it could suggest a trend towards less concentrated, more predictable precipitation patterns, which can have implications for agriculture and water management in the region.
Regional Implications: Aligning with China's Climate Goals
Yichang's climatic shifts occur within the context of China's broader climate goals, which aim to reduce carbon emissions and promote sustainable development. The observed warming trend may challenge these objectives, necessitating adaptive strategies to mitigate the impacts on local ecosystems and infrastructure. Recent weather events, such as heatwaves and altered precipitation patterns, underscore the urgency of these efforts.
Understanding the Broader Context: Climate Dynamics in Hubei
The climate dynamics in Yichang are influenced by its geographical setting in Hubei province, where the interplay of river systems and mountainous landscapes affects weather patterns. The warming trend and changes in precipitation distribution reflect broader climatic shifts that are consistent with global climate change models. These trends necessitate ongoing monitoring and adaptation to ensure resilience in the face of evolving climatic conditions.
Station Statistics
10-Year Trend
High: +1.65 °C/decade
Low: +1.77 °C/decade
Rain: -0.71 mm/decade
25-Year Trend
High: +0.04 °C/decade
Low: -0.36 °C/decade
Rain: -0.02 mm/decade
50-Year Trend
High: +0.23 °C/decade
Low: +0.02 °C/decade
Rain: +0.07 mm/decade
All-Time Trend
High: +0.08 °C/decade
Low: +0.06 °C/decade
Rain: -0.00 mm/decade
Percentage Above-Average Days
Last 12 Months: 45.2%
This Year: 33.2%
Precipitation Concentration Index (PCI) ℹ️
Last 12 Months: 14.7
Historical Average: 14.1
Percentile Rank of Last 12 Months ℹ️
High: 51st percentile
Low: 99th percentile
Rain: 89th percentile
Change in Variance ℹ️
High: -3.0%
Low: -1.9%
Intraday: -9.8%
Data Coverage
99.3%
First Year of Data
1951
Station Location
Historical Weather Records
| Max High | Avg High | Min High | Max Avg | Avg Avg | Min Avg | Max Low | Avg Low | Min Low | Max Precipitation | Avg Precipitation | Max Snow | Avg Snow | |
|---|---|---|---|---|---|---|---|---|---|---|---|---|---|
| Record | 41.4 °C | — | -3.5 °C | 34.7 °C | — | -6.7 °C | 30.4 °C | — | -9.8 °C | 166.6 mm | — | — | — |
| January | 22.5 °C | 8.9 °C | -3.5 °C | 13.6 °C | 4.9 °C | -6.7 °C | 11.9 °C | 1.8 °C | -9.8 °C | 29.6 mm | 0.8 mm | — | — |
| February | 28.2 °C | 11.1 °C | -0.8 °C | 20.1 °C | 6.9 °C | -2.4 °C | 14.7 °C | 3.5 °C | -5.9 °C | 69.6 mm | 1.2 mm | — | — |
| March | 34.1 °C | 16.2 °C | 2.4 °C | 27.5 °C | 11.5 °C | 1.0 °C | 23.2 °C | 7.7 °C | -1.3 °C | 49.0 mm | 2.0 mm | — | — |
| April | 36.7 °C | 22.4 °C | 6.7 °C | 27.6 °C | 17.3 °C | 3.1 °C | 22.2 °C | 13.2 °C | 0.4 °C | 88.0 mm | 3.4 mm | — | — |
| May | 38.7 °C | 26.6 °C | 12.0 °C | 30.8 °C | 21.7 °C | 10.4 °C | 27.0 °C | 17.7 °C | 8.8 °C | 109.0 mm | 4.3 mm | — | — |
| June | 39.9 °C | 30.2 °C | 19.4 °C | 33.4 °C | 25.4 °C | 17.4 °C | 28.3 °C | 21.6 °C | 14.0 °C | 125.3 mm | 5.2 mm | — | — |
| July | 40.7 °C | 32.7 °C | 21.2 °C | 34.7 °C | 27.9 °C | 20.1 °C | 30.4 °C | 24.3 °C | 17.4 °C | 158.0 mm | 7.0 mm | — | — |
| August | 41.4 °C | 32.4 °C | 18.3 °C | 33.8 °C | 27.5 °C | 17.4 °C | 28.8 °C | 23.9 °C | 17.2 °C | 166.6 mm | 5.7 mm | — | — |
| September | 40.2 °C | 28.1 °C | 13.2 °C | 32.9 °C | 23.4 °C | 12.7 °C | 27.4 °C | 19.9 °C | 11.4 °C | 146.7 mm | 3.7 mm | — | — |
| October | 37.7 °C | 22.7 °C | 9.4 °C | 30.6 °C | 18.0 °C | 9.2 °C | 24.1 °C | 14.5 °C | 3.7 °C | 79.5 mm | 2.6 mm | — | — |
| November | 29.8 °C | 16.9 °C | 2.4 °C | 21.8 °C | 12.5 °C | 0.3 °C | 17.8 °C | 9.1 °C | -2.2 °C | 49.4 mm | 1.5 mm | — | — |
| December | 25.5 °C | 11.1 °C | -3.4 °C | 17.5 °C | 7.0 °C | -4.8 °C | 14.0 °C | 3.8 °C | -5.4 °C | 21.8 mm | 0.6 mm | — | — |
Data Visualisations
Remove WatermarksCurrent Year Climate Trends vs Historical


Max Temperature this Year | 1 of 6
Climate 12-Month Moving Averages


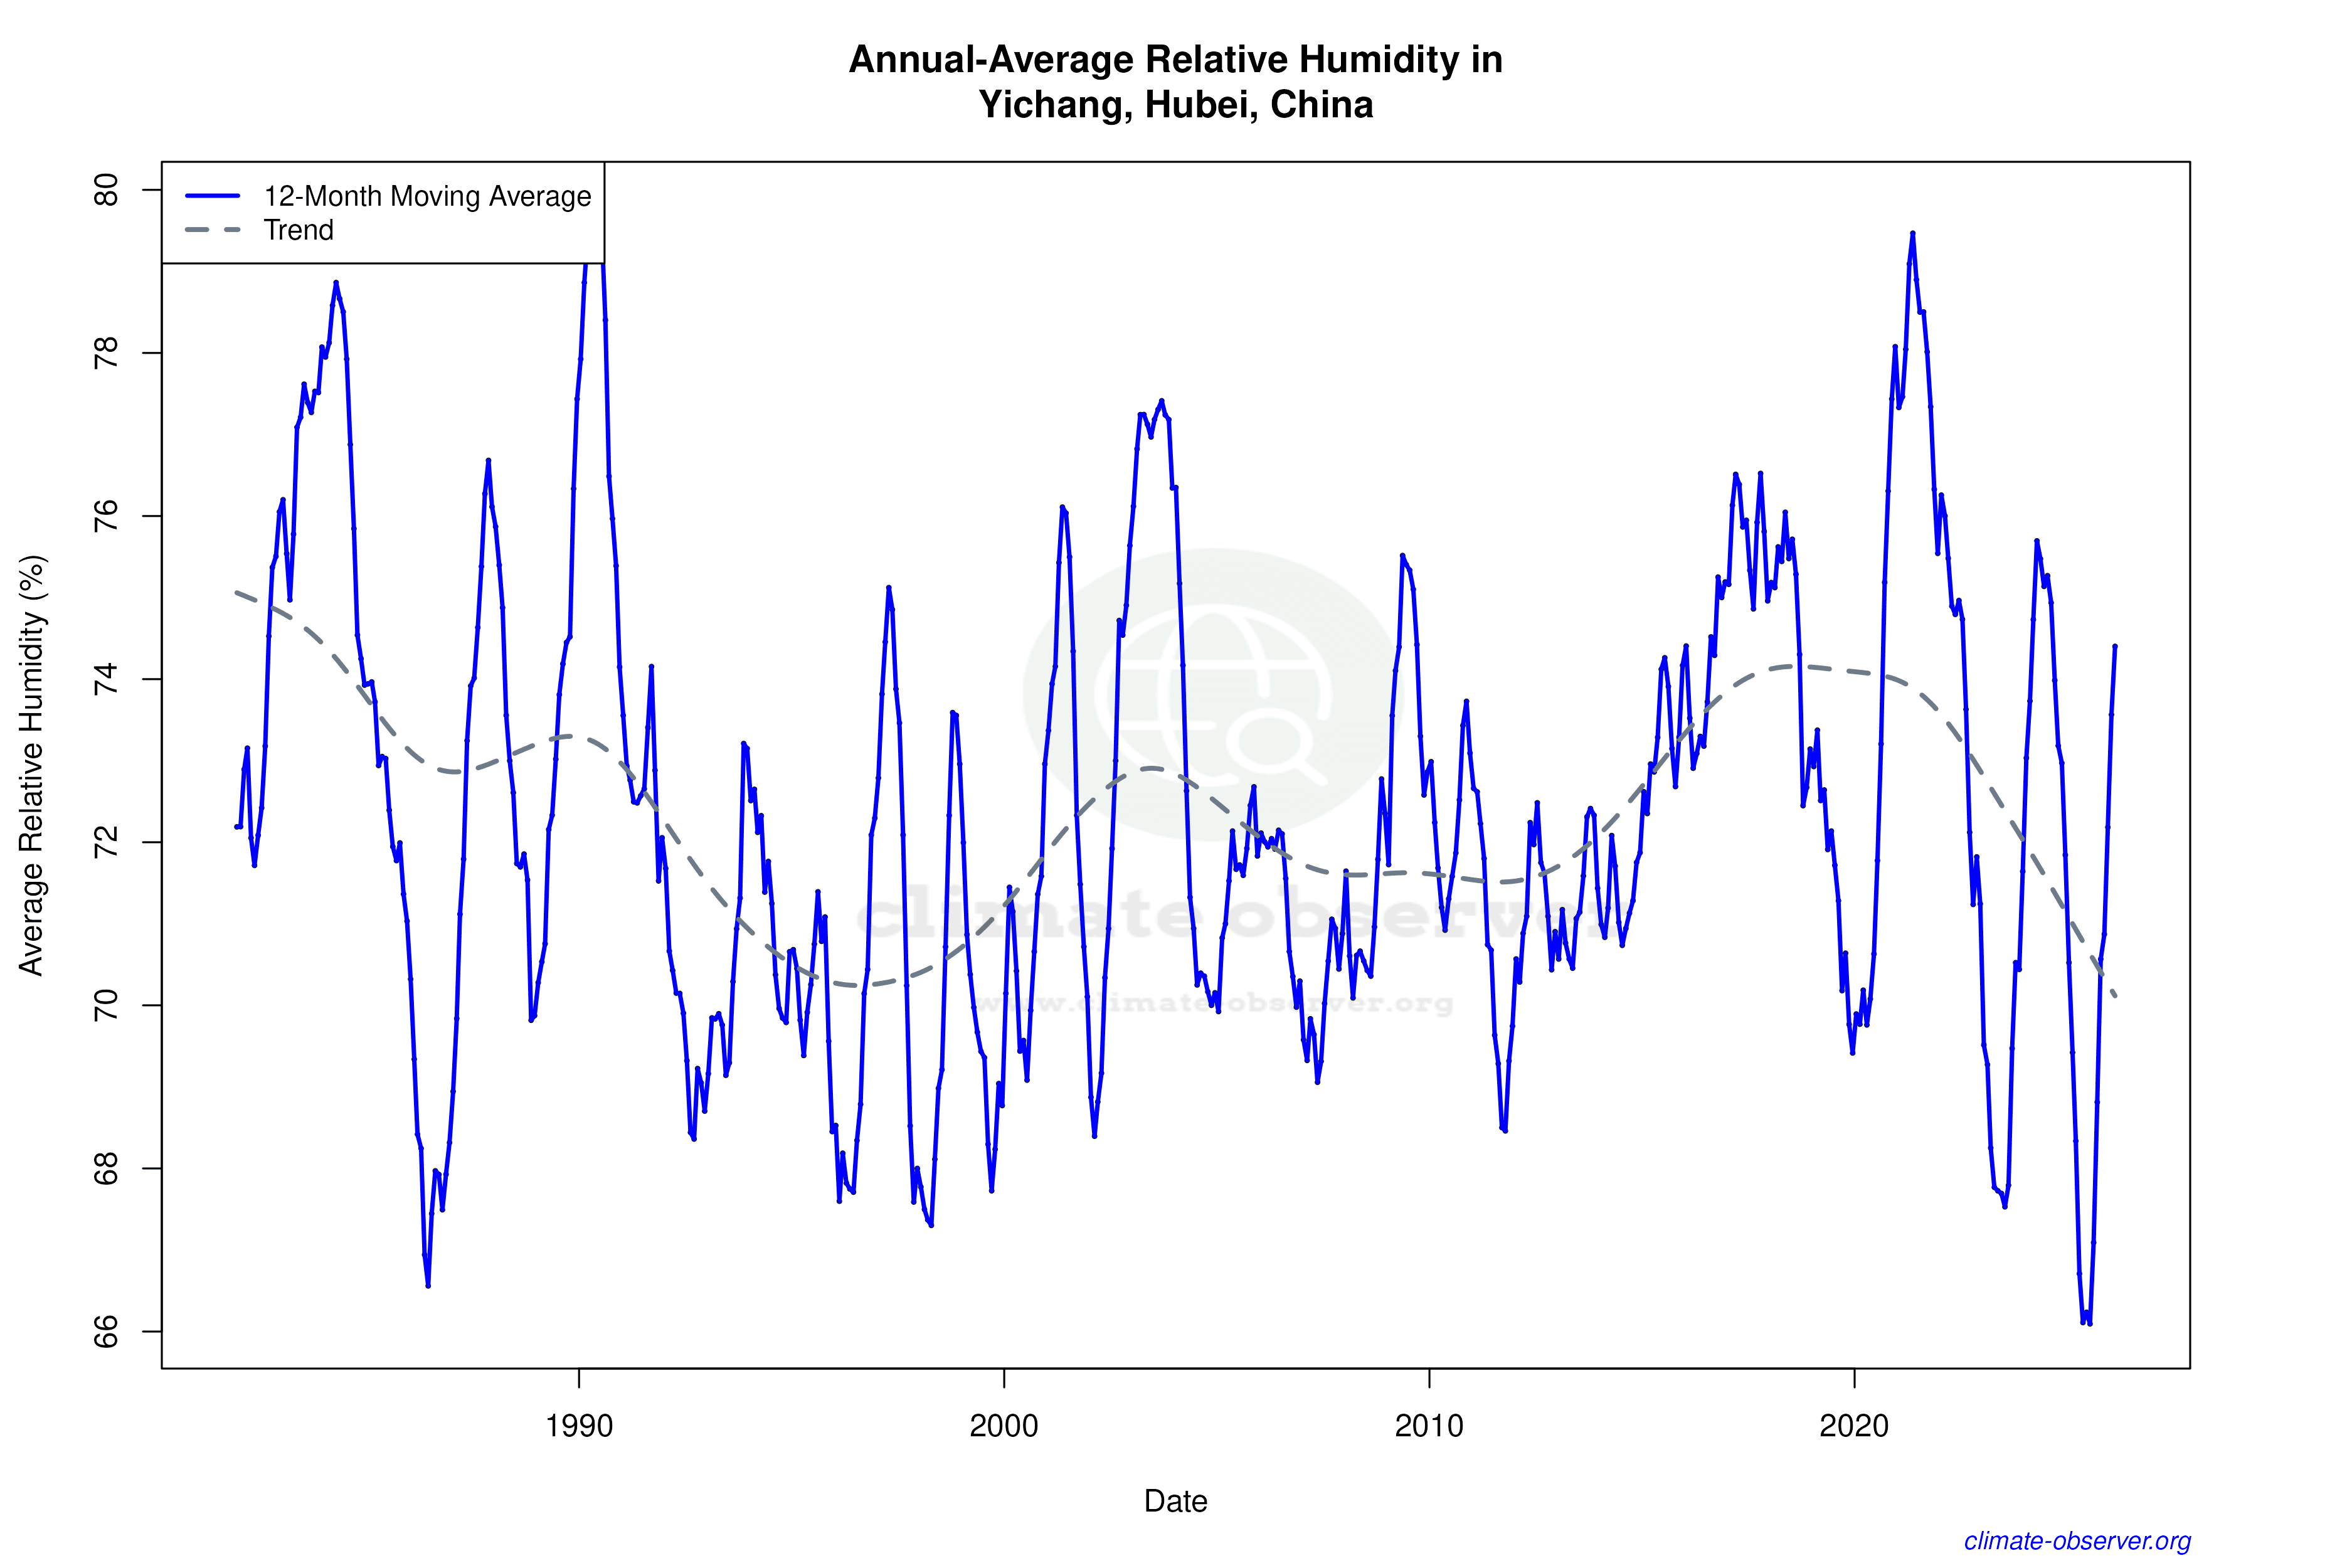

Max Temperature 12-Month MA | 1 of 6
Daily Data Points and Averages Throughout the Year


Average Max Temperature Throughout Year | 1 of 5
