Climate for Station: Ganzhou, Jiangxi, China
Loading live weather...
Climate Analysis & Overview
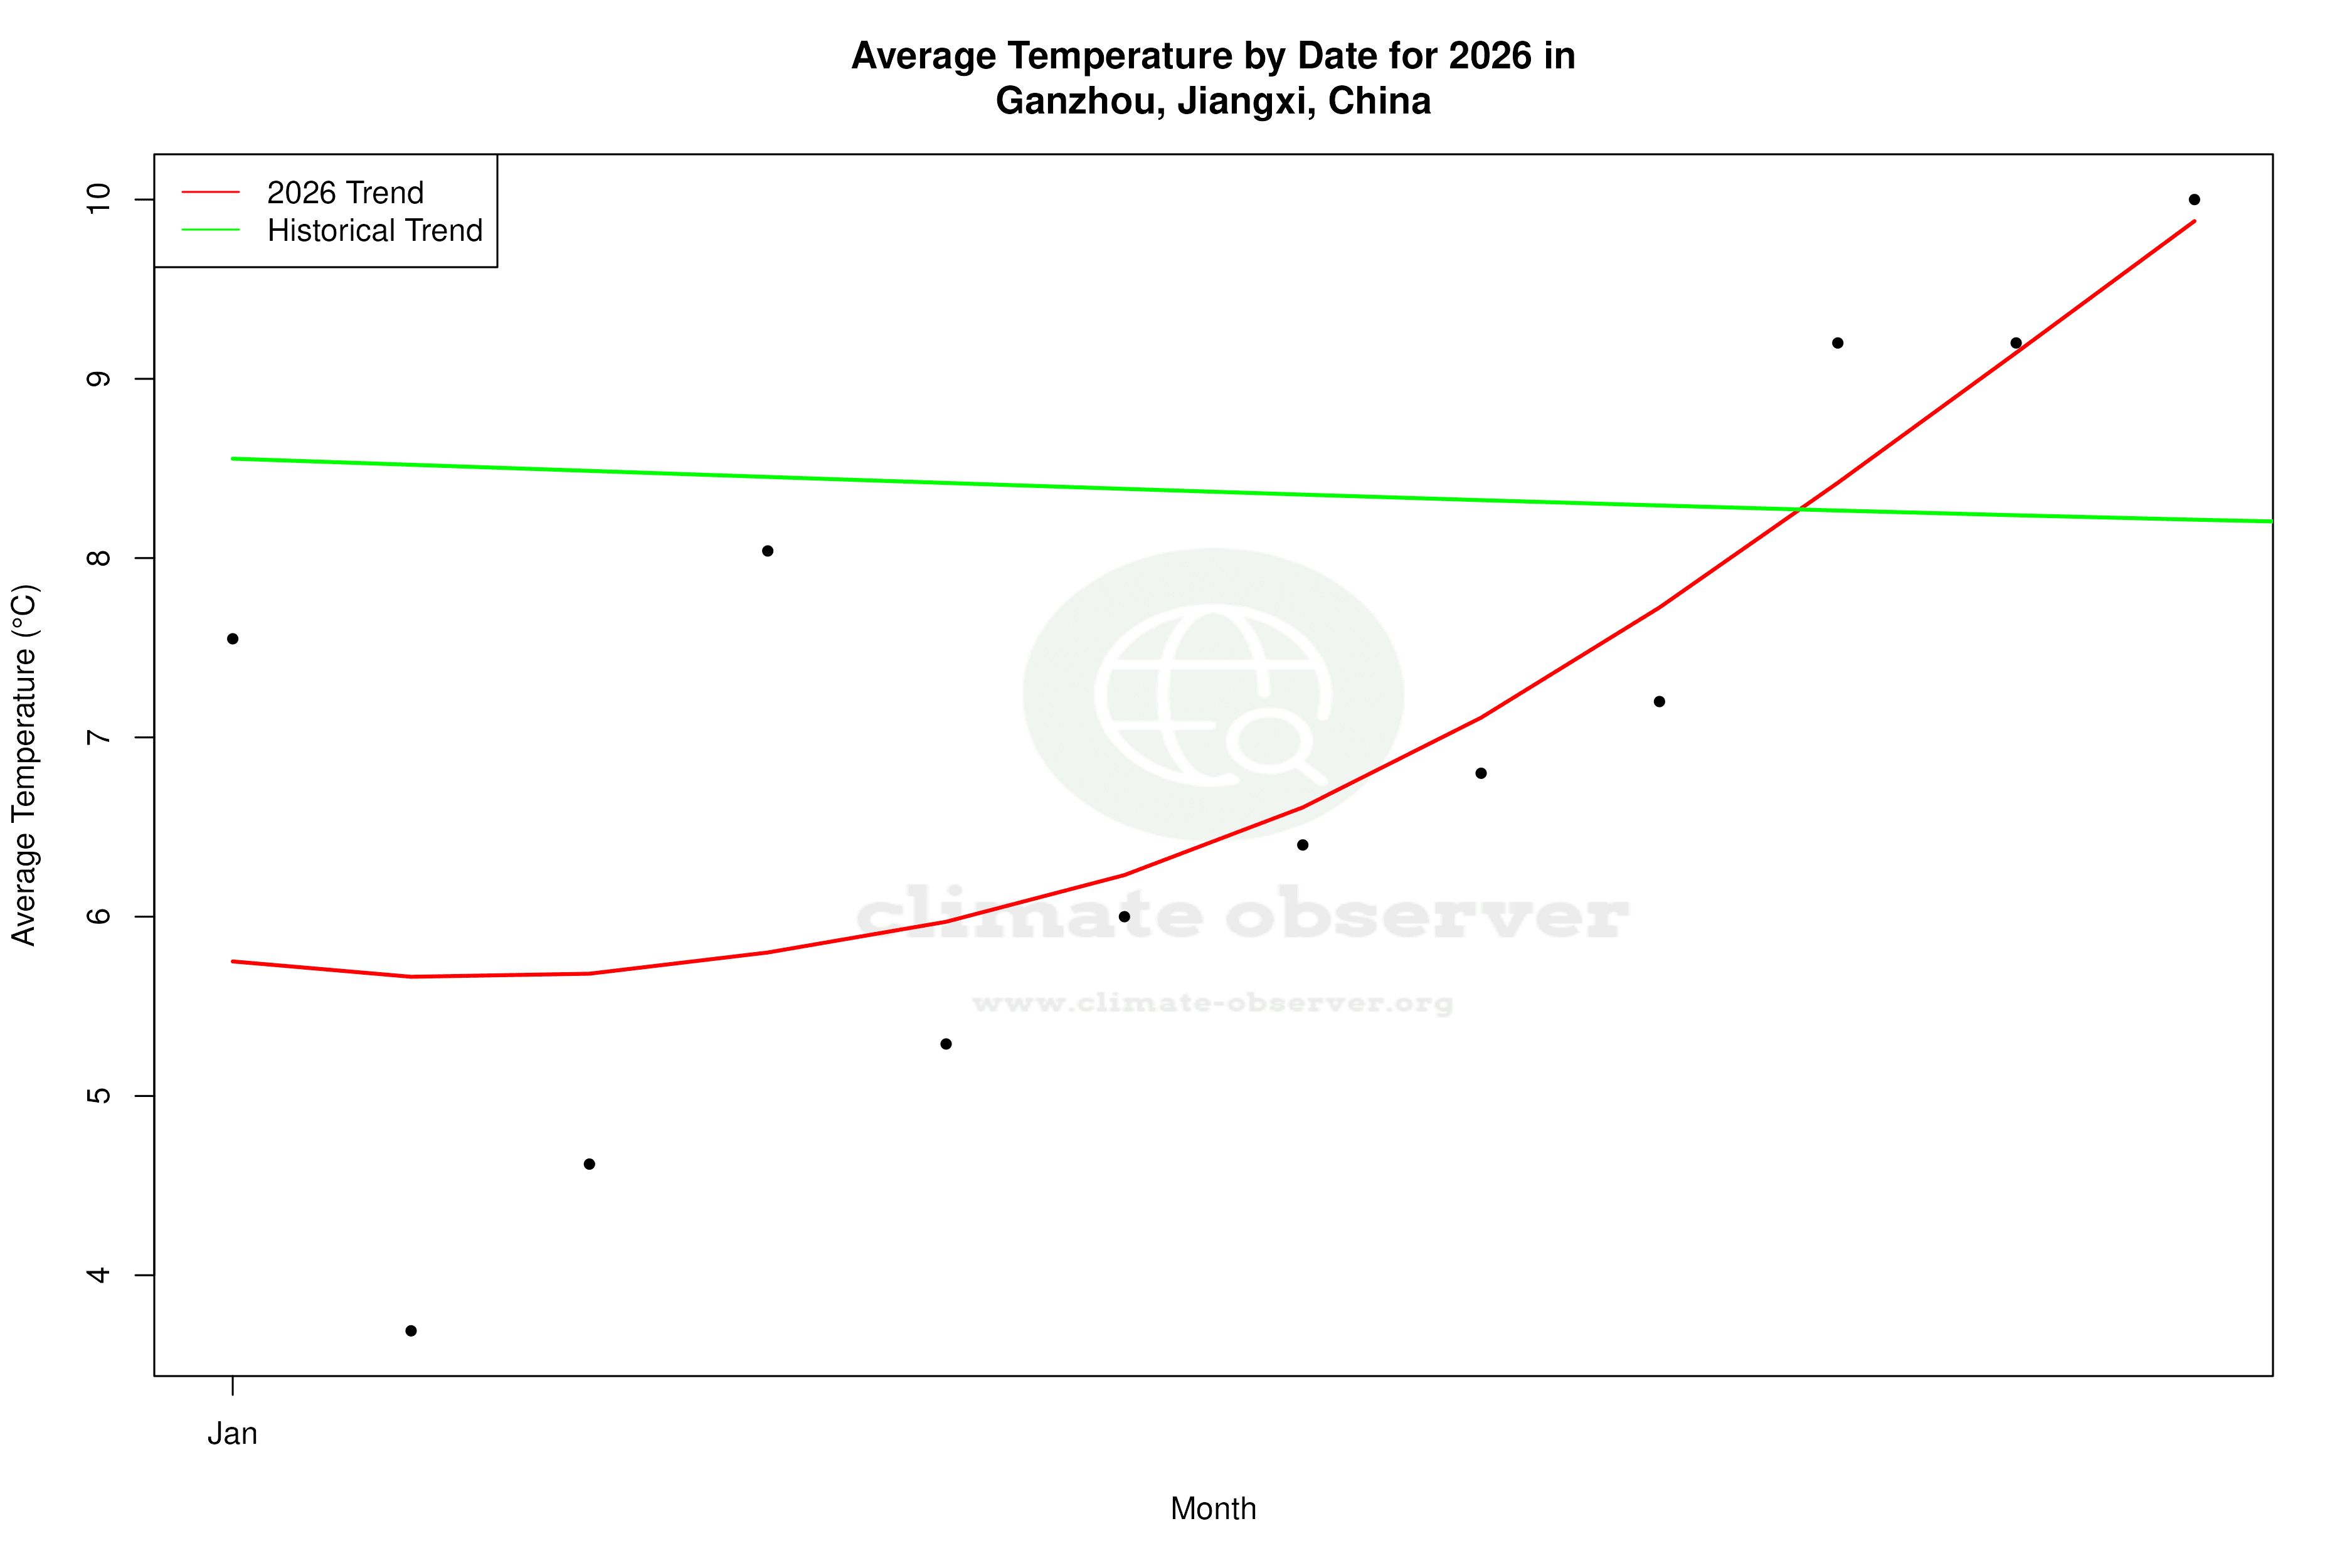
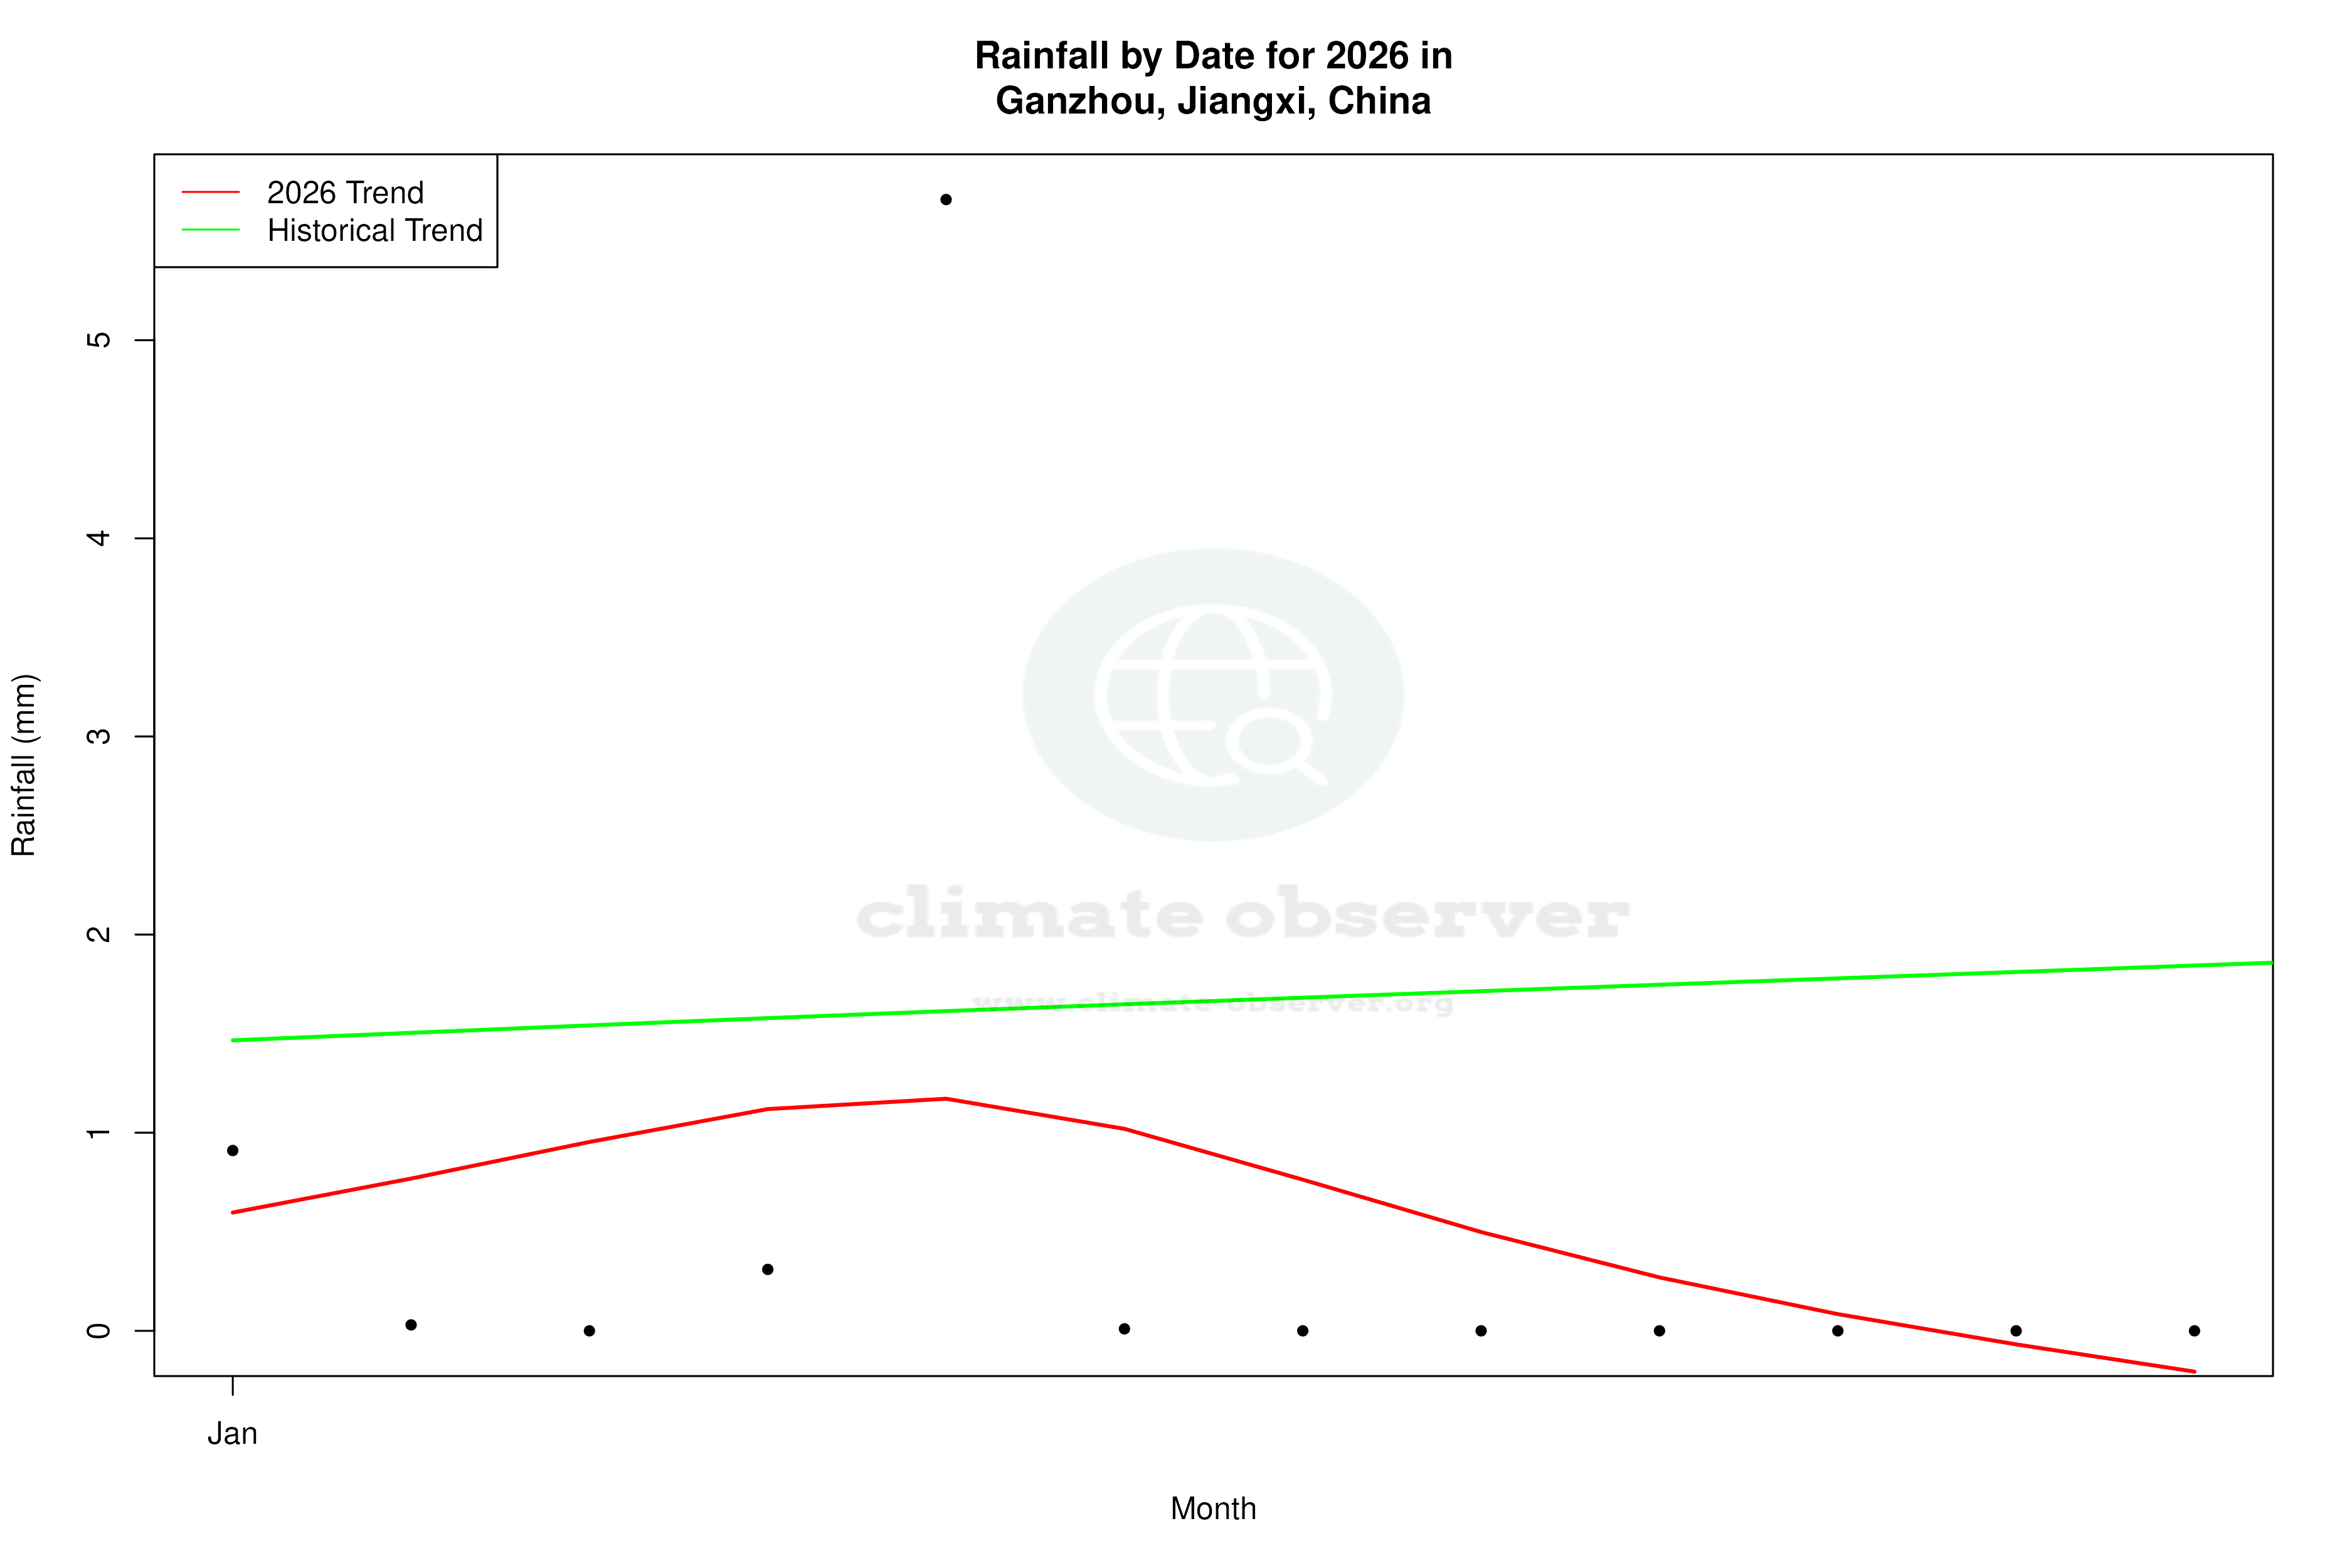
Ganzhou is experiencing a notable warming trend, particularly in its high temperatures, with a significant increase over the past decade. Meanwhile, precipitation patterns have become slightly more even, suggesting a shift towards more consistent rainfall distribution.
Warming Trends in Ganzhou
Ganzhou, situated in Jiangxi Province, China, is characterised by a humid subtropical climate (Köppen classification Cfa), which typically features hot summers and mild winters. Over the past decade, the region has experienced a pronounced warming trend in its high temperatures, with an increase of 4.23°C (7.61°F). This recent warming is more intense compared to the all-time trend, which shows a rise of 0.17°C (0.31°F). The lows have also risen, albeit more modestly, with a 1.05°C (1.89°F) increase over the past ten years and an all-time rise of 0.10°C (0.18°F). These temperature changes are likely influenced by the region's geography, including its proximity to the Gan River and surrounding low-lying hills, which can amplify heat retention.
Precipitation Patterns and Distribution
The Precipitation Concentration Index (PCI) for Ganzhou has seen a slight decrease from a baseline of 13.14 to a current value of 12.45. This indicates that rainfall is becoming more evenly distributed throughout the year, moving away from concentrated events. Such a shift can be beneficial in reducing the risk of flooding and supporting agricultural activities by providing more regular water availability. This marginal change suggests a trend towards a more stable precipitation pattern, which aligns with China's broader climate goals of improving water resource management.
Temperature Extremes and Records
Ganzhou has recorded extreme temperatures, with a maximum of 41.2°C (106.2°F) and a minimum of -6.54°C (20.2°F). These records highlight the region's capacity for both intense heat and cold, despite its generally mild winter climate. The warming trends observed in the recent decade, particularly in high temperatures, suggest that such extreme heat events may become more frequent, posing challenges for local infrastructure and public health.
Regional Climate Context and Implications
The climate data from Ganzhou must be considered within the context of China's regional climate initiatives, which aim to mitigate the impacts of climate change and enhance resilience. The observed warming trends, particularly in high temperatures, could influence local policy decisions regarding energy consumption, urban planning, and agricultural practices. The slight improvement in precipitation distribution may assist in achieving these goals by reducing the variability and unpredictability of water resources.
Future Considerations for Ganzhou
As Ganzhou continues to warm, understanding the interplay between temperature trends and precipitation patterns will be crucial for adapting to climate change. The region's ability to manage these changes will depend on effective policy implementation and community engagement, ensuring that the benefits of more evenly distributed rainfall are maximised while mitigating the risks associated with rising temperatures.
Station Statistics
10-Year Trend
High: +3.88 °C/decade
Low: +0.99 °C/decade
Rain: -2.79 mm/decade
25-Year Trend
High: +0.61 °C/decade
Low: +0.04 °C/decade
Rain: +0.05 mm/decade
50-Year Trend
High: +0.40 °C/decade
Low: +0.06 °C/decade
Rain: -0.00 mm/decade
All-Time Trend
High: +0.18 °C/decade
Low: +0.10 °C/decade
Rain: -0.00 mm/decade
Percentage Above-Average Days
Last 12 Months: 55.9%
This Year: 56.7%
Precipitation Concentration Index (PCI) ℹ️
Last 12 Months: 15.5
Historical Average: 12.9
Percentile Rank of Last 12 Months ℹ️
High: 97th percentile
Low: 77th percentile
Rain: 14th percentile
Change in Variance ℹ️
High: -17.2%
Low: +2.4%
Intraday: +3.0%
Data Coverage
92.6%
First Year of Data
1944
Station Location
Historical Weather Records
| Max High | Avg High | Min High | Max Avg | Avg Avg | Min Avg | Max Low | Avg Low | Min Low | Max Precipitation | Avg Precipitation | Max Snow | Avg Snow | |
|---|---|---|---|---|---|---|---|---|---|---|---|---|---|
| Record | 41.2 °C | — | -1.6 °C | 34.4 °C | — | -2.7 °C | 30.4 °C | — | -6.5 °C | 200.8 mm | — | — | — |
| January | 27.7 °C | 12.8 °C | -1.6 °C | 22.5 °C | 8.3 °C | -2.7 °C | 19.9 °C | 5.0 °C | -6.5 °C | 62.1 mm | 2.0 mm | — | — |
| February | 31.4 °C | 14.4 °C | -1.5 °C | 25.2 °C | 10.2 °C | -2.2 °C | 22.5 °C | 7.0 °C | -4.6 °C | 89.3 mm | 3.5 mm | — | — |
| March | 33.2 °C | 18.6 °C | 2.7 °C | 28.0 °C | 14.2 °C | 1.6 °C | 24.8 °C | 11.0 °C | -0.3 °C | 120.4 mm | 5.4 mm | — | — |
| April | 35.1 °C | 24.3 °C | 7.9 °C | 30.2 °C | 19.8 °C | 6.6 °C | 26.7 °C | 16.3 °C | 4.2 °C | 103.0 mm | 6.2 mm | — | — |
| May | 37.9 °C | 28.6 °C | 15.4 °C | 32.3 °C | 24.1 °C | 12.8 °C | 28.1 °C | 20.7 °C | 11.1 °C | 200.8 mm | 7.4 mm | — | — |
| June | 38.4 °C | 31.3 °C | 20.2 °C | 32.9 °C | 27.1 °C | 18.1 °C | 29.8 °C | 23.8 °C | 15.6 °C | 143.0 mm | 6.9 mm | — | — |
| July | 40.0 °C | 34.5 °C | 23.8 °C | 34.4 °C | 29.7 °C | 20.7 °C | 30.4 °C | 25.8 °C | 18.6 °C | 98.8 mm | 3.7 mm | — | — |
| August | 41.2 °C | 34.1 °C | 23.5 °C | 34.2 °C | 29.0 °C | 22.3 °C | 29.6 °C | 25.3 °C | 17.9 °C | 114.1 mm | 4.4 mm | — | — |
| September | 38.8 °C | 31.0 °C | 18.1 °C | 32.7 °C | 26.3 °C | 16.2 °C | 27.9 °C | 22.6 °C | 13.1 °C | 82.4 mm | 2.8 mm | — | — |
| October | 39.6 °C | 26.3 °C | 13.4 °C | 32.2 °C | 21.3 °C | 11.3 °C | 27.0 °C | 17.5 °C | 5.2 °C | 89.3 mm | 1.8 mm | — | — |
| November | 32.8 °C | 20.6 °C | 2.7 °C | 26.4 °C | 15.7 °C | 1.6 °C | 22.6 °C | 11.9 °C | -1.3 °C | 88.2 mm | 2.1 mm | — | — |
| December | 29.5 °C | 15.1 °C | 0.1 °C | 23.6 °C | 10.1 °C | -1.7 °C | 19.4 °C | 6.4 °C | -4.1 °C | 77.2 mm | 1.5 mm | — | — |
Data Visualisations
Remove WatermarksCurrent Year Climate Trends vs Historical


Max Temperature this Year | 1 of 6
Climate 12-Month Moving Averages


Max Temperature 12-Month MA | 1 of 6
Daily Data Points and Averages Throughout the Year


Average Max Temperature Throughout Year | 1 of 5
