Climate for Station: Bogota/Eldorado, Bogotá, Capital District, Colombia
Loading live weather...
Climate Analysis & Overview
Bogotá's climate is experiencing nuanced changes, with a slight warming trend in lows and a cooling trend in highs over the past decade. Precipitation is becoming marginally more evenly distributed, aligning with Colombia's regional climate goals for balanced water resources.
Andean Climate Dynamics
Bogotá, situated at an altitude of approximately 2,640 metres (8,660 feet) in the Andes, is classified under the Köppen climate system as Cfb, indicating a temperate oceanic climate with significant precipitation throughout the year. The mountainous geography plays a crucial role in shaping its climate, with temperature variations and precipitation patterns heavily influenced by elevation and orographic effects.
Temperature Trends: A Dual Narrative
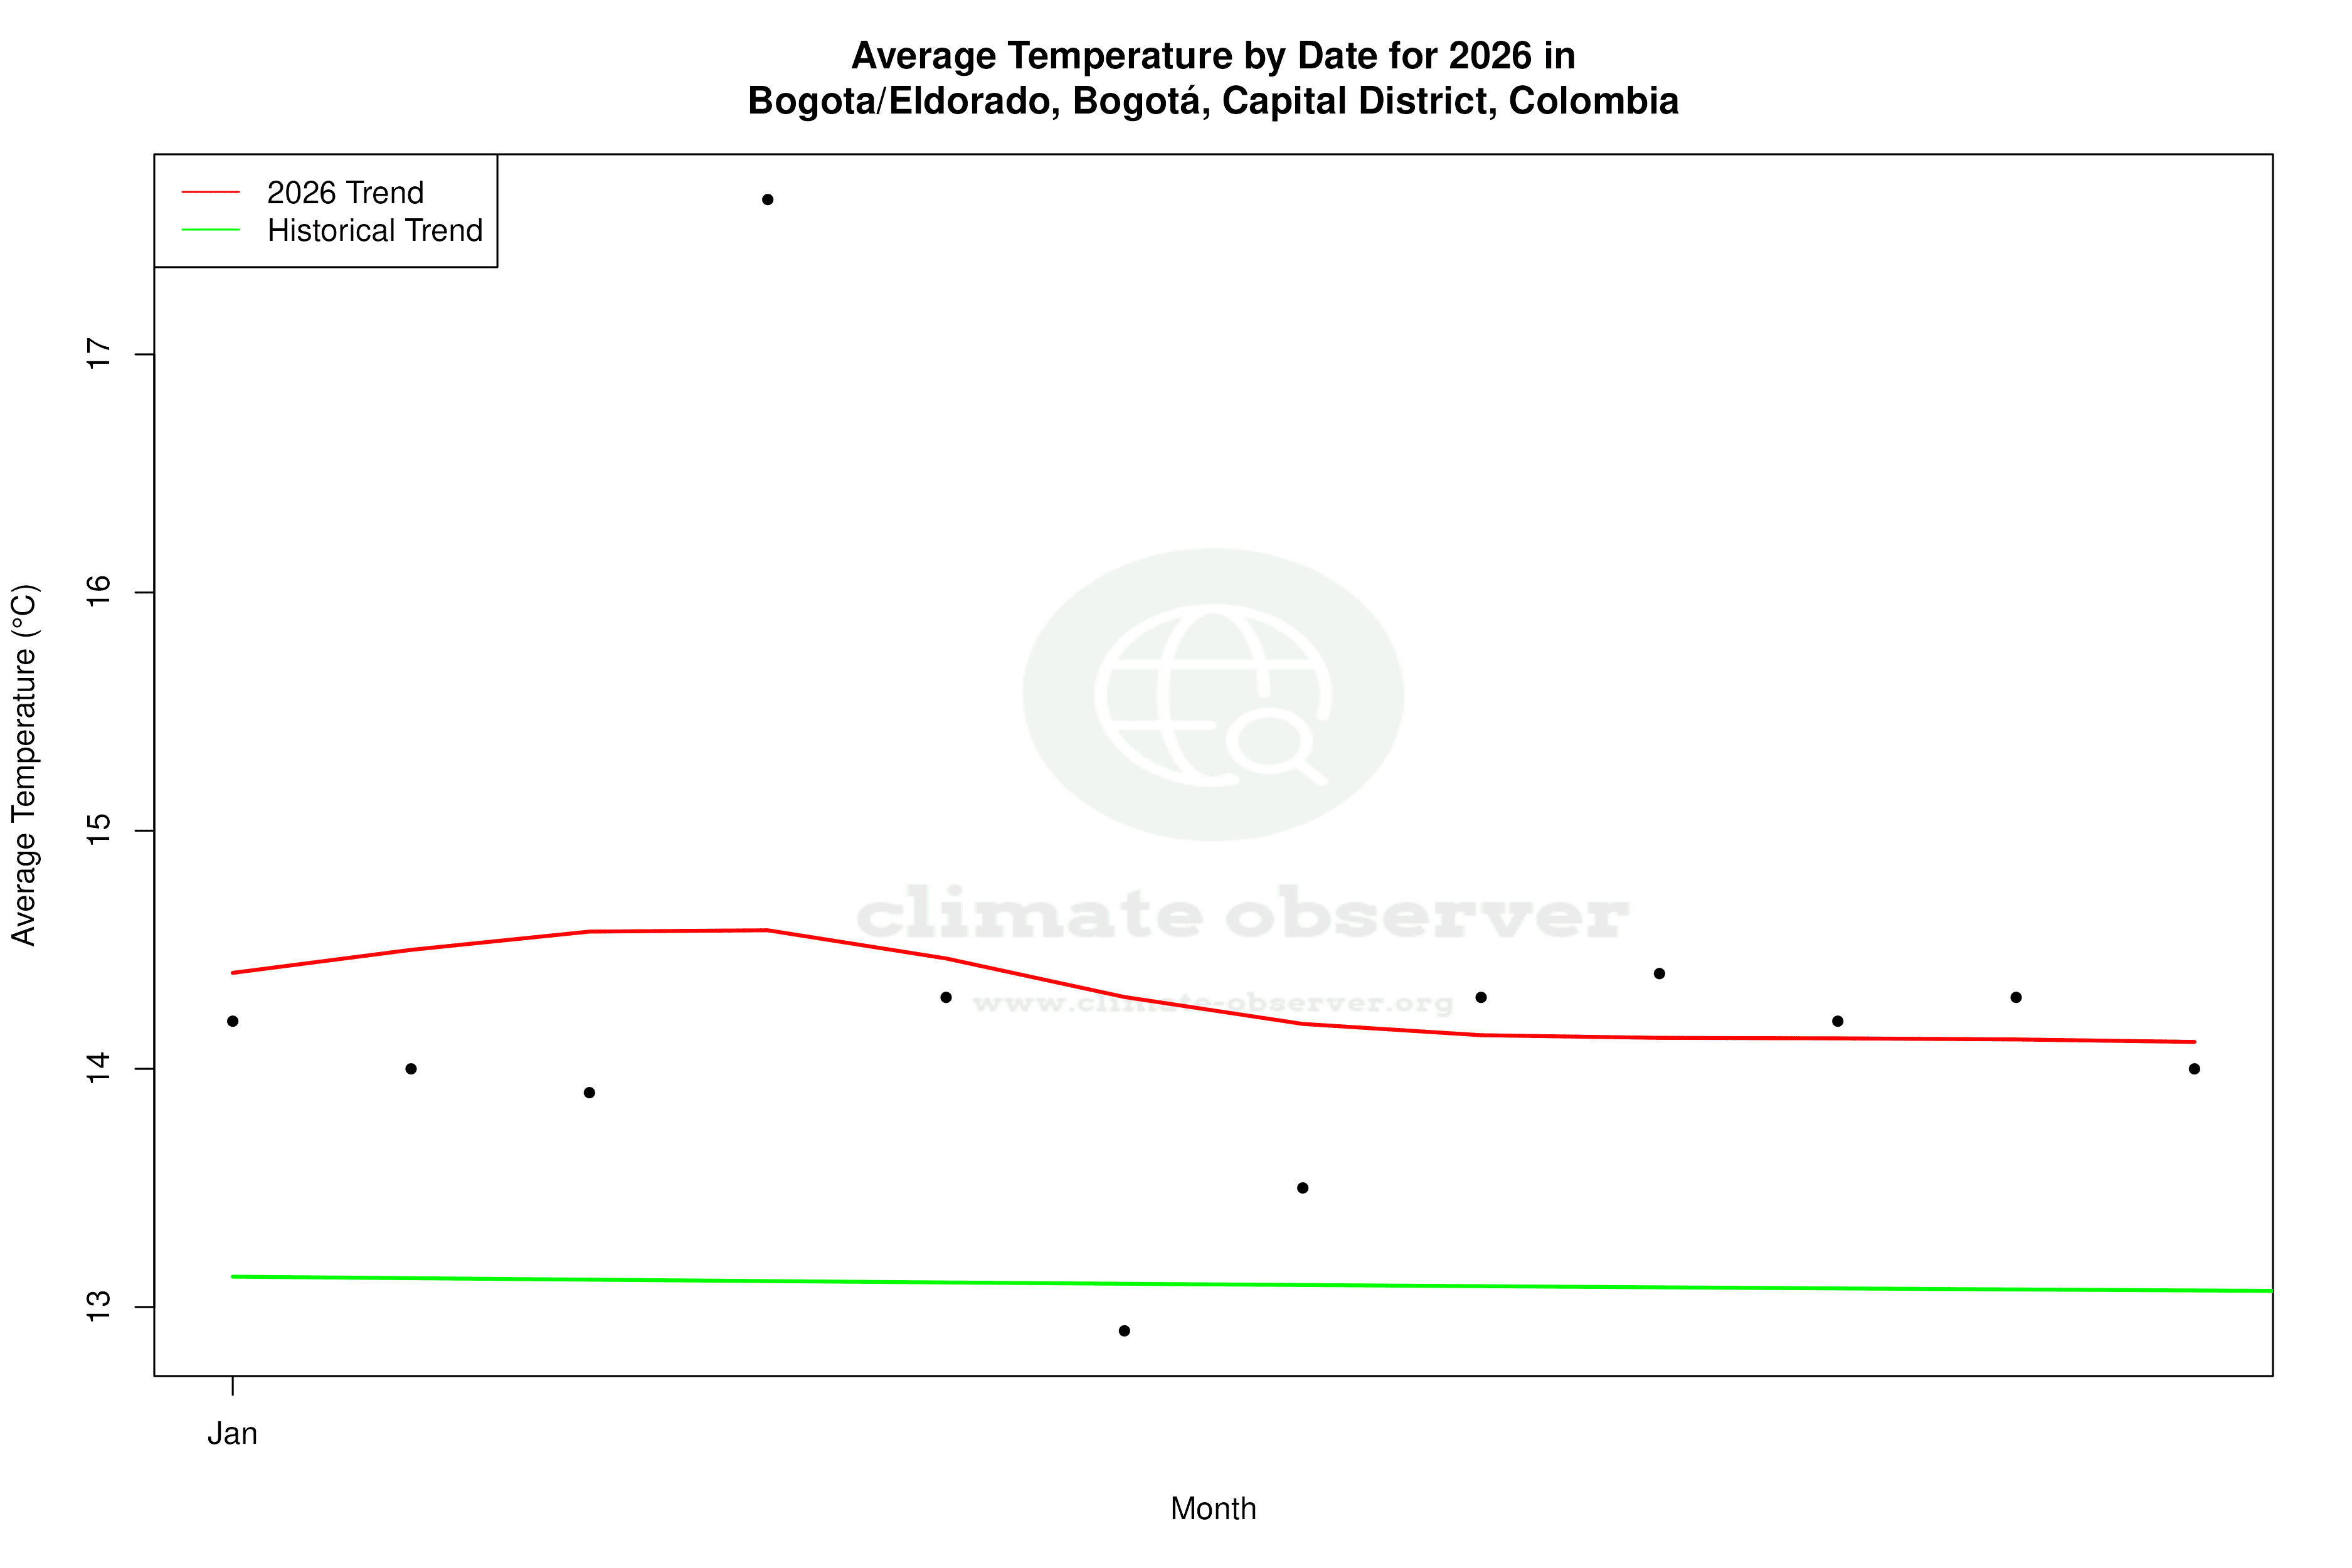
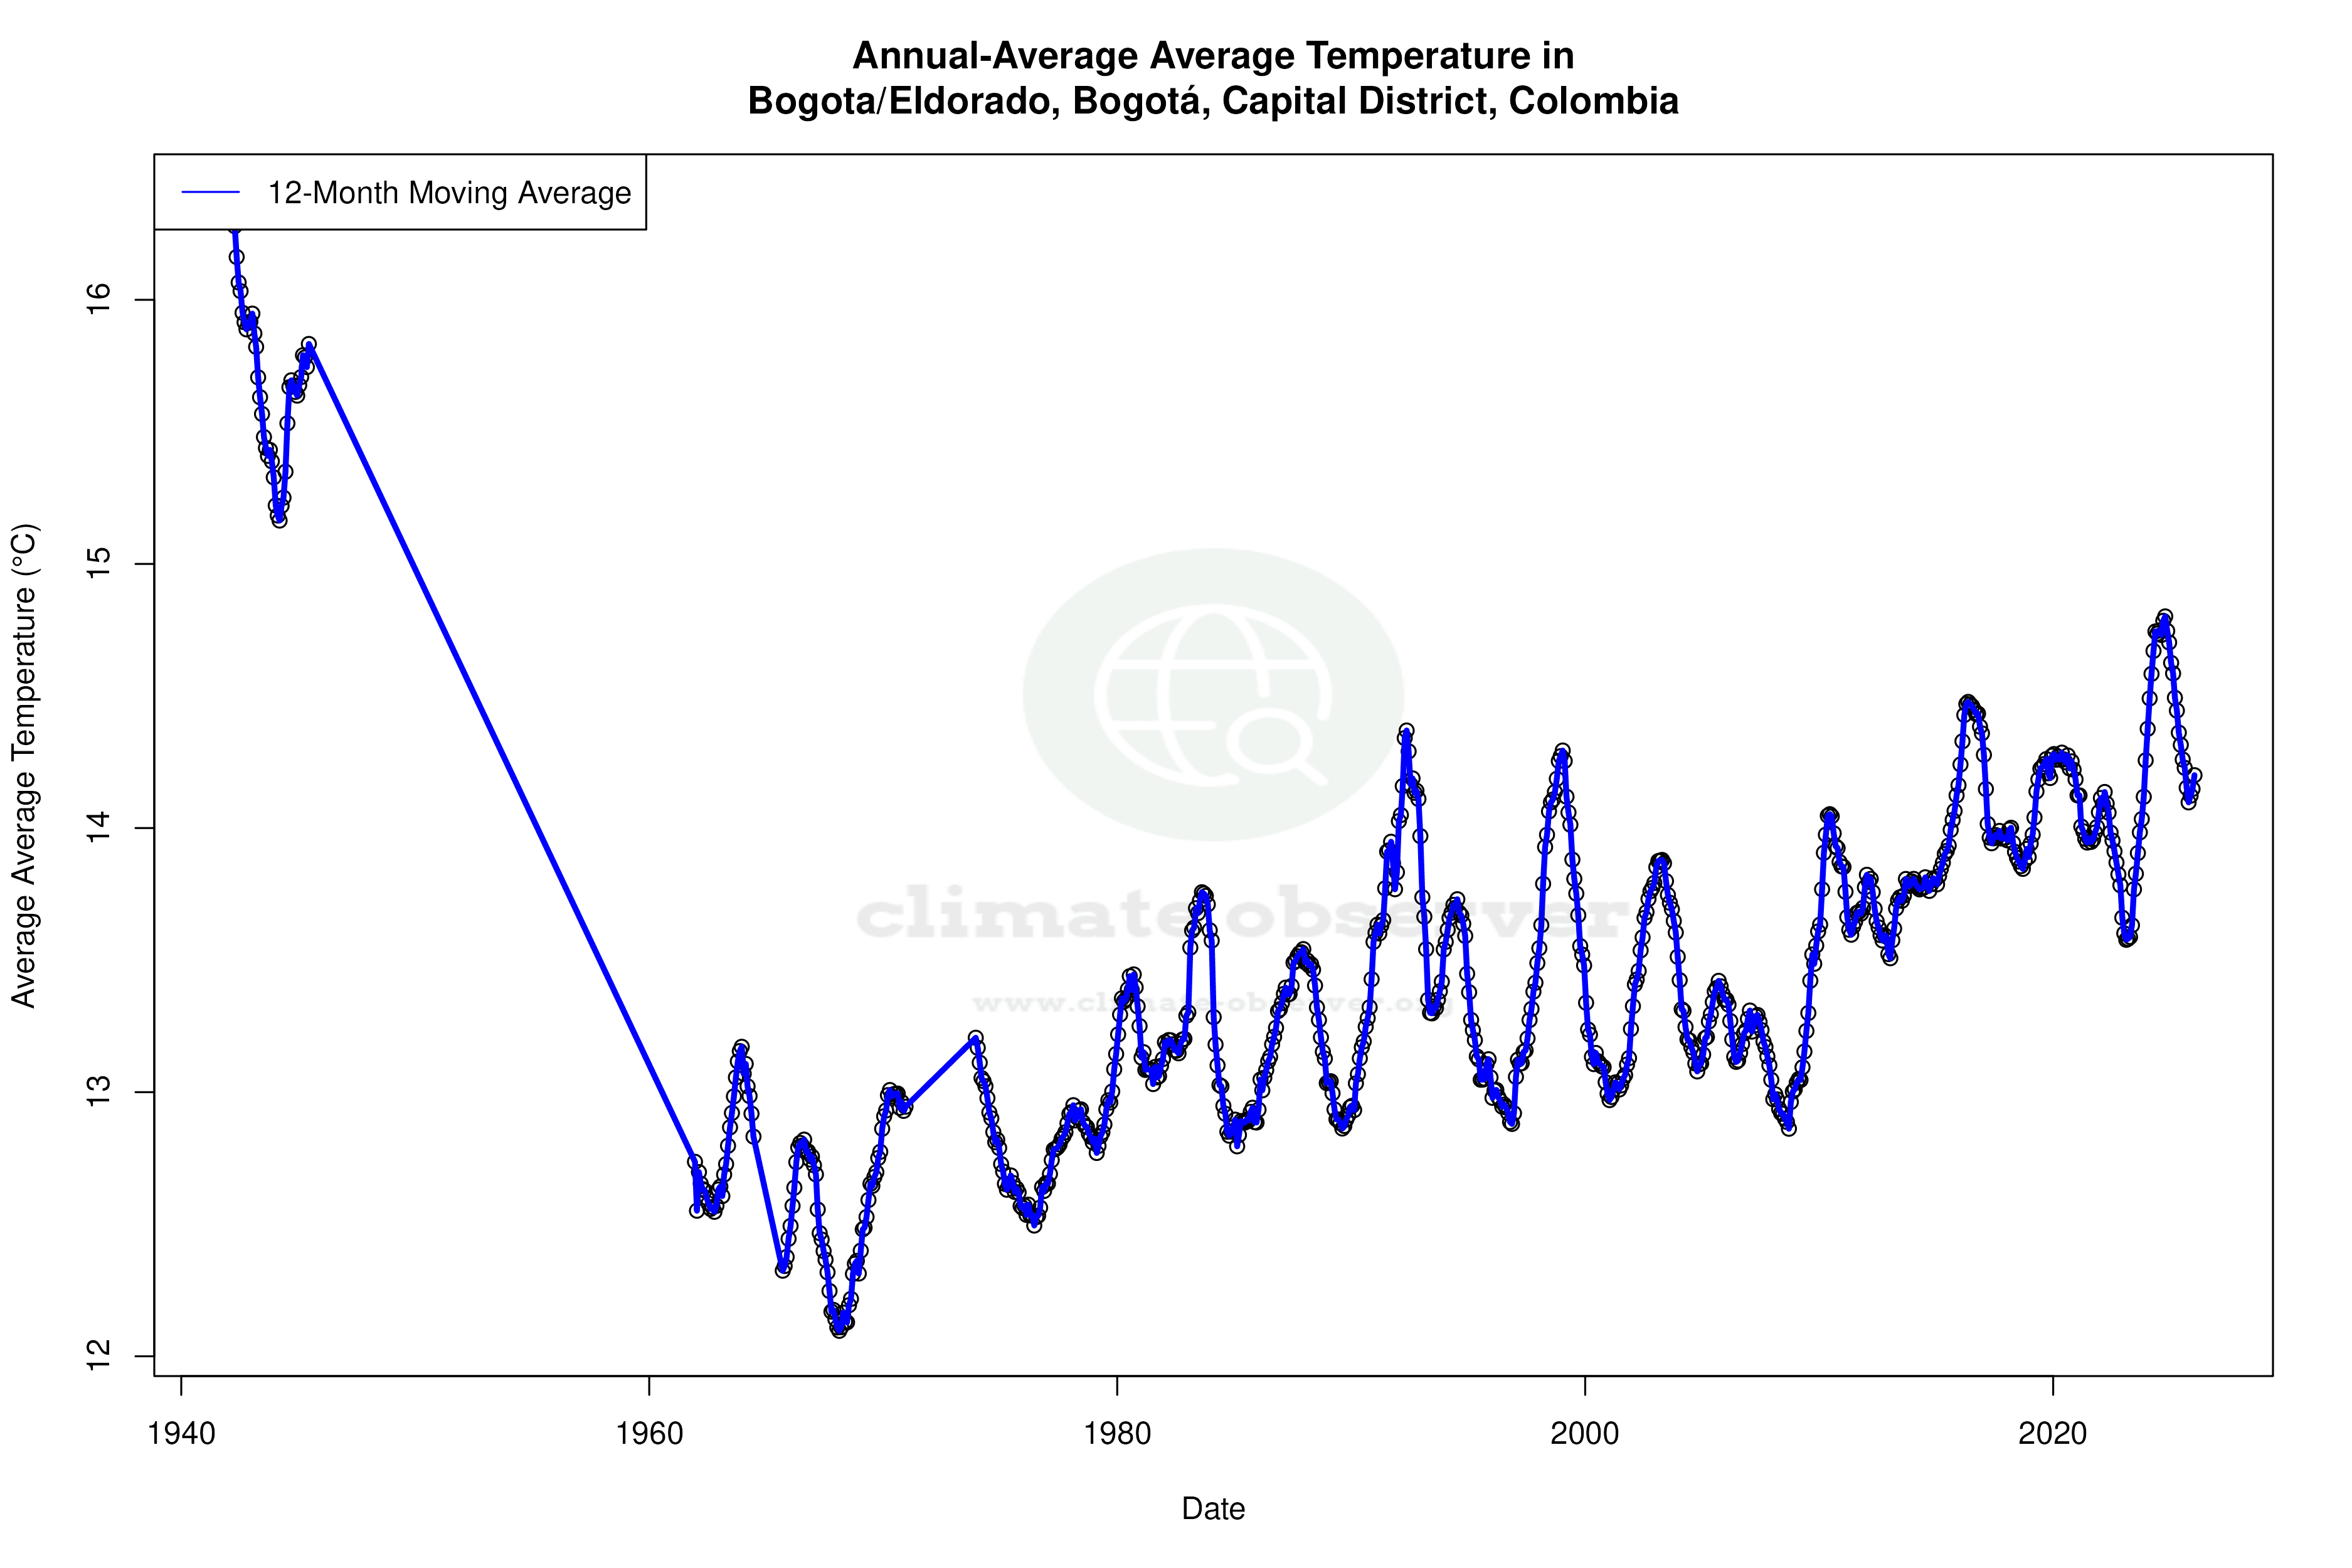
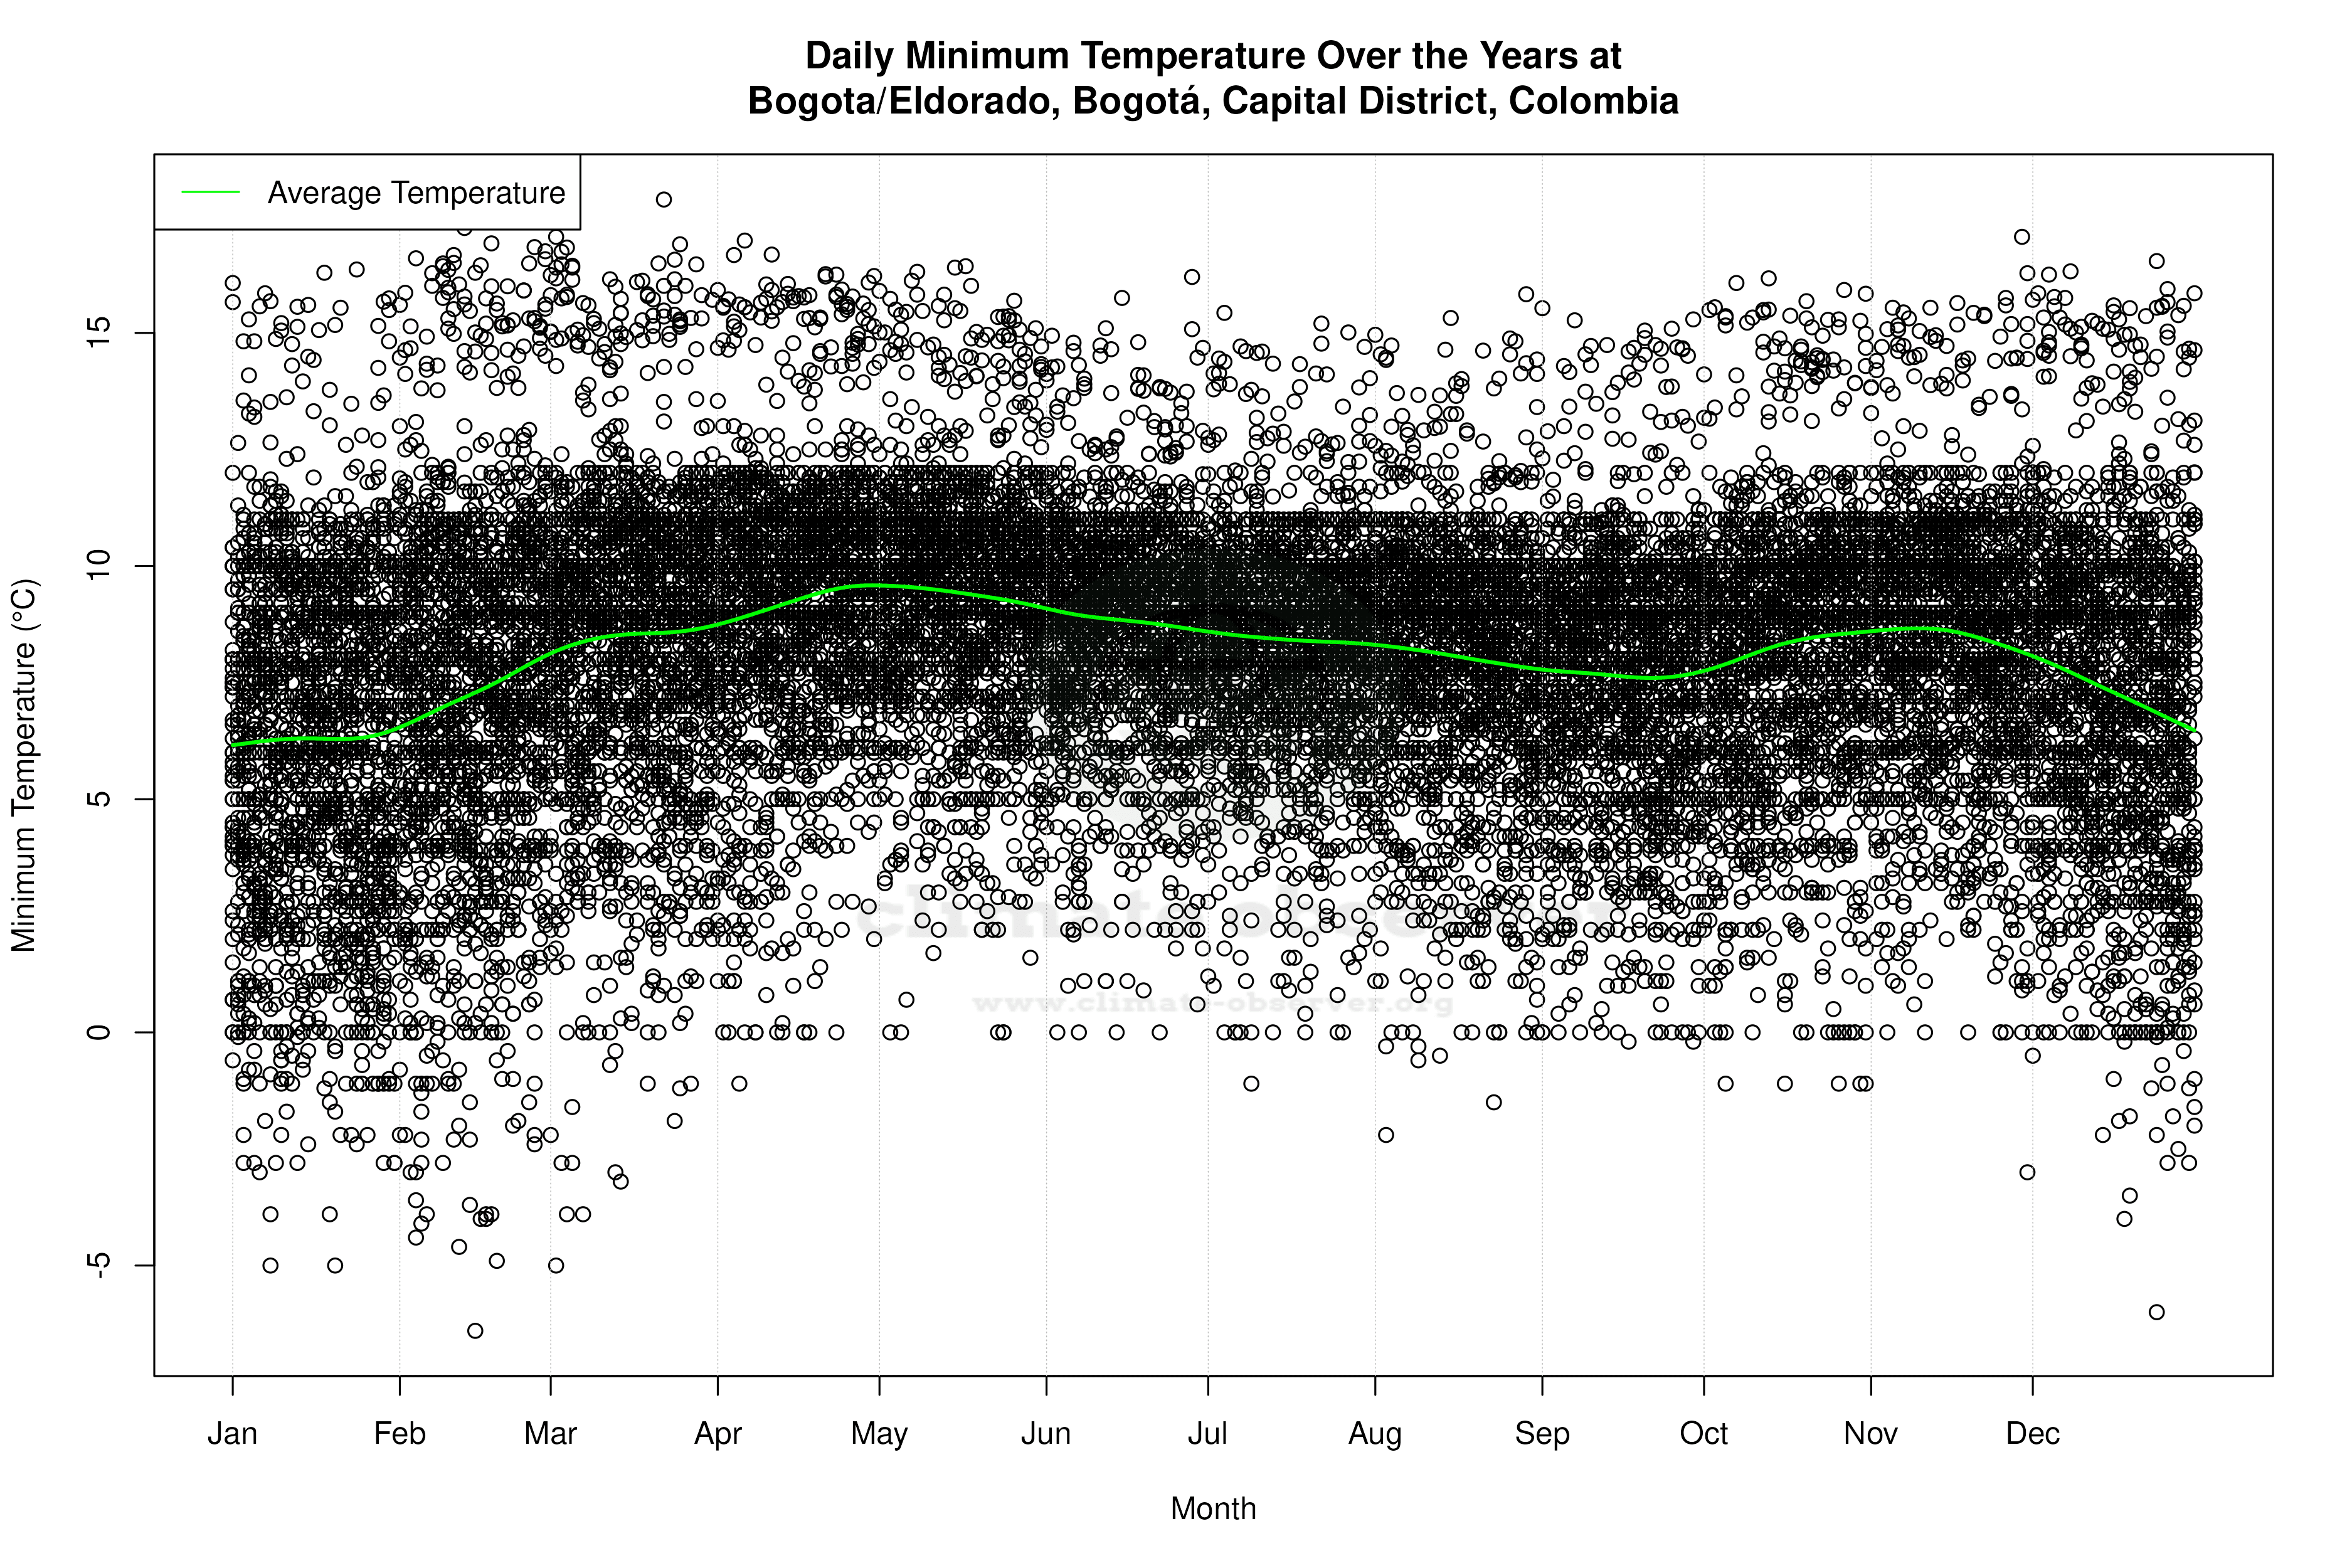
The temperature trends in Bogotá reveal an intriguing duality. Over the past decade, the city has experienced a cooling trend in high temperatures, with a decrease of 0.46°C (0.83°F). This contrasts with the all-time trend, which shows a warming of 0.19°C (0.34°F) in highs. Meanwhile, the low temperatures have increased by 0.21°C (0.38°F) over the past decade, aligning with the all-time warming trend of 0.52°C (0.94°F). These shifts suggest a complex interplay between short-term climatic fluctuations and long-term warming tendencies.
Precipitation Patterns: A Slight Redistribution
The Precipitation Concentration Index (PCI) for Bogotá has seen a marginal decrease from a baseline of 11.1 to a current value of 10.9. This indicates that precipitation is becoming slightly more evenly distributed throughout the year. Such a shift can be beneficial for water resource management, supporting Colombia's climate goals of reducing the risk of extreme weather events and ensuring a more reliable water supply.
Record Extremes: A Reminder of Variability
Bogotá's record temperatures underscore the city's climatic variability. The highest recorded temperature is 30.18°C (86.32°F), while the lowest is -6.4°C (20.48°F). These extremes highlight the potential for significant temperature swings, a characteristic feature of high-altitude climates. Such variability is essential to consider in urban planning and infrastructure development, particularly in a city as densely populated as Bogotá.
Regional Climate Goals and Recent Events
Colombia has been proactive in addressing climate change, with national policies aimed at reducing greenhouse gas emissions and enhancing resilience to climate impacts. Recent weather events, such as intense rainfall leading to flooding, have underscored the importance of these efforts. Bogotá's evolving climate patterns, including the slight redistribution of precipitation and temperature trends, reflect broader regional shifts and the need for adaptive strategies to mitigate potential adverse effects.
Station Statistics
10-Year Trend
High: -0.46 °C/decade
Low: +0.23 °C/decade
Rain: -0.08 mm/decade
25-Year Trend
High: -0.47 °C/decade
Low: -0.31 °C/decade
Rain: +0.25 mm/decade
50-Year Trend
High: +0.20 °C/decade
Low: +0.57 °C/decade
Rain: +0.28 mm/decade
All-Time Trend
High: +0.19 °C/decade
Low: +0.52 °C/decade
Rain: +0.26 mm/decade
Percentage Above-Average Days
Last 12 Months: 38.9%
This Year: 10.0%
Precipitation Concentration Index (PCI) ℹ️
Last 12 Months: 12.7
Historical Average: 12.6
Percentile Rank of Last 12 Months ℹ️
High: 35th percentile
Low: 81st percentile
Rain: 96th percentile
Change in Variance ℹ️
High: -43.4%
Low: -51.7%
Intraday: -35.8%
Data Coverage
69.8%
First Year of Data
1941
Station Location
Historical Weather Records
| Max High | Avg High | Min High | Max Avg | Avg Avg | Min Avg | Max Low | Avg Low | Min Low | Max Precipitation | Avg Precipitation | Max Snow | Avg Snow | |
|---|---|---|---|---|---|---|---|---|---|---|---|---|---|
| Record | 30.2 °C | — | 13.3 °C | 21.0 °C | — | 6.3 °C | 17.9 °C | — | -6.4 °C | 148.6 mm | — | — | — |
| January | 29.3 °C | 20.4 °C | 16.0 °C | 20.5 °C | 13.1 °C | 7.6 °C | 16.4 °C | 6.3 °C | -5.0 °C | 26.0 mm | 1.3 mm | — | — |
| February | 30.2 °C | 20.7 °C | 14.8 °C | 21.0 °C | 13.5 °C | 8.2 °C | 17.3 °C | 7.3 °C | -6.4 °C | 43.9 mm | 1.9 mm | — | — |
| March | 29.4 °C | 20.4 °C | 14.0 °C | 20.8 °C | 13.8 °C | 9.1 °C | 17.9 °C | 8.5 °C | -5.0 °C | 52.3 mm | 3.1 mm | — | — |
| April | 28.4 °C | 20.0 °C | 14.6 °C | 19.8 °C | 14.1 °C | 9.7 °C | 17.0 °C | 9.3 °C | -1.1 °C | 148.6 mm | 4.2 mm | — | — |
| May | 28.1 °C | 19.7 °C | 14.0 °C | 19.4 °C | 14.0 °C | 10.2 °C | 16.4 °C | 9.4 °C | 0.0 °C | 54.0 mm | 3.7 mm | — | — |
| June | 27.4 °C | 19.2 °C | 13.3 °C | 19.4 °C | 13.7 °C | 8.5 °C | 16.2 °C | 8.8 °C | 0.0 °C | 48.0 mm | 2.4 mm | — | — |
| July | 25.9 °C | 18.8 °C | 14.0 °C | 19.1 °C | 13.3 °C | 8.4 °C | 15.4 °C | 8.4 °C | -1.1 °C | 39.0 mm | 1.8 mm | — | — |
| August | 26.9 °C | 19.1 °C | 14.0 °C | 19.3 °C | 13.3 °C | 8.8 °C | 15.8 °C | 8.1 °C | -2.2 °C | 37.1 mm | 1.9 mm | — | — |
| September | 29.4 °C | 19.6 °C | 14.4 °C | 19.3 °C | 13.3 °C | 7.8 °C | 15.5 °C | 7.7 °C | -0.2 °C | 38.1 mm | 2.3 mm | — | — |
| October | 27.6 °C | 19.7 °C | 15.0 °C | 20.6 °C | 13.5 °C | 8.9 °C | 16.2 °C | 8.2 °C | -1.1 °C | 73.9 mm | 3.7 mm | — | — |
| November | 26.9 °C | 19.7 °C | 15.0 °C | 19.0 °C | 13.5 °C | 8.3 °C | 17.1 °C | 8.5 °C | -3.0 °C | 52.3 mm | 3.5 mm | — | — |
| December | 27.3 °C | 20.1 °C | 15.8 °C | 19.8 °C | 13.2 °C | 6.3 °C | 16.5 °C | 7.3 °C | -6.0 °C | 55.1 mm | 2.1 mm | — | — |
Data Visualisations
Remove WatermarksCurrent Year Climate Trends vs Historical
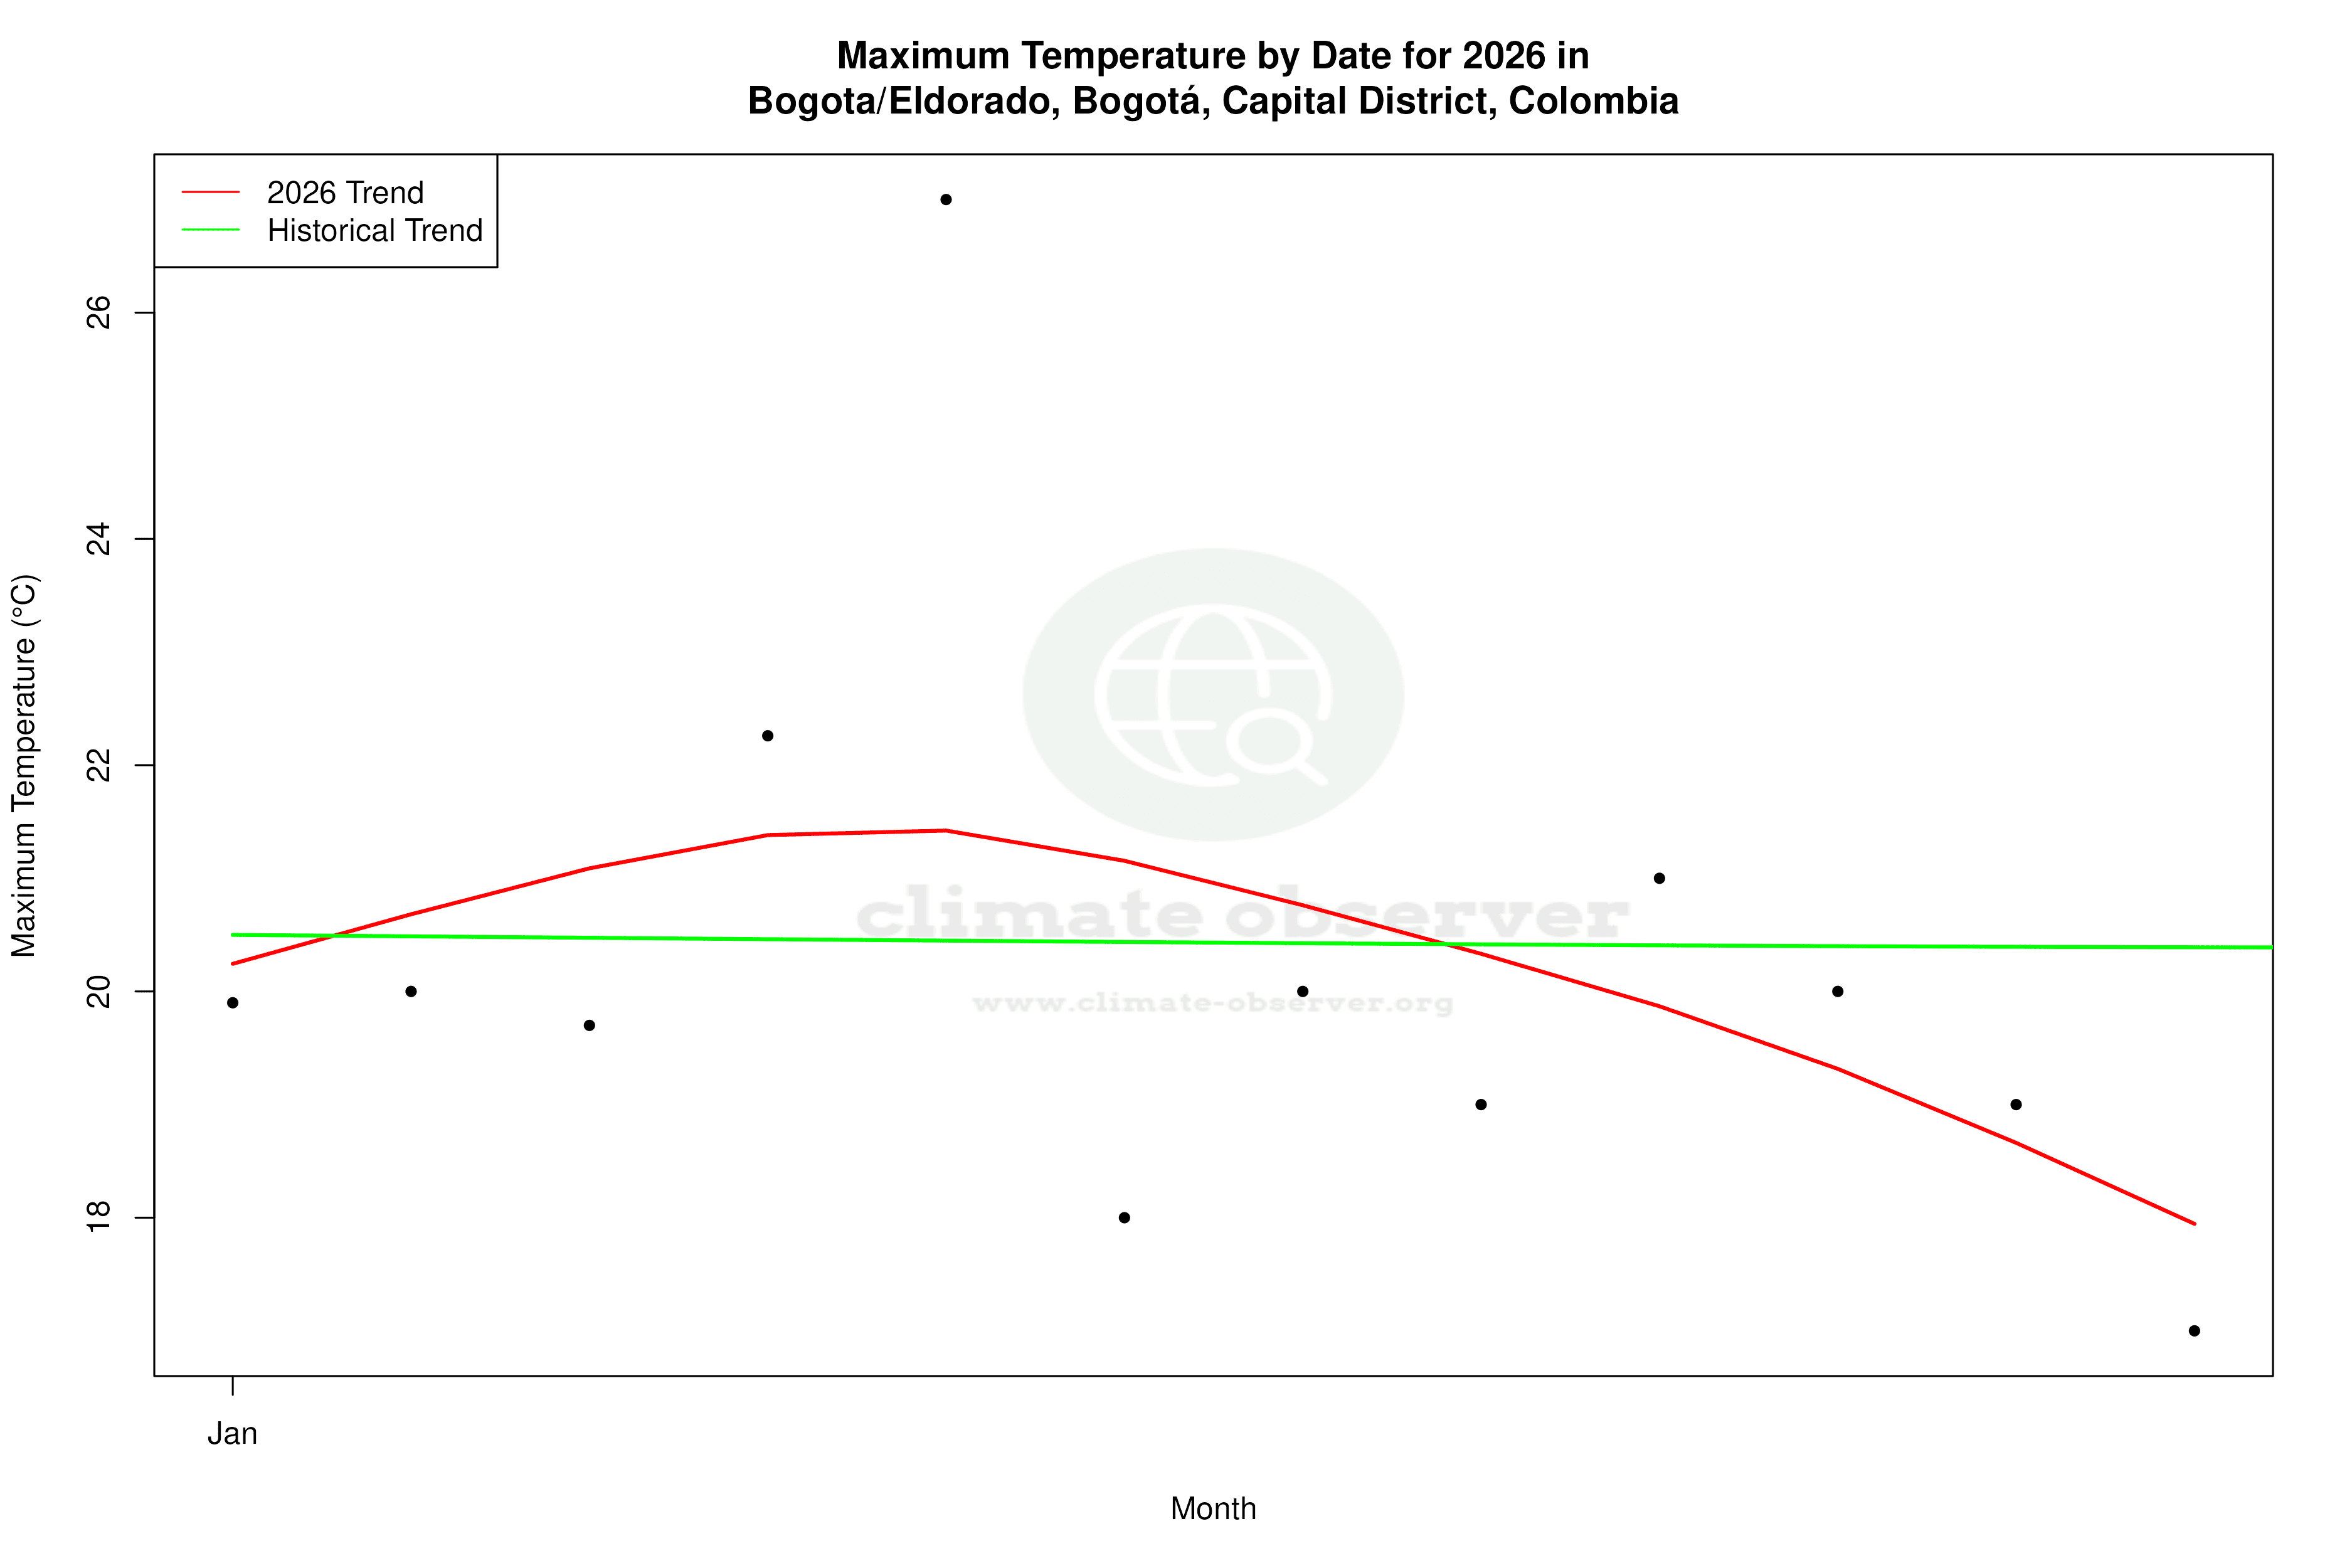


Max Temperature this Year | 1 of 6
Climate 12-Month Moving Averages
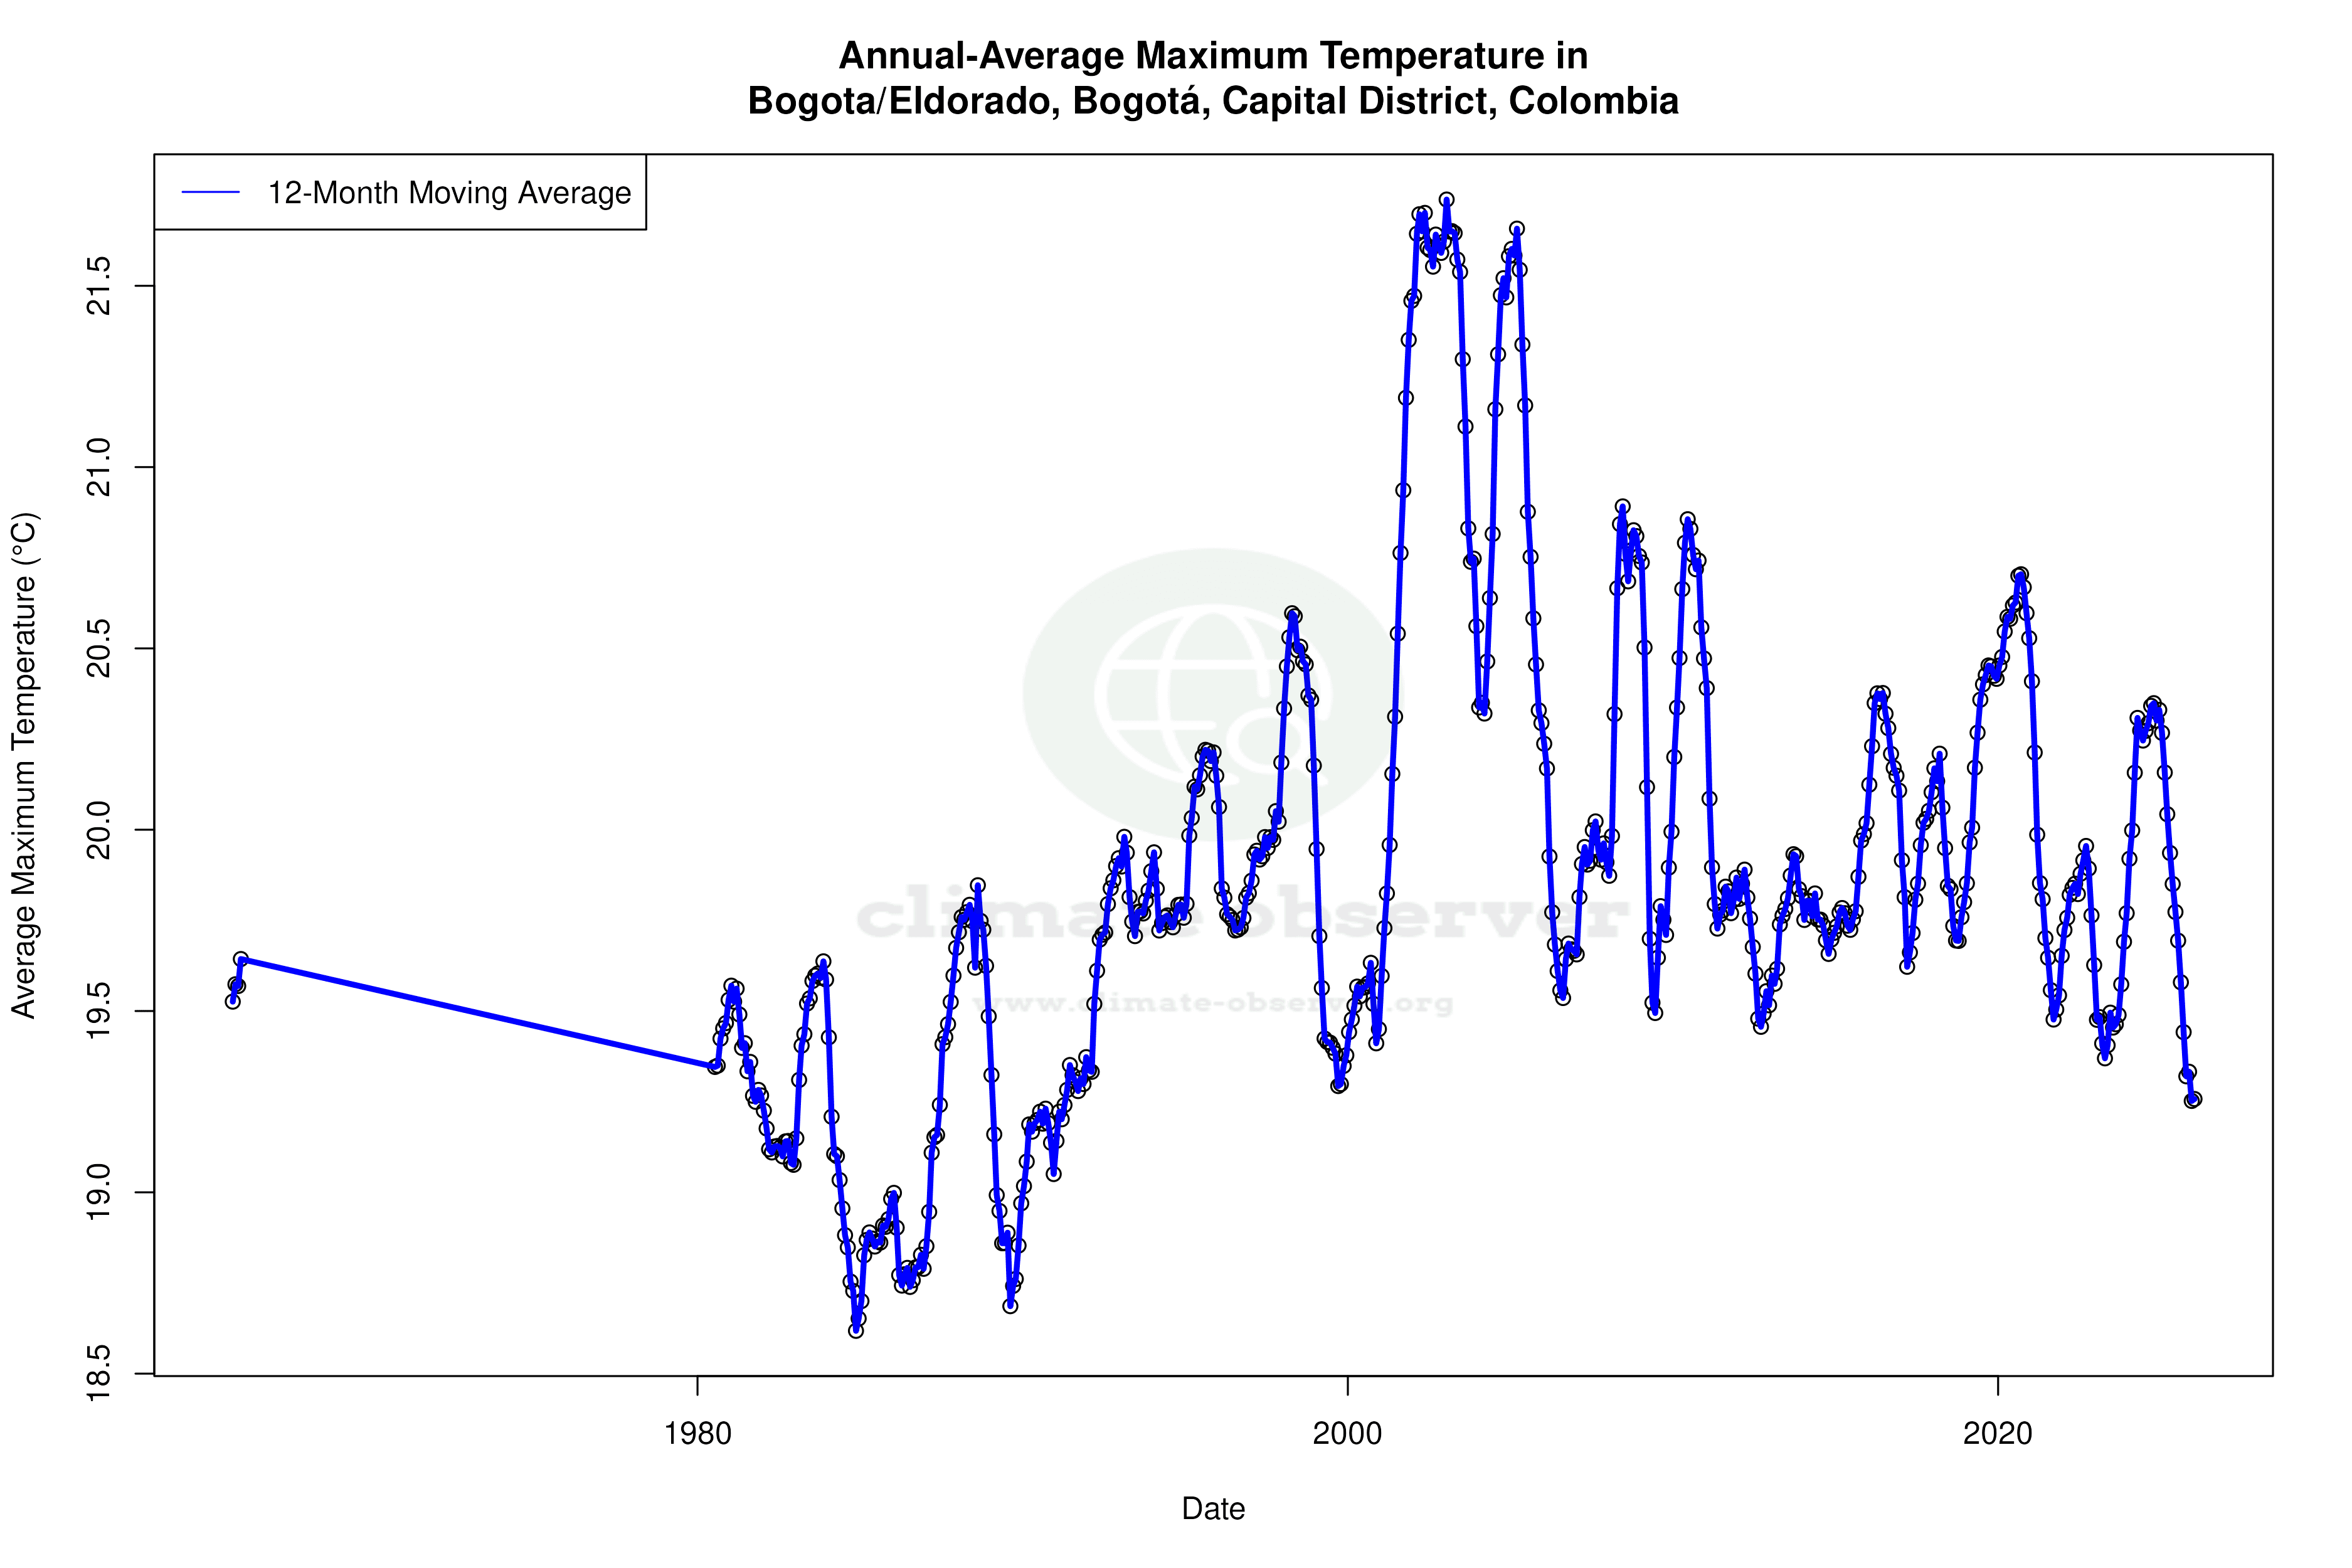


Max Temperature 12-Month MA | 1 of 6
Daily Data Points and Averages Throughout the Year
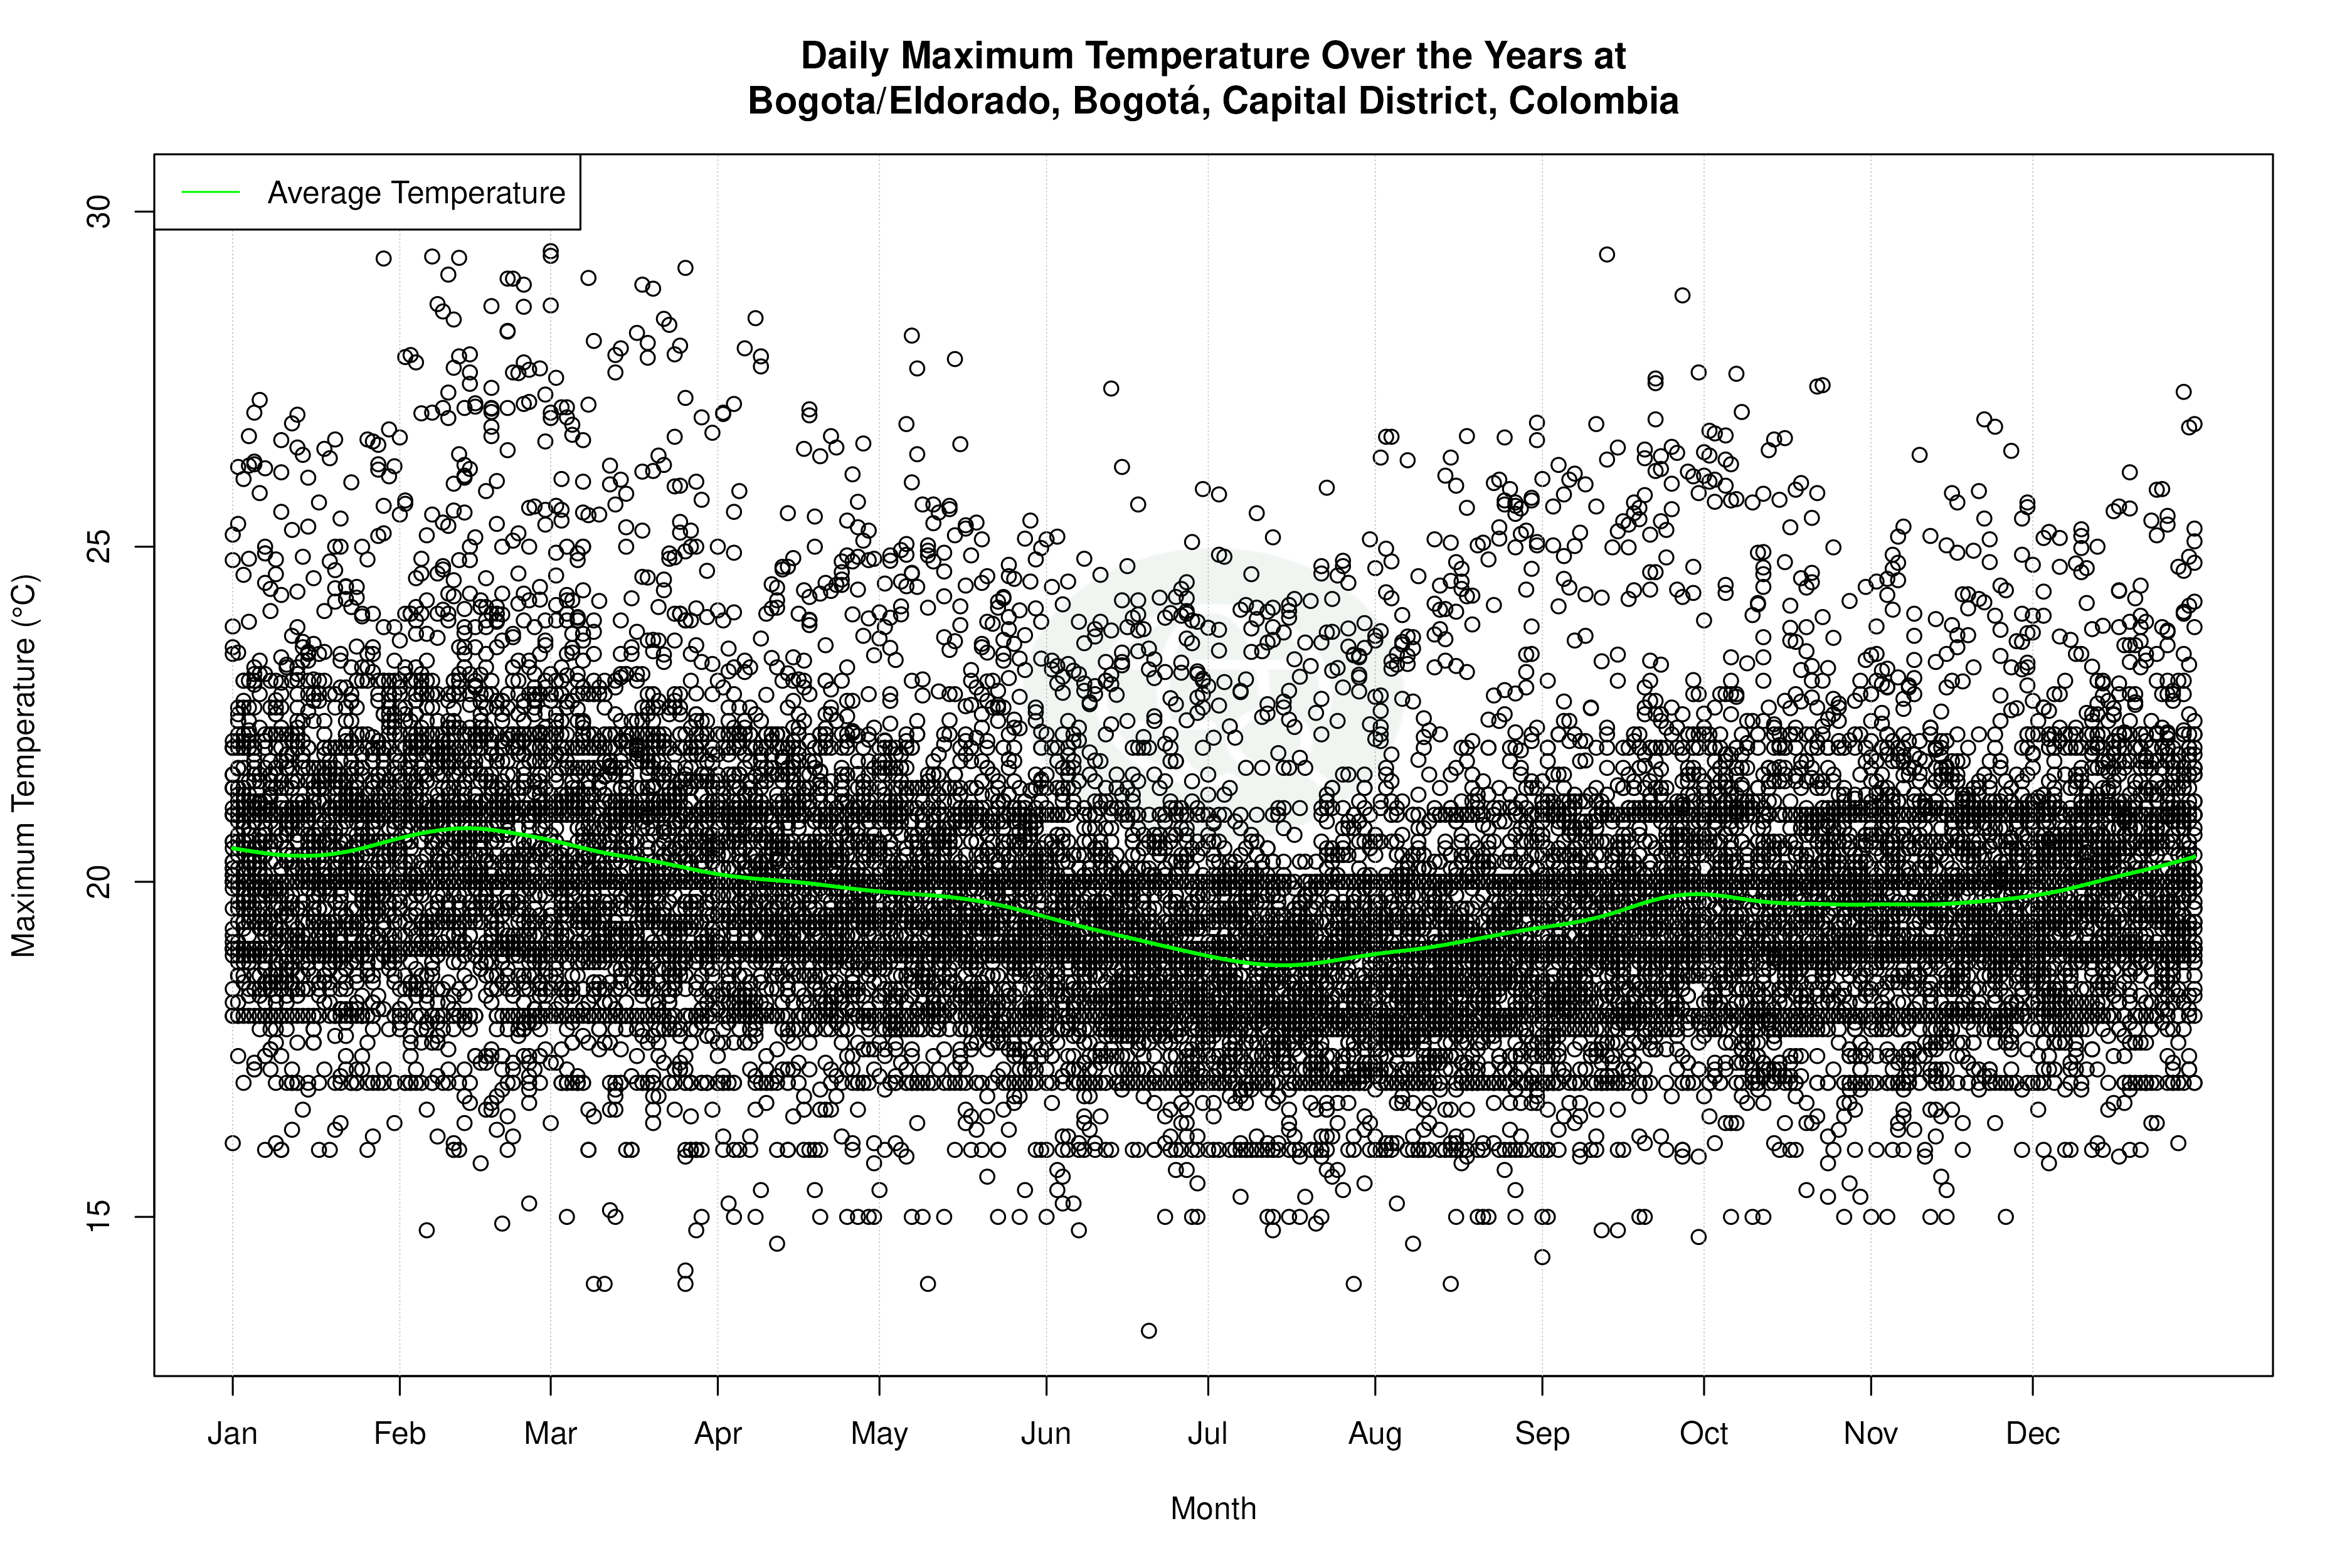
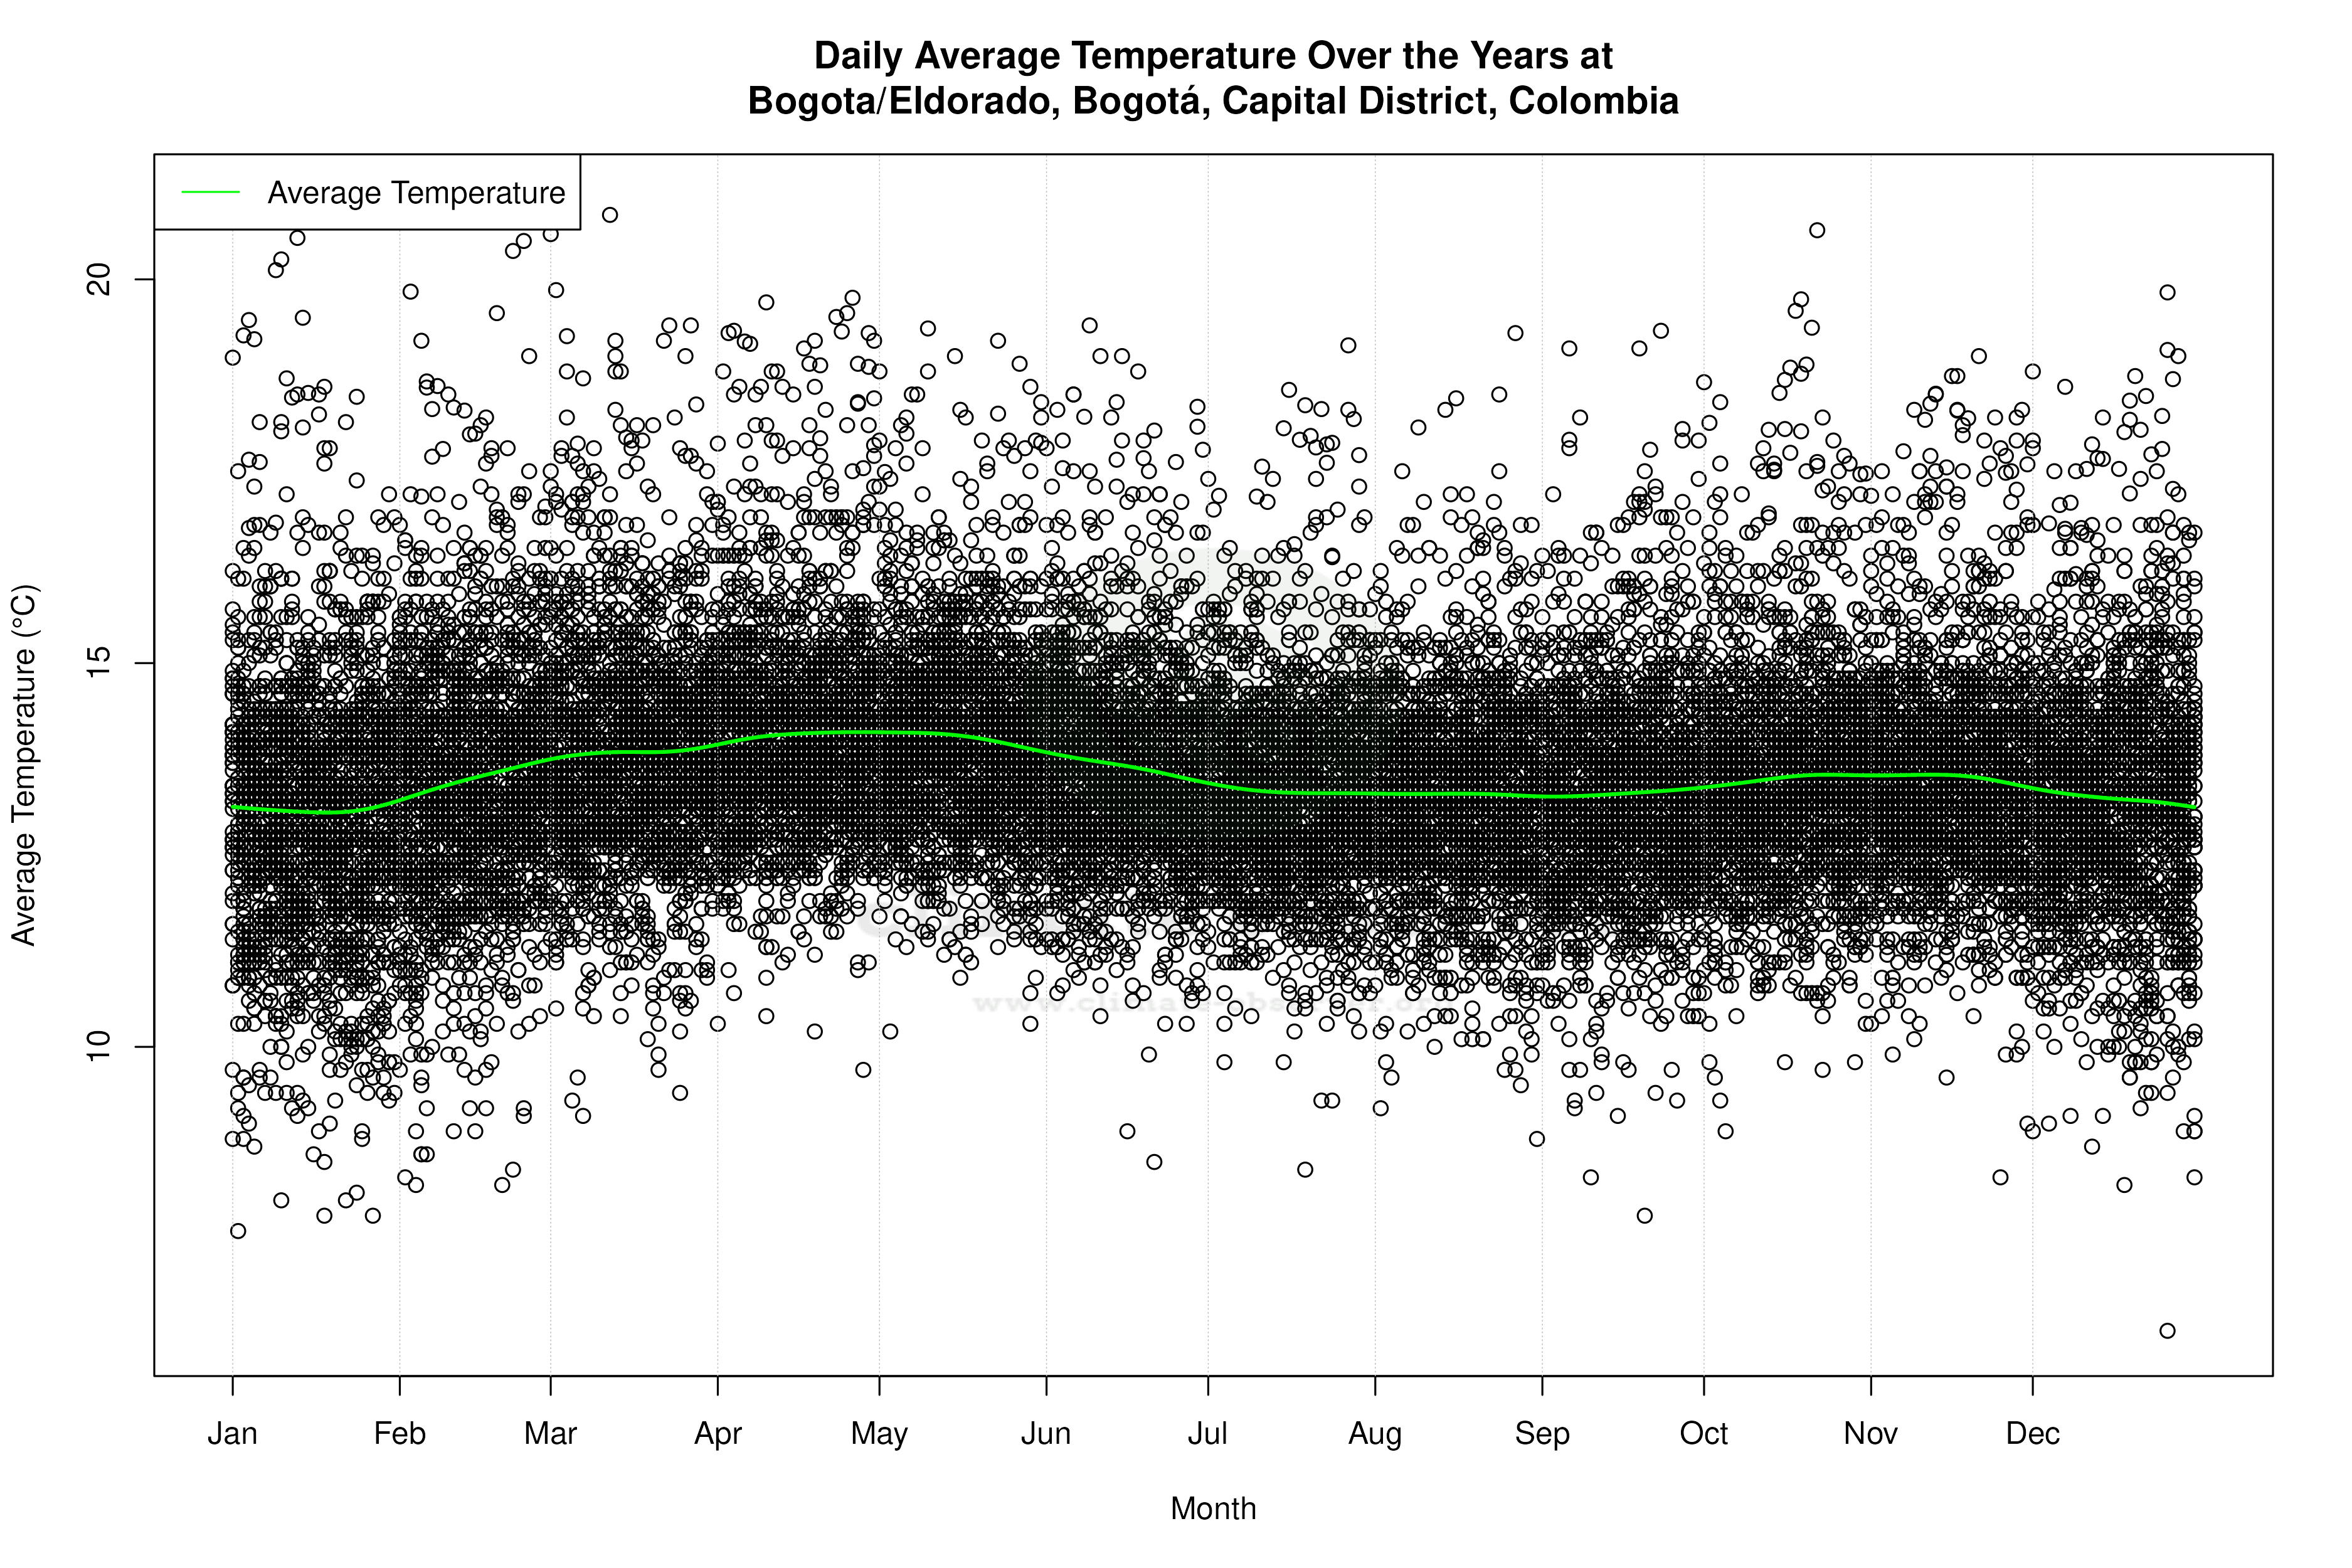


Average Max Temperature Throughout Year | 1 of 5
