Climate for Station: Berberati, Mambere-Kadei, Central African Republic
Loading live weather...
Climate Analysis & Overview
Berberati, nestled in the Central African Republic, is experiencing a warming trend with notable increases in both high and low temperatures over the past decade. The region's precipitation patterns have become slightly more evenly distributed, reflecting a minor shift in the Precipitation Concentration Index. These changes align with the broader climate goals of the Central African Republic to monitor and adapt to shifting climate dynamics.
Rising Temperatures in Berberati
Berberati, located at 4.22°N, 15.78°E, falls under the Tropical Savanna climate (Aw) according to the Köppen classification. This region is characterised by distinct wet and dry seasons, influenced by its proximity to the equator and the Congo Basin. Over the past decade, Berberati has experienced a significant warming trend, with high temperatures increasing by 1.26°C (2.27°F) and low temperatures by 0.63°C (1.13°F). The all-time trends also indicate a warming pattern, albeit more modest, with highs rising by 0.13°C (0.23°F) and lows by 0.14°C (0.25°F). This persistent rise in temperatures underscores the region's vulnerability to global climate changes.
Temperature Extremes and Records
The temperature extremes in Berberati highlight the area's climatic variability. The highest recorded temperature is 40.38°C (104.68°F), while the lowest is 5.90°C (42.62°F). These records reflect the potential for significant thermal oscillations, which can impact both the natural environment and human activities. Such extremes are crucial for understanding the potential challenges in agricultural productivity and water resource management, which are vital for the local economy and food security.
Precipitation Patterns and PCI Insights
The Precipitation Concentration Index (PCI) provides insights into how rainfall is distributed throughout the year. Berberati's PCI has seen a slight decrease from a baseline of 13.14 to a current value of 13.02. This marginal change suggests that precipitation is becoming slightly more evenly distributed, which can be beneficial for agriculture by reducing the risk of both droughts and floods. A PCI under 20 indicates that rainfall is not highly concentrated, thus supporting more stable agricultural cycles.
Regional Climate Dynamics
The Central African Republic is committed to understanding and adapting to climate changes, with regional goals focusing on sustainable development and environmental conservation. Berberati's climate data provides essential insights into these efforts, highlighting the need for adaptive strategies in response to rising temperatures and evolving precipitation patterns. Recent weather events, such as intense rainfall and prolonged dry spells, further emphasise the importance of resilient infrastructure and community preparedness.
Station Statistics
10-Year Trend
High: +1.20 °C/decade
Low: +0.77 °C/decade
Rain: -3.38 mm/decade
25-Year Trend
High: +0.10 °C/decade
Low: -0.50 °C/decade
Rain: +0.38 mm/decade
50-Year Trend
High: +0.44 °C/decade
Low: +0.14 °C/decade
Rain: +0.02 mm/decade
All-Time Trend
High: +0.13 °C/decade
Low: +0.14 °C/decade
Rain: +0.07 mm/decade
Percentage Above-Average Days
Last 12 Months: 52.1%
This Year: 50.8%
Precipitation Concentration Index (PCI) ℹ️
Last 12 Months: 11.3
Historical Average: 12.4
Percentile Rank of Last 12 Months ℹ️
High: 89th percentile
Low: 83rd percentile
Rain: 8th percentile
Change in Variance ℹ️
High: +1.2%
Low: +4.3%
Intraday: +18.2%
Data Coverage
88.9%
First Year of Data
1950
Station Location
Historical Weather Records
| Max High | Avg High | Min High | Max Avg | Avg Avg | Min Avg | Max Low | Avg Low | Min Low | Max Precipitation | Avg Precipitation | Max Snow | Avg Snow | |
|---|---|---|---|---|---|---|---|---|---|---|---|---|---|
| Record | 40.4 °C | — | 20.8 °C | 32.9 °C | — | 16.7 °C | 26.0 °C | — | 5.9 °C | 157.0 mm | — | — | — |
| January | 40.4 °C | 31.4 °C | 22.9 °C | 31.1 °C | 24.0 °C | 16.7 °C | 25.4 °C | 17.6 °C | 10.0 °C | 90.5 mm | 0.5 mm | — | — |
| February | 40.2 °C | 32.6 °C | 23.4 °C | 31.9 °C | 25.6 °C | 18.9 °C | 25.3 °C | 19.1 °C | 11.2 °C | 57.0 mm | 1.5 mm | — | — |
| March | 39.5 °C | 31.9 °C | 21.2 °C | 32.9 °C | 25.9 °C | 20.5 °C | 26.0 °C | 20.5 °C | 14.8 °C | 96.0 mm | 3.4 mm | — | — |
| April | 39.2 °C | 31.0 °C | 22.0 °C | 31.6 °C | 25.3 °C | 19.9 °C | 24.9 °C | 20.6 °C | 16.3 °C | 144.0 mm | 5.0 mm | — | — |
| May | 39.0 °C | 30.1 °C | 22.2 °C | 30.3 °C | 24.9 °C | 19.6 °C | 24.8 °C | 20.4 °C | 16.0 °C | 93.0 mm | 5.1 mm | — | — |
| June | 37.5 °C | 29.0 °C | 21.0 °C | 29.8 °C | 24.1 °C | 20.0 °C | 23.8 °C | 19.8 °C | 15.0 °C | 104.2 mm | 5.6 mm | — | — |
| July | 38.2 °C | 28.1 °C | 20.8 °C | 28.7 °C | 23.4 °C | 19.8 °C | 23.1 °C | 19.5 °C | 14.5 °C | 123.9 mm | 5.6 mm | — | — |
| August | 38.8 °C | 28.0 °C | 21.2 °C | 28.3 °C | 23.4 °C | 19.8 °C | 22.3 °C | 19.5 °C | 15.1 °C | 124.0 mm | 6.5 mm | — | — |
| September | 36.0 °C | 28.6 °C | 21.6 °C | 28.5 °C | 23.5 °C | 19.4 °C | 22.8 °C | 19.5 °C | 15.6 °C | 157.0 mm | 7.9 mm | — | — |
| October | 37.6 °C | 29.0 °C | 21.4 °C | 29.3 °C | 23.7 °C | 20.1 °C | 23.5 °C | 19.6 °C | 16.0 °C | 104.7 mm | 7.9 mm | — | — |
| November | 39.2 °C | 29.7 °C | 22.6 °C | 29.9 °C | 24.2 °C | 18.8 °C | 23.4 °C | 19.4 °C | 13.0 °C | 85.1 mm | 3.2 mm | — | — |
| December | 38.8 °C | 30.6 °C | 22.5 °C | 30.8 °C | 23.8 °C | 17.5 °C | 24.6 °C | 18.0 °C | 5.9 °C | 33.8 mm | 0.9 mm | — | — |
Data Visualisations
Remove WatermarksCurrent Year Climate Trends vs Historical


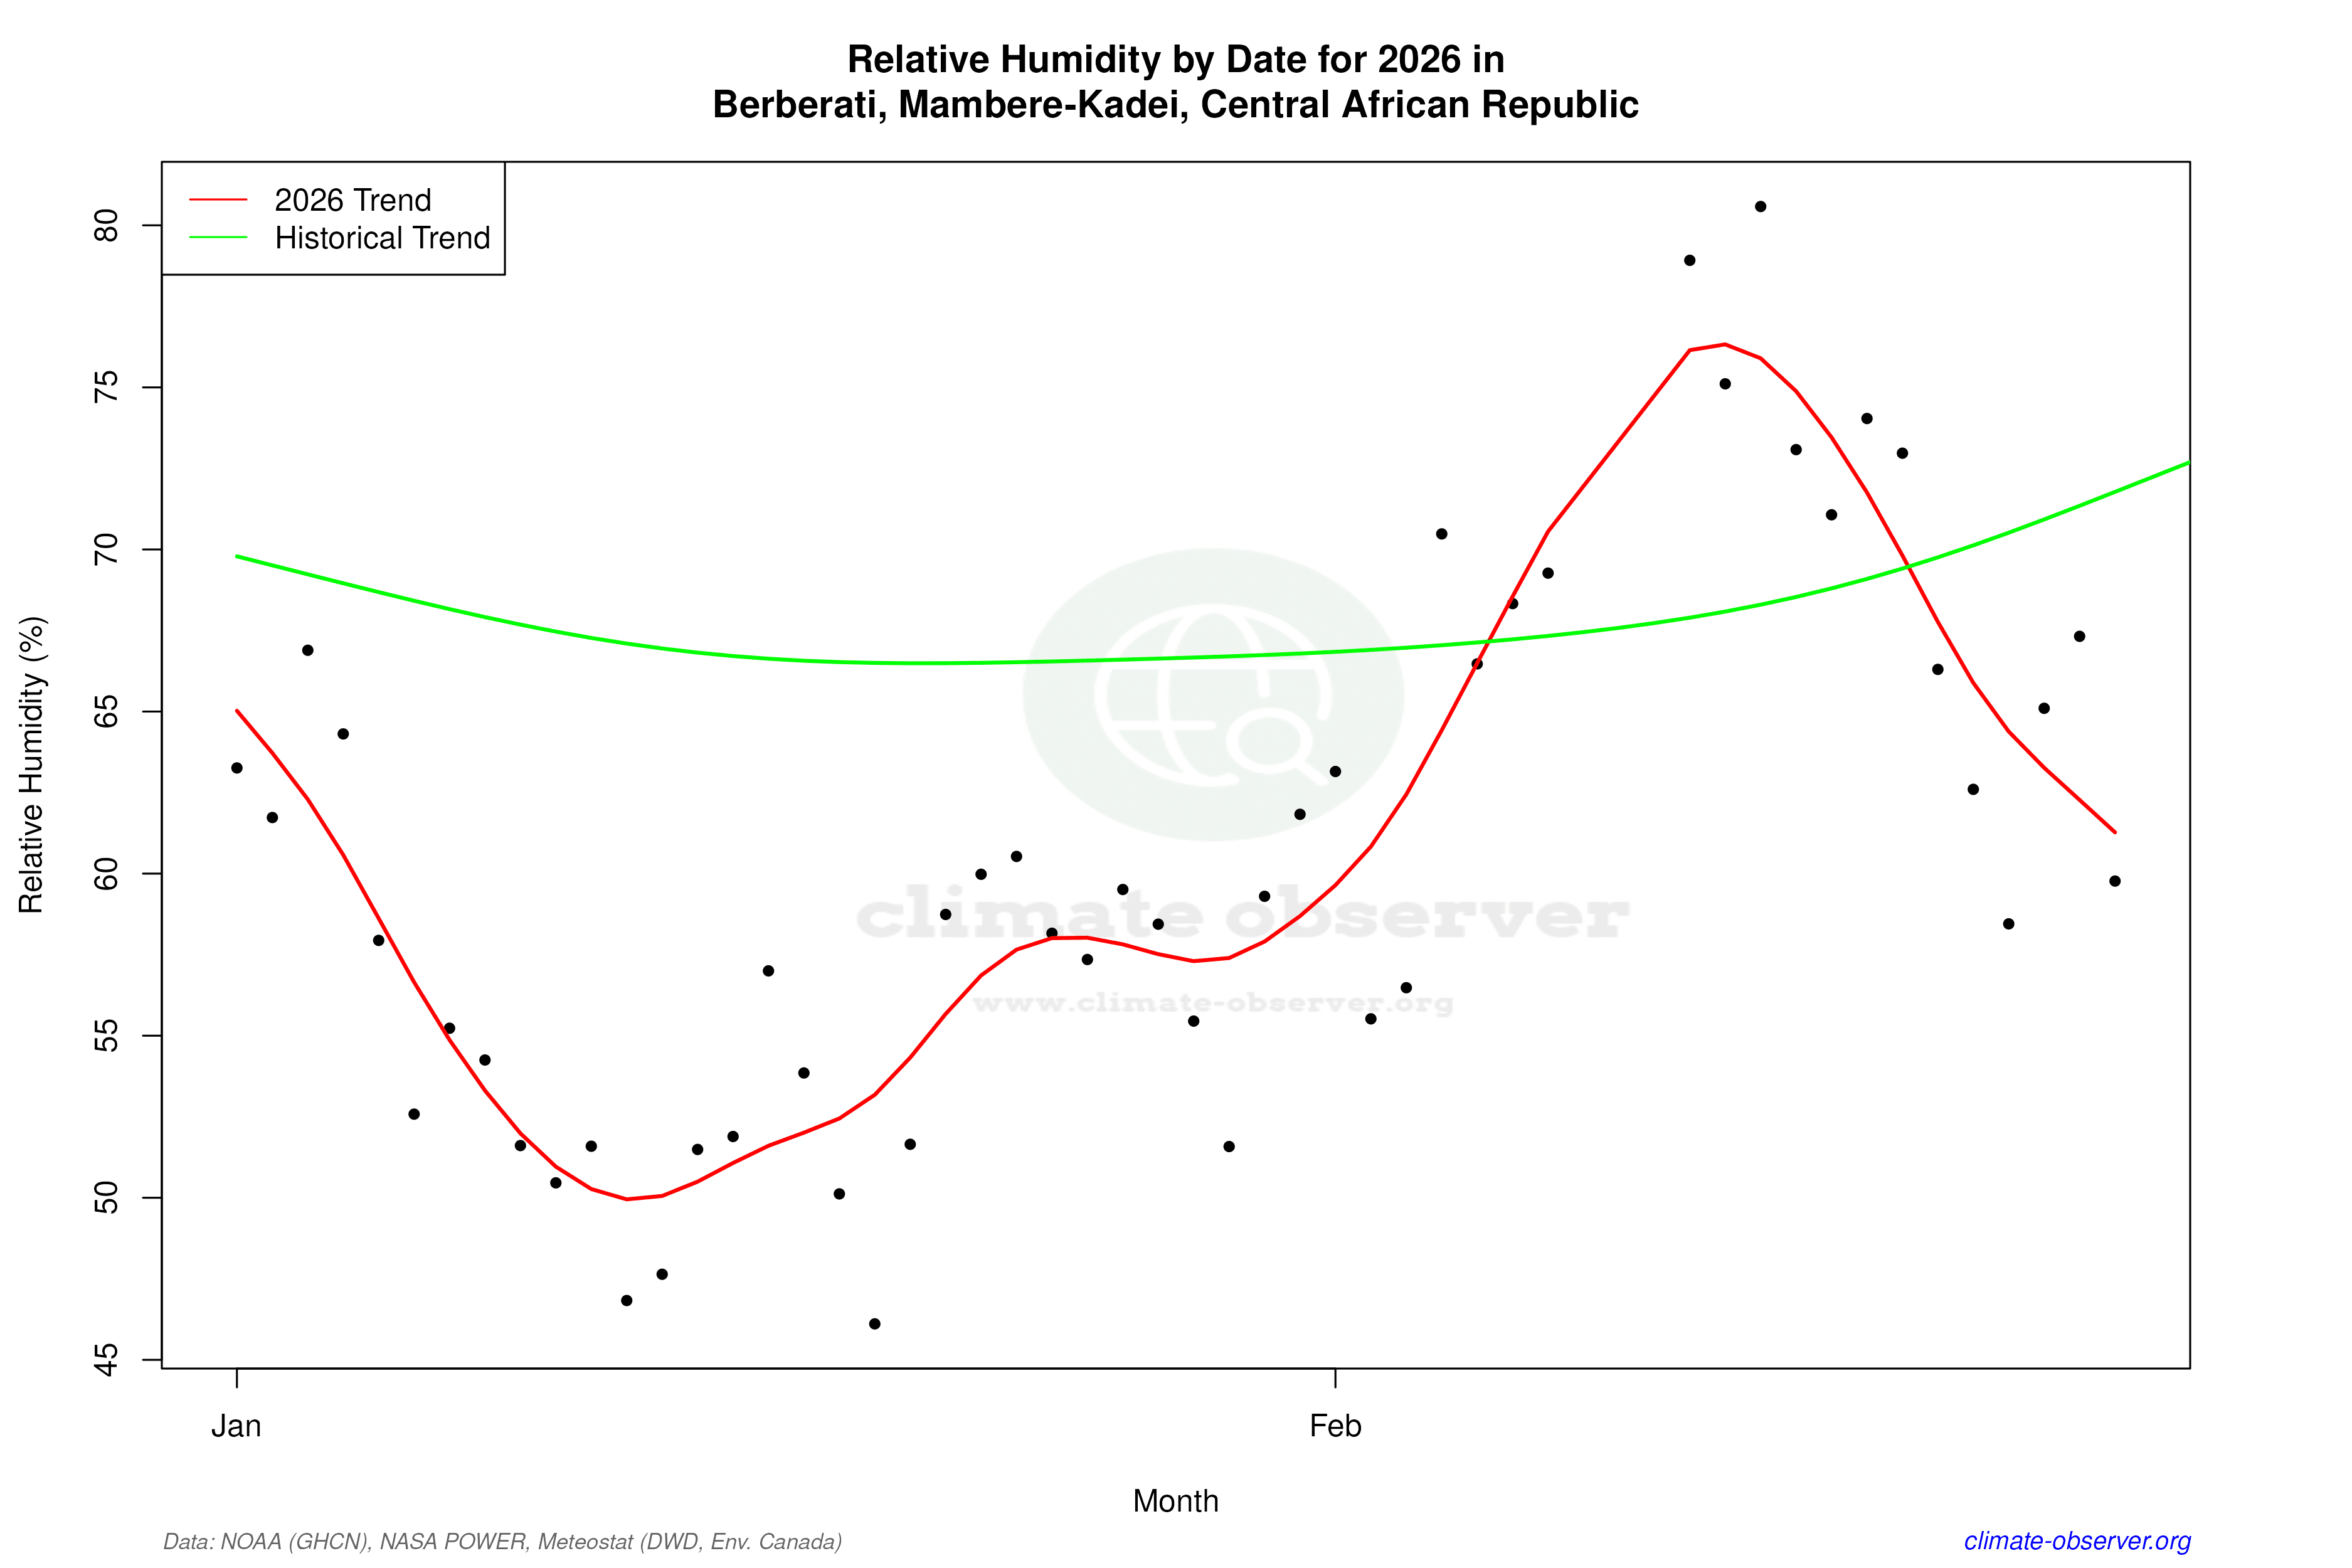

Max Temperature this Year | 1 of 6
Climate 12-Month Moving Averages


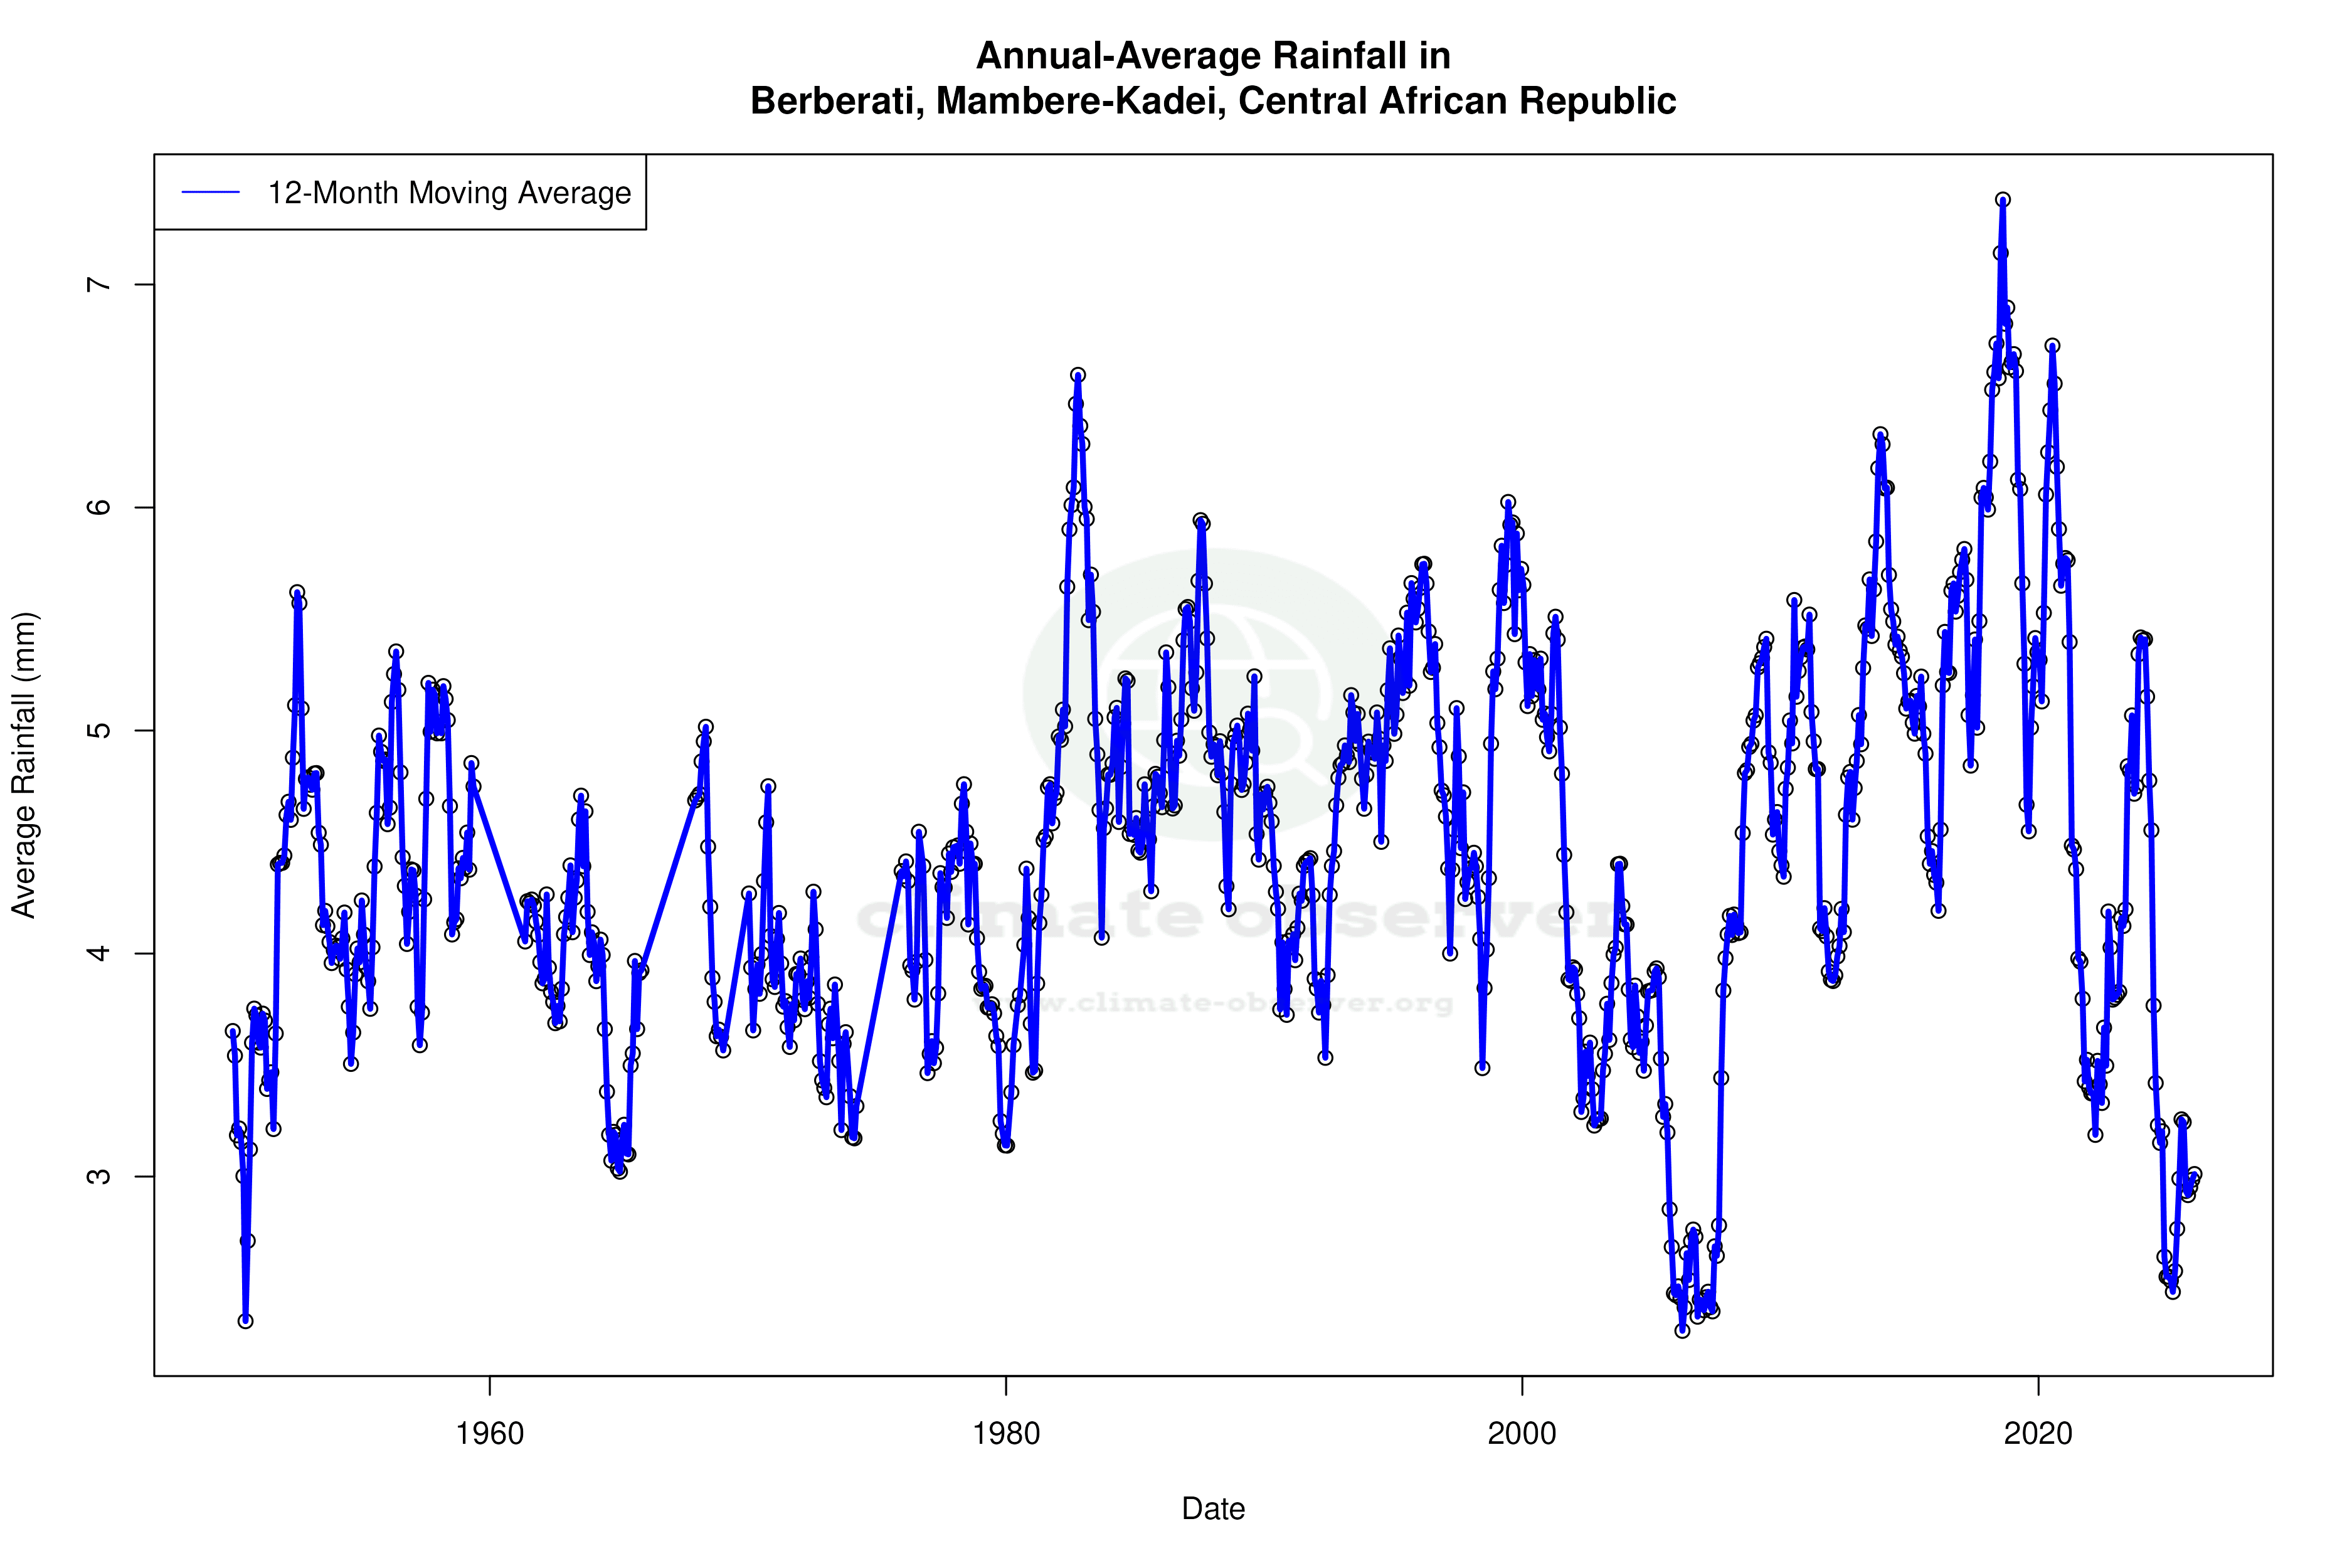
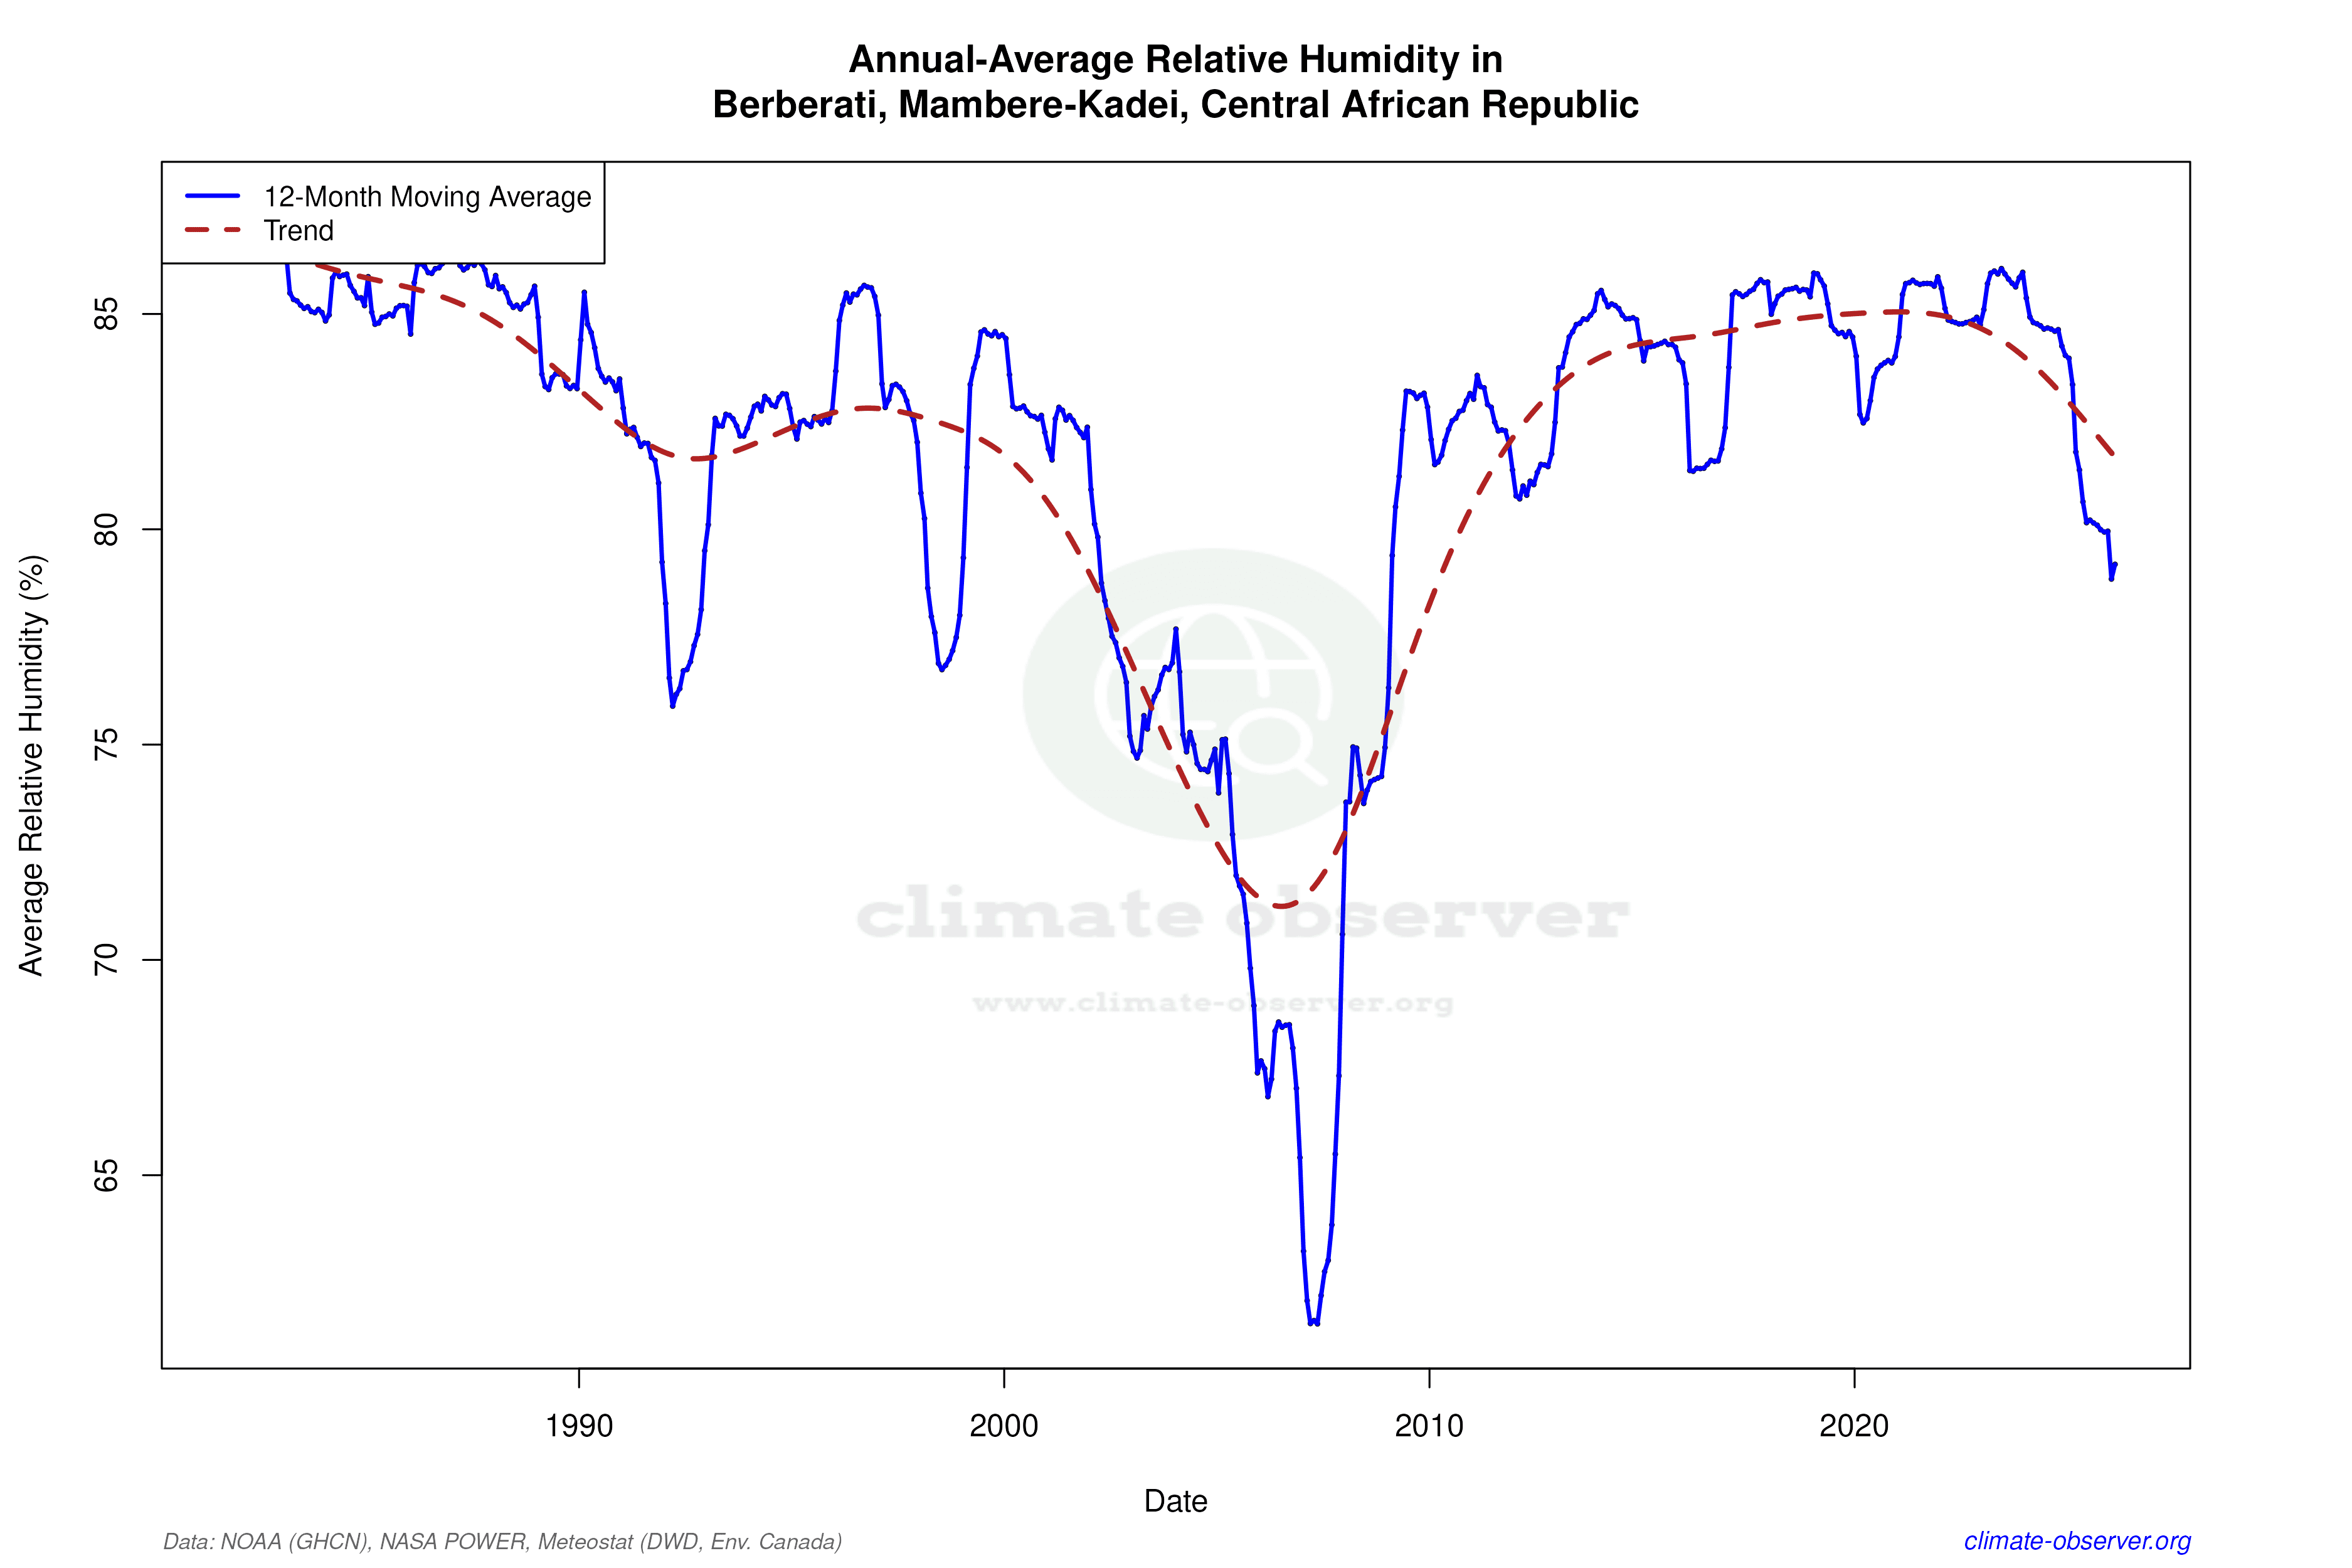

Max Temperature 12-Month MA | 1 of 6
Daily Data Points and Averages Throughout the Year


Average Max Temperature Throughout Year | 1 of 5
