Climate for Station: Bangui m Poko, Ombella M'Poko, Central African Republic
Loading live weather...
Climate Analysis & Overview
The climate profile of Bangui M'Poko reveals a warming trend in both high and low temperatures over the past decade, with a more pronounced increase in highs. The precipitation pattern has become slightly more even, suggesting a shift in rainfall distribution. These changes are critical for understanding the broader climatic shifts in the Central African Republic.
Warming Trends in Bangui M'Poko
Bangui M'Poko, located at 4.398°N, 18.519°E, is characterised by a tropical wet and dry climate, classified as Aw under the Köppen system. The region is influenced by its proximity to the Ubangi River, which moderates temperature extremes. Over the past decade, the area has experienced a notable increase in temperatures, with highs rising by 1.05°C (1.89°F) and lows by 0.42°C (0.76°F). These short-term trends are more pronounced than the all-time trends, which show a rise of 0.88°C (1.59°F) for highs and 0.34°C (0.61°F) for lows. This warming trend is consistent with broader regional patterns, which are influenced by global climate change and local environmental factors.
Temperature Extremes
The historical temperature records for Bangui M'Poko highlight the potential for extreme weather events. The recorded maximum temperature is 44.0°C (111.2°F), while the minimum is 8.2°C (46.8°F). These extremes underscore the variability within the region's climate, which can have significant implications for agriculture and water resources.
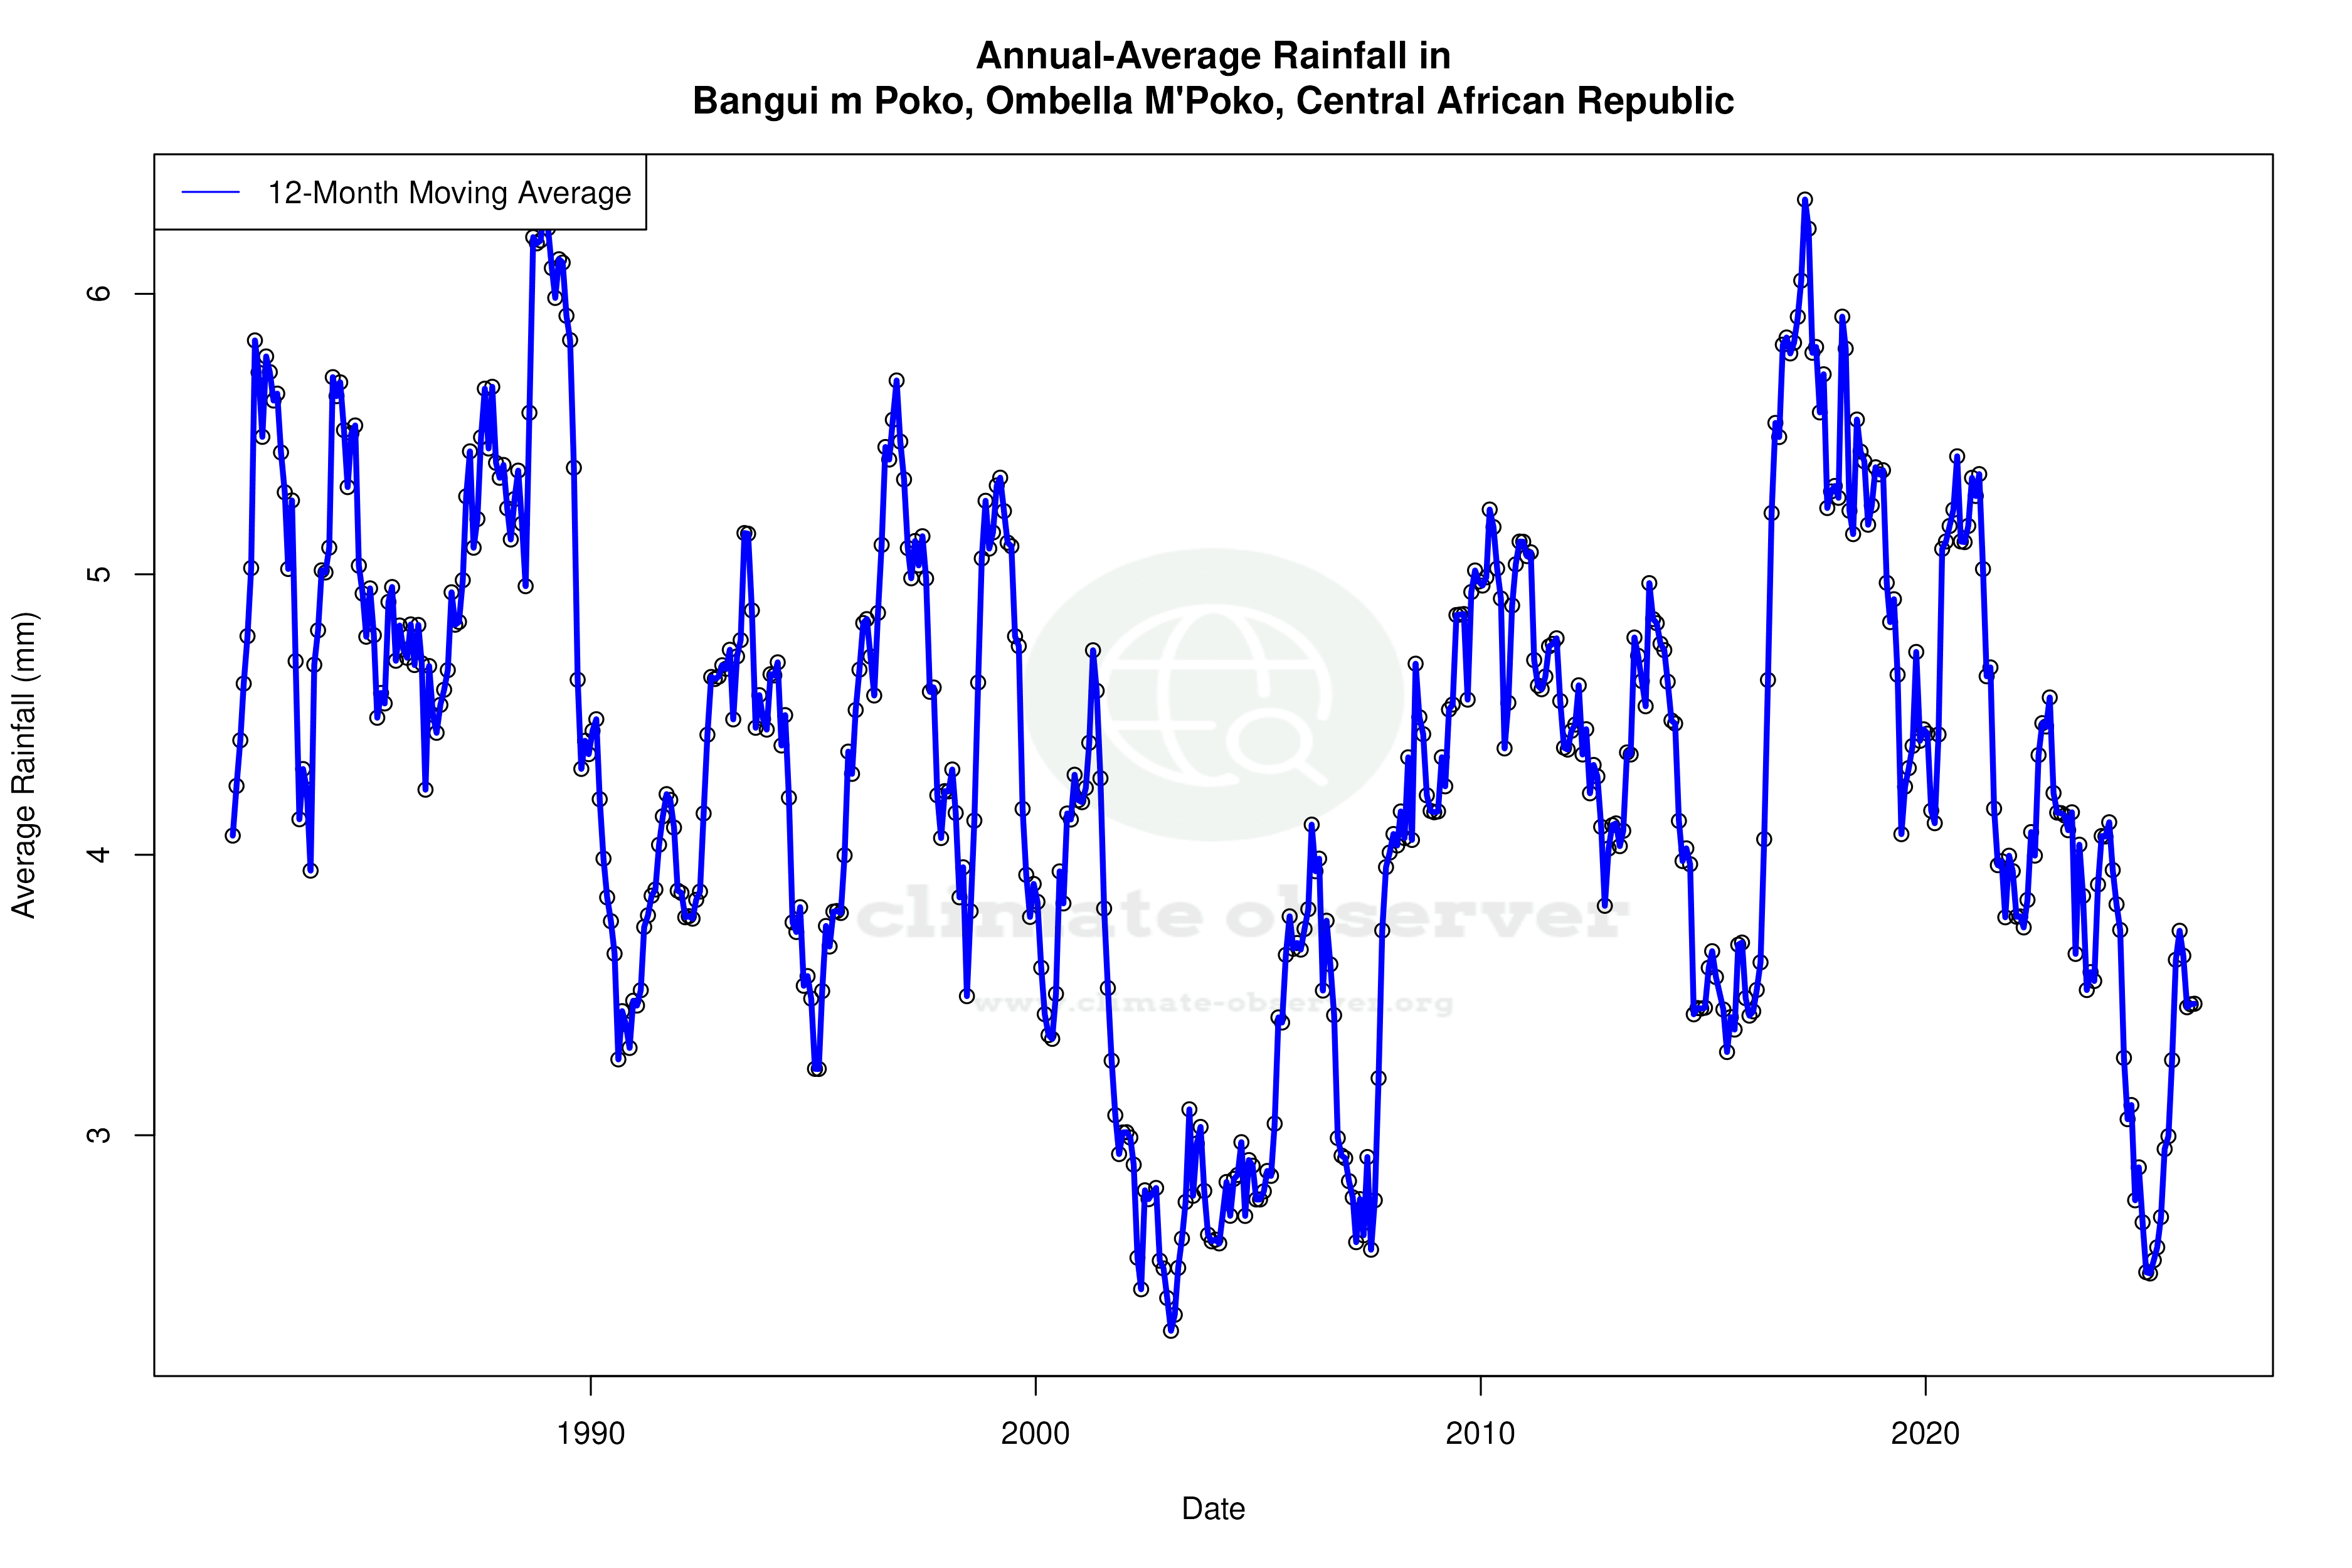
Precipitation Patterns and PCI
The Precipitation Concentration Index (PCI) is a critical measure for understanding rainfall distribution. A decrease from a baseline of 13.25 to the current 12.38 indicates a slight shift towards more evenly distributed precipitation events. This change suggests that rainfall is less concentrated in intense downpours and more spread out over time, which can be beneficial for reducing flood risks and improving water availability for crops.
Implications for Regional Climate Goals
The Central African Republic is actively working towards climate resilience and sustainable development. The warming trends observed in Bangui M'Poko align with the challenges faced by the region, including managing heat stress and ensuring water security. The slight improvement in precipitation distribution could support agricultural productivity, a key component of the country's economic and environmental strategy. Understanding these localised trends is essential for informing policy and adaptation measures in the face of ongoing climate change.
Station Statistics
10-Year Trend
High: +1.03 °C/decade
Low: +0.46 °C/decade
Rain: -2.64 mm/decade
25-Year Trend
High: +0.31 °C/decade
Low: +0.07 °C/decade
Rain: +0.39 mm/decade
50-Year Trend
High: +0.89 °C/decade
Low: +0.33 °C/decade
Rain: -0.17 mm/decade
All-Time Trend
High: +0.89 °C/decade
Low: +0.33 °C/decade
Rain: -0.17 mm/decade
Percentage Above-Average Days
Last 12 Months: 78.4%
This Year: 75.0%
Precipitation Concentration Index (PCI) ℹ️
Last 12 Months: 14.5
Historical Average: 12.8
Percentile Rank of Last 12 Months ℹ️
High: 97th percentile
Low: 75th percentile
Rain: 12th percentile
Change in Variance ℹ️
High: -28.6%
Low: -8.2%
Intraday: -12.8%
Data Coverage
91.9%
First Year of Data
1985
Station Location
Historical Weather Records
| Max High | Avg High | Min High | Max Avg | Avg Avg | Min Avg | Max Low | Avg Low | Min Low | Max Precipitation | Avg Precipitation | Max Snow | Avg Snow | |
|---|---|---|---|---|---|---|---|---|---|---|---|---|---|
| Record | 44.0 °C | — | 22.0 °C | 34.8 °C | — | 15.1 °C | 28.8 °C | — | 8.2 °C | 164.1 mm | — | — | — |
| January | 41.5 °C | 33.4 °C | 25.1 °C | 31.9 °C | 25.2 °C | 15.1 °C | 27.0 °C | 19.0 °C | 10.4 °C | 32.0 mm | 0.6 mm | — | — |
| February | 44.0 °C | 34.7 °C | 25.5 °C | 33.3 °C | 27.1 °C | 17.7 °C | 28.8 °C | 20.9 °C | 8.2 °C | 91.7 mm | 1.5 mm | — | — |
| March | 42.4 °C | 33.9 °C | 24.5 °C | 34.8 °C | 27.5 °C | 21.9 °C | 28.1 °C | 22.4 °C | 14.4 °C | 105.9 mm | 3.5 mm | — | — |
| April | 40.8 °C | 32.6 °C | 24.0 °C | 34.0 °C | 26.9 °C | 20.0 °C | 27.3 °C | 22.5 °C | 16.4 °C | 78.0 mm | 4.4 mm | — | — |
| May | 40.2 °C | 31.8 °C | 24.0 °C | 32.8 °C | 26.4 °C | 21.1 °C | 27.5 °C | 22.2 °C | 18.5 °C | 164.1 mm | 5.3 mm | — | — |
| June | 39.0 °C | 30.7 °C | 23.0 °C | 30.7 °C | 25.6 °C | 18.9 °C | 25.4 °C | 21.6 °C | 16.0 °C | 150.1 mm | 5.6 mm | — | — |
| July | 40.0 °C | 29.9 °C | 22.5 °C | 29.6 °C | 24.9 °C | 19.7 °C | 24.7 °C | 21.3 °C | 18.0 °C | 126.0 mm | 6.7 mm | — | — |
| August | 39.0 °C | 29.8 °C | 23.0 °C | 29.0 °C | 24.9 °C | 18.2 °C | 24.5 °C | 21.2 °C | 17.0 °C | 99.1 mm | 6.8 mm | — | — |
| September | 40.0 °C | 30.4 °C | 22.0 °C | 30.4 °C | 25.0 °C | 19.8 °C | 24.0 °C | 21.2 °C | 17.5 °C | 132.3 mm | 6.4 mm | — | — |
| October | 38.0 °C | 30.5 °C | 22.8 °C | 29.9 °C | 25.0 °C | 20.0 °C | 24.2 °C | 21.3 °C | 17.2 °C | 95.0 mm | 6.5 mm | — | — |
| November | 40.5 °C | 31.3 °C | 23.7 °C | 31.1 °C | 25.3 °C | 20.1 °C | 24.9 °C | 21.0 °C | 13.7 °C | 73.9 mm | 3.0 mm | — | — |
| December | 41.0 °C | 32.3 °C | 23.2 °C | 30.5 °C | 25.0 °C | 17.2 °C | 25.9 °C | 19.7 °C | 10.0 °C | 70.1 mm | 1.0 mm | — | — |
Data Visualisations
Remove WatermarksCurrent Year Climate Trends vs Historical


Max Temperature this Year | 1 of 6
Climate 12-Month Moving Averages


Max Temperature 12-Month MA | 1 of 6
Daily Data Points and Averages Throughout the Year


Average Max Temperature Throughout Year | 1 of 5
