Climate for Station: Guantanamo Bay Nas, Guantanamo, Cuba
Loading live weather...
Climate Analysis & Overview
Guantanamo Bay Nas, located in Caimanera, Cuba, is experiencing nuanced climate dynamics. While all-time temperature trends show a slight warming, recent trends indicate a divergence with cooling highs and warming lows. Precipitation patterns have become more evenly distributed, suggesting a shift in rainfall dynamics.
Tropical Climate Dynamics
Guantanamo Bay Nas is situated within a tropical savanna climate zone, according to the Köppen classification. This climate is characterised by distinct wet and dry seasons, influenced by the Caribbean Sea's proximity. The station's all-time temperature trends reveal a gradual warming, with highs increasing by 0.11°C (0.20°F) and lows by 0.07°C (0.13°F). However, the past decade presents a more complex picture: highs have cooled by 0.14°C (0.25°F), while lows have warmed by 0.33°C (0.59°F). This divergence suggests potential shifts in daily temperature ranges, possibly influenced by regional weather patterns and oceanic currents.
Precipitation Patterns and Distribution
The Precipitation Concentration Index (PCI) provides insights into rainfall distribution. A decrease from a baseline of 16.13 to a current value of 14.02 indicates that precipitation has become more evenly distributed over the year. This shift suggests a reduction in the intensity of individual rainfall events, which could mitigate flood risks and benefit agriculture. The PCI value, now below 20, reflects a moderate concentration, aligning with Cuba's broader climate resilience goals, which include improving water management and reducing the impact of extreme weather events.
Temperature Extremes
Guantanamo Bay Nas has recorded a maximum temperature of 38.9°C (102.0°F) and a minimum of 13.9°C (57.0°F). These extremes highlight the station's capacity for significant thermal variation, despite its tropical location. Such temperature records are crucial for understanding the potential impacts of heatwaves and cold snaps on local ecosystems and infrastructure.
Regional Climate Considerations
The station's climate data should be viewed within the context of Cuba's regional climate initiatives, which aim to enhance resilience against climate change. Recent weather events, including hurricanes and tropical storms, have underscored the importance of adaptive strategies. The observed cooling of highs over the past decade may be linked to increased cloud cover or changes in sea surface temperatures, both of which are areas of active research.
Geographical Influences
The geographical setting of Guantanamo Bay, bordered by mountains and the sea, plays a pivotal role in its climate profile. The mountains can alter wind patterns and precipitation, while the sea moderates temperature extremes. This interplay of geographical features contributes to the unique climate dynamics observed at the station, offering valuable insights for climatologists and policymakers alike.
Station Statistics
10-Year Trend
High: +0.09 °C/decade
Low: +0.12 °C/decade
Rain: +1.74 mm/decade
25-Year Trend
High: +0.93 °C/decade
Low: +0.14 °C/decade
Rain: +0.32 mm/decade
50-Year Trend
High: +0.02 °C/decade
Low: +0.05 °C/decade
Rain: +0.16 mm/decade
All-Time Trend
High: +0.11 °C/decade
Low: +0.07 °C/decade
Rain: +0.03 mm/decade
Percentage Above-Average Days
Last 12 Months: 62.7%
This Year: 28.9%
Precipitation Concentration Index (PCI) ℹ️
Last 12 Months: 16.2
Historical Average: 17.5
Percentile Rank of Last 12 Months ℹ️
High: 90th percentile
Low: 91st percentile
Rain: 91st percentile
Change in Variance ℹ️
High: -33.0%
Low: -9.3%
Intraday: -30.0%
Data Coverage
97.8%
First Year of Data
1945
Station Location
Historical Weather Records
| Max High | Avg High | Min High | Max Avg | Avg Avg | Min Avg | Max Low | Avg Low | Min Low | Max Precipitation | Avg Precipitation | Max Snow | Avg Snow | |
|---|---|---|---|---|---|---|---|---|---|---|---|---|---|
| Record | 39.9 °C | — | 21.7 °C | 32.1 °C | — | 18.5 °C | 29.4 °C | — | 13.9 °C | 255.0 mm | — | 0.0 mm | — |
| January | 36.0 °C | 29.5 °C | 21.7 °C | 28.8 °C | 24.5 °C | 18.8 °C | 25.6 °C | 20.2 °C | 13.9 °C | 223.8 mm | 0.7 mm | 0.0 mm | 0.0 mm |
| February | 35.0 °C | 29.6 °C | 22.6 °C | 28.2 °C | 24.8 °C | 18.5 °C | 26.1 °C | 20.3 °C | 13.9 °C | 56.6 mm | 0.7 mm | 0.0 mm | 0.0 mm |
| March | 35.0 °C | 30.0 °C | 22.2 °C | 28.7 °C | 25.4 °C | 20.7 °C | 27.2 °C | 21.0 °C | 15.0 °C | 61.7 mm | 0.9 mm | 0.0 mm | 0.0 mm |
| April | 35.0 °C | 30.6 °C | 23.3 °C | 29.4 °C | 26.3 °C | 21.9 °C | 27.2 °C | 22.1 °C | 17.2 °C | 73.9 mm | 1.0 mm | 0.0 mm | 0.0 mm |
| May | 37.2 °C | 31.2 °C | 24.4 °C | 30.1 °C | 27.1 °C | 22.4 °C | 28.9 °C | 23.3 °C | 18.9 °C | 183.4 mm | 2.7 mm | 0.0 mm | 0.0 mm |
| June | 37.2 °C | 32.1 °C | 24.4 °C | 31.3 °C | 28.1 °C | 23.7 °C | 28.9 °C | 24.3 °C | 20.0 °C | 255.0 mm | 1.9 mm | 0.0 mm | 0.0 mm |
| July | 39.9 °C | 33.0 °C | 28.1 °C | 32.1 °C | 28.7 °C | 25.0 °C | 27.8 °C | 24.6 °C | 20.0 °C | 111.4 mm | 1.0 mm | 0.0 mm | 0.0 mm |
| August | 38.9 °C | 33.1 °C | 26.7 °C | 31.4 °C | 28.7 °C | 24.7 °C | 28.3 °C | 24.6 °C | 20.0 °C | 69.9 mm | 1.7 mm | 0.0 mm | 0.0 mm |
| September | 37.8 °C | 32.6 °C | 25.6 °C | 31.4 °C | 28.2 °C | 23.4 °C | 29.4 °C | 24.4 °C | 19.4 °C | 132.6 mm | 2.7 mm | 0.0 mm | 0.0 mm |
| October | 38.3 °C | 31.8 °C | 23.9 °C | 31.0 °C | 27.4 °C | 23.4 °C | 27.8 °C | 23.8 °C | 20.0 °C | 193.0 mm | 4.4 mm | 0.0 mm | 0.0 mm |
| November | 37.2 °C | 31.1 °C | 24.4 °C | 29.7 °C | 26.3 °C | 20.5 °C | 28.0 °C | 22.6 °C | 16.1 °C | 78.2 mm | 1.6 mm | 0.0 mm | 0.0 mm |
| December | 35.0 °C | 30.1 °C | 23.9 °C | 29.5 °C | 25.1 °C | 19.5 °C | 26.1 °C | 21.1 °C | 13.9 °C | 79.0 mm | 0.8 mm | 0.0 mm | 0.0 mm |
Data Visualisations
Remove WatermarksCurrent Year Climate Trends vs Historical


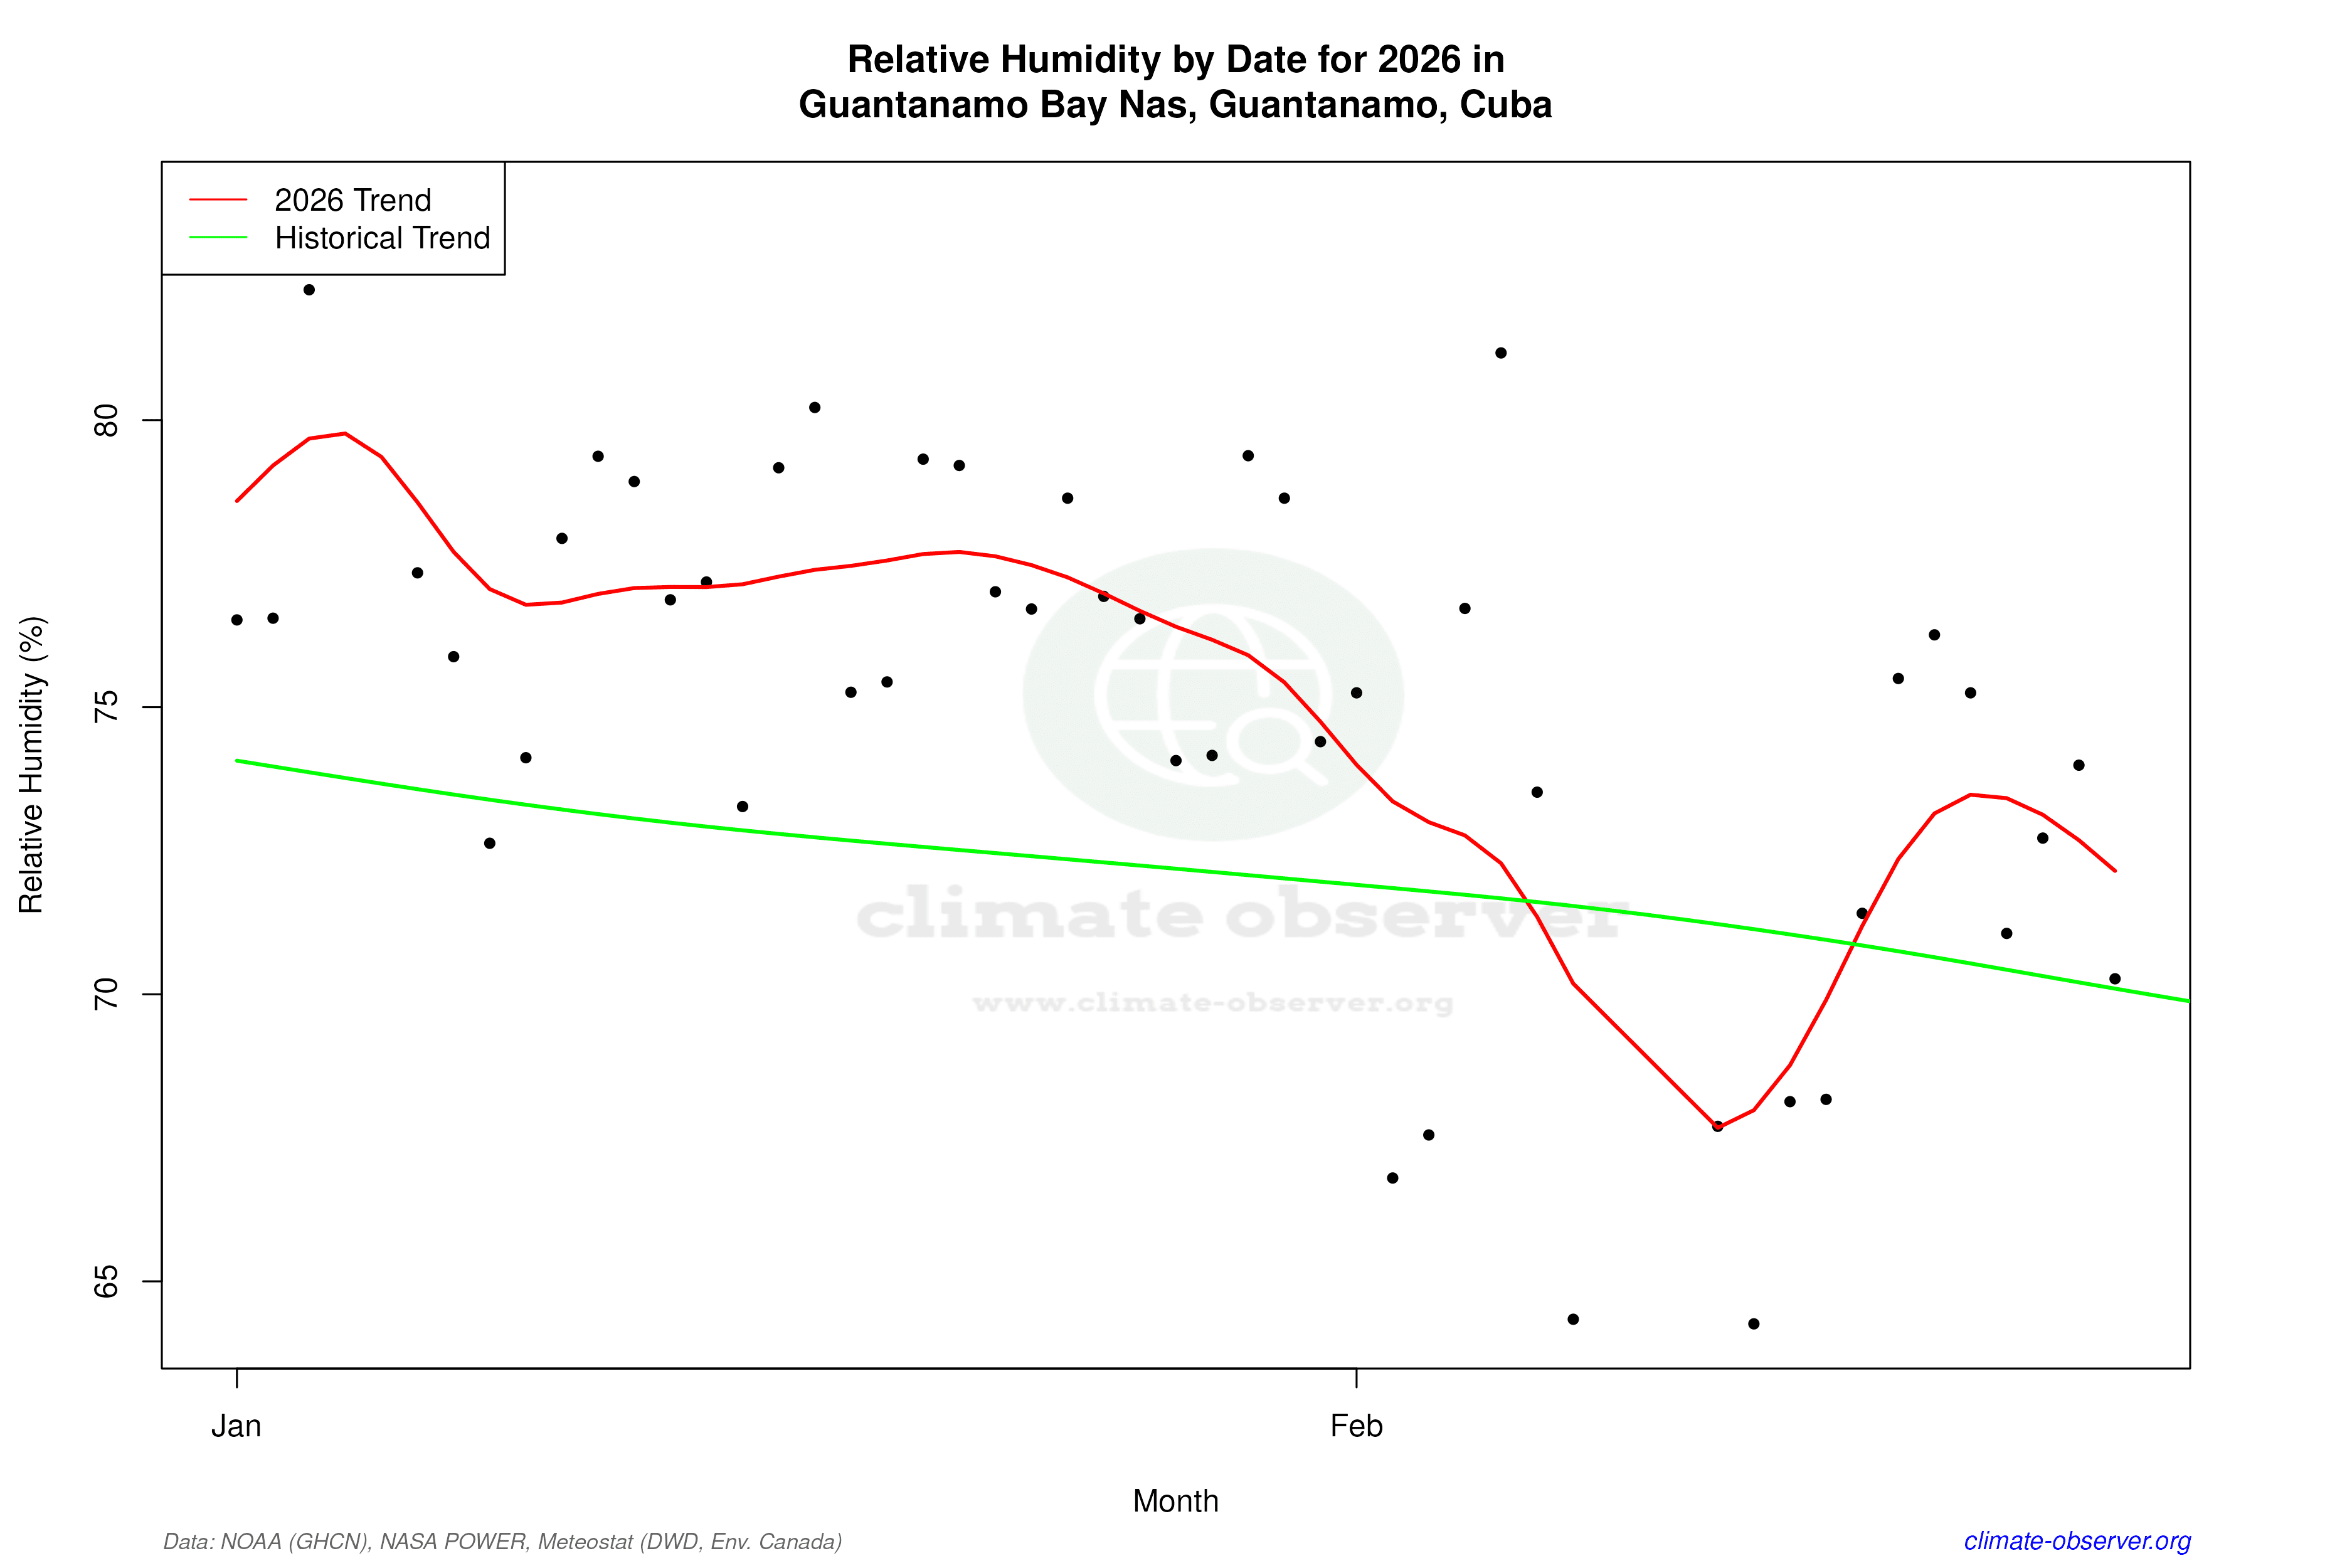

Max Temperature this Year | 1 of 6
Climate 12-Month Moving Averages


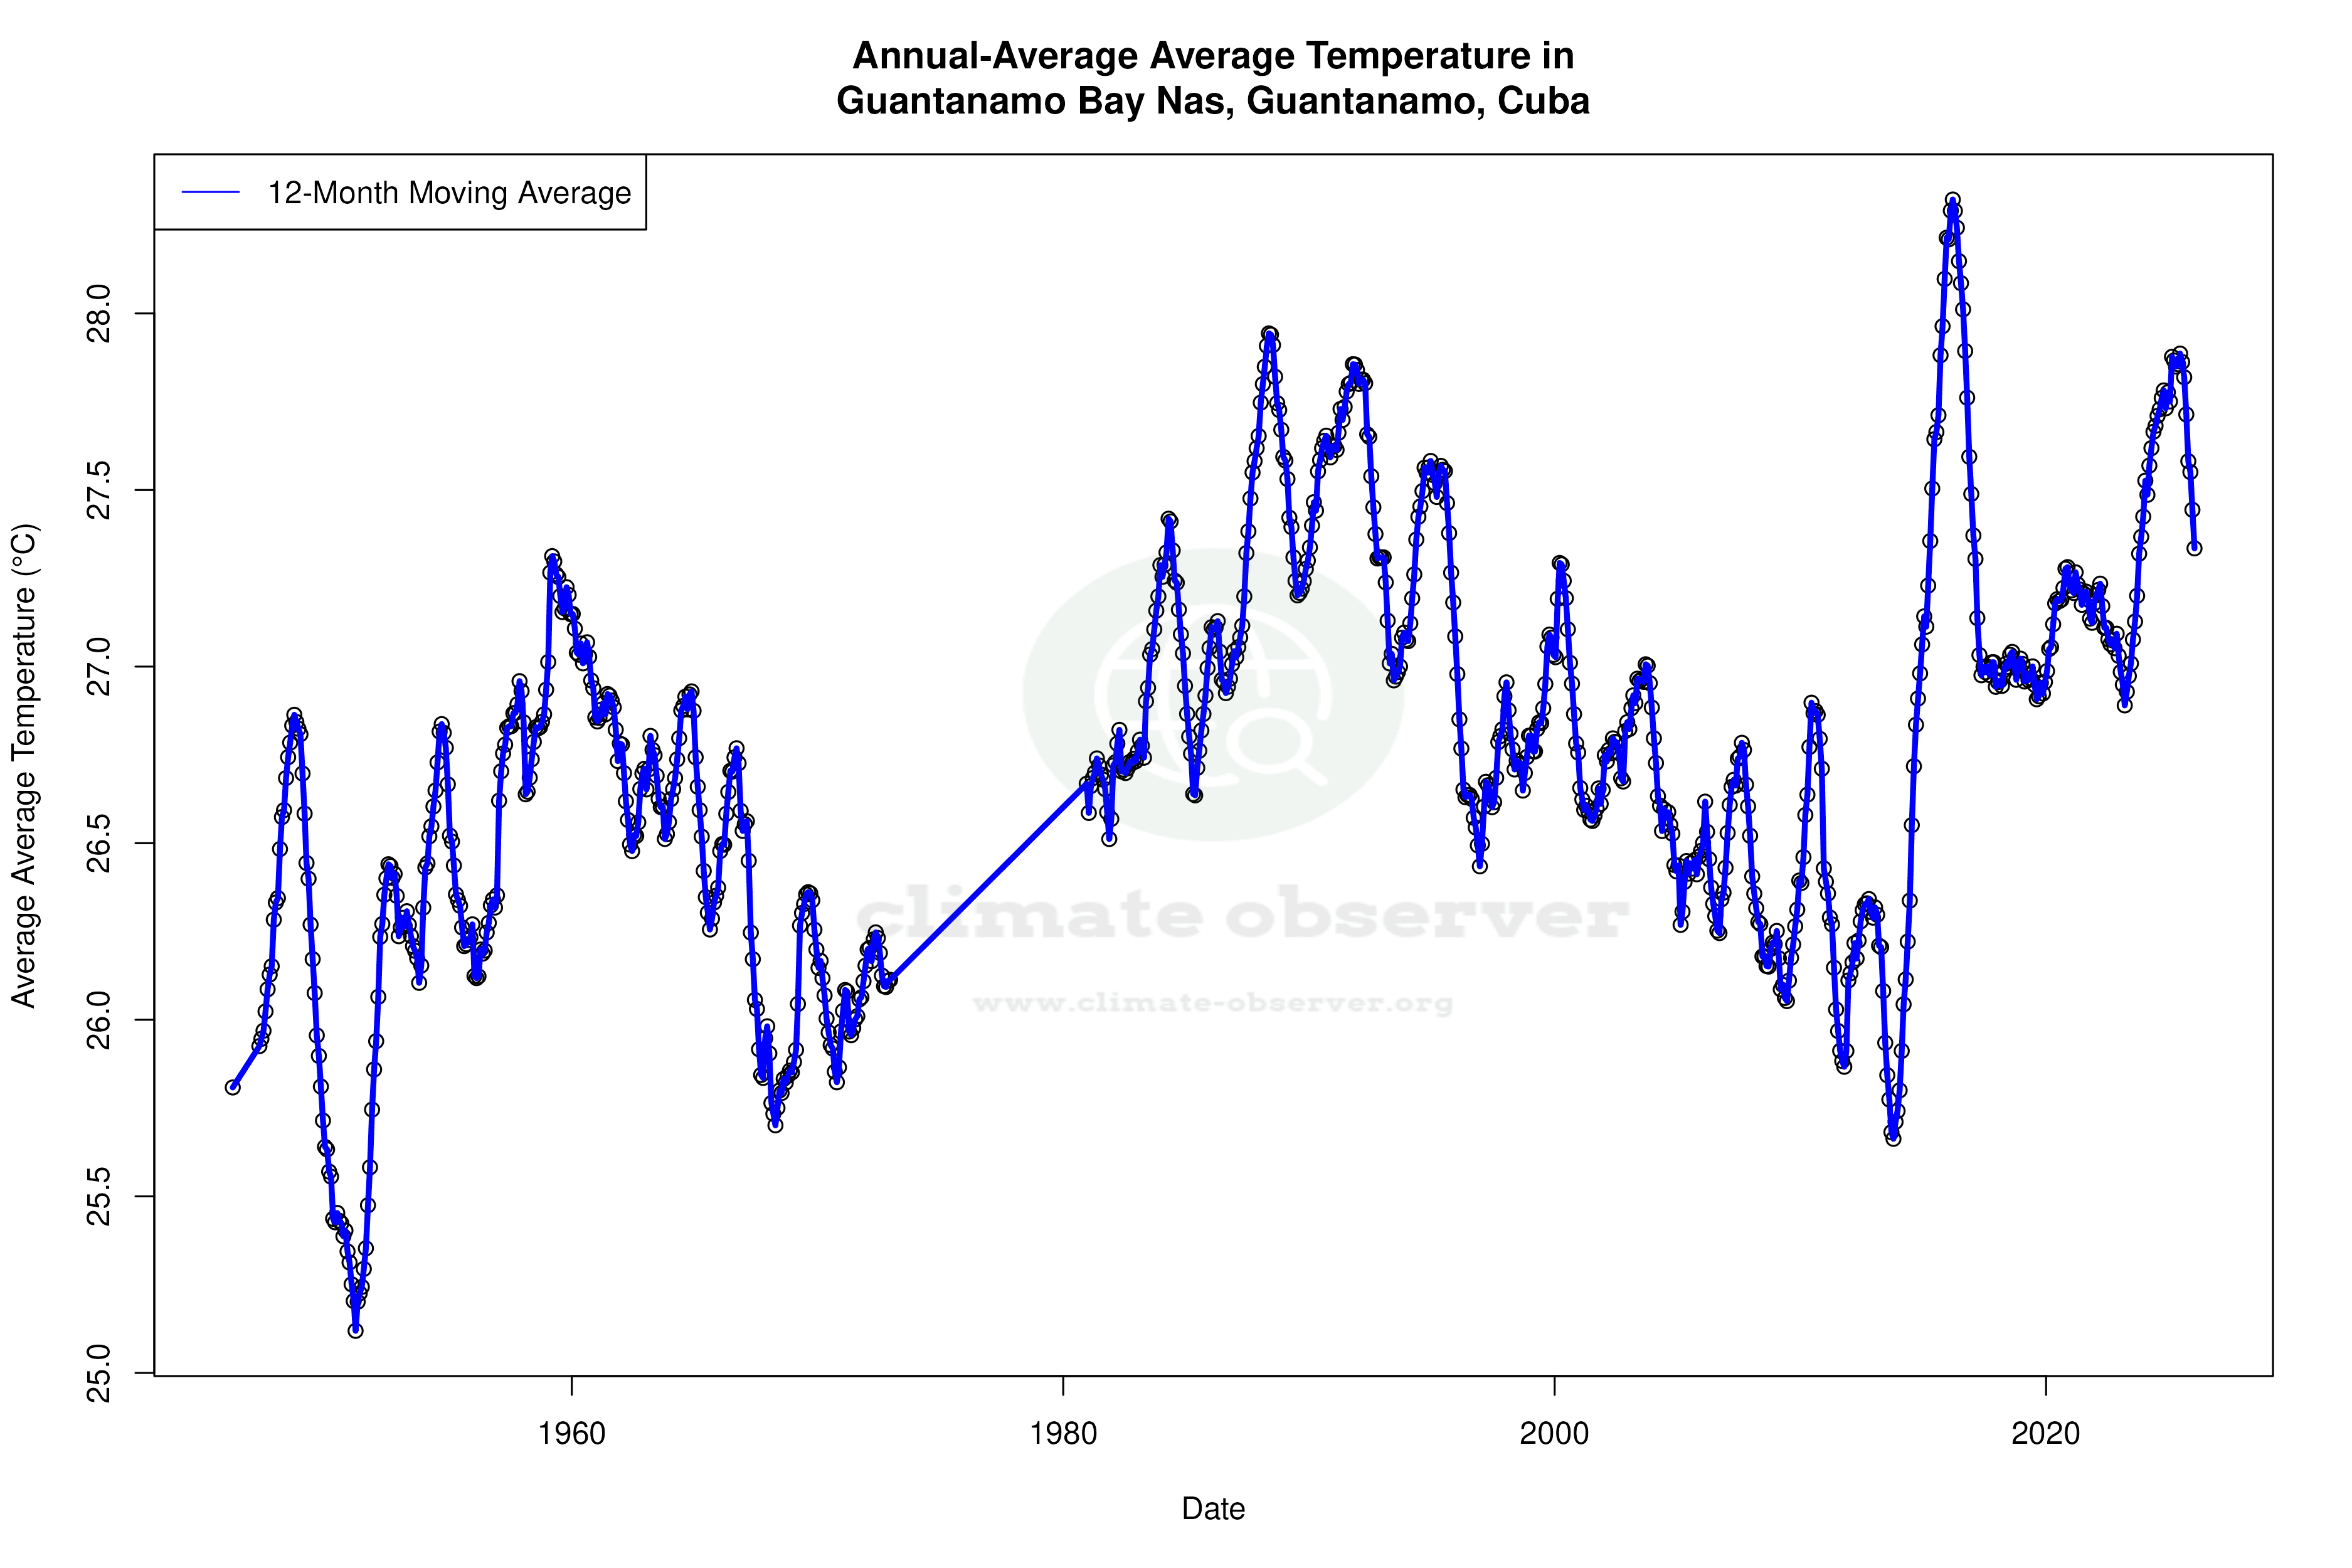

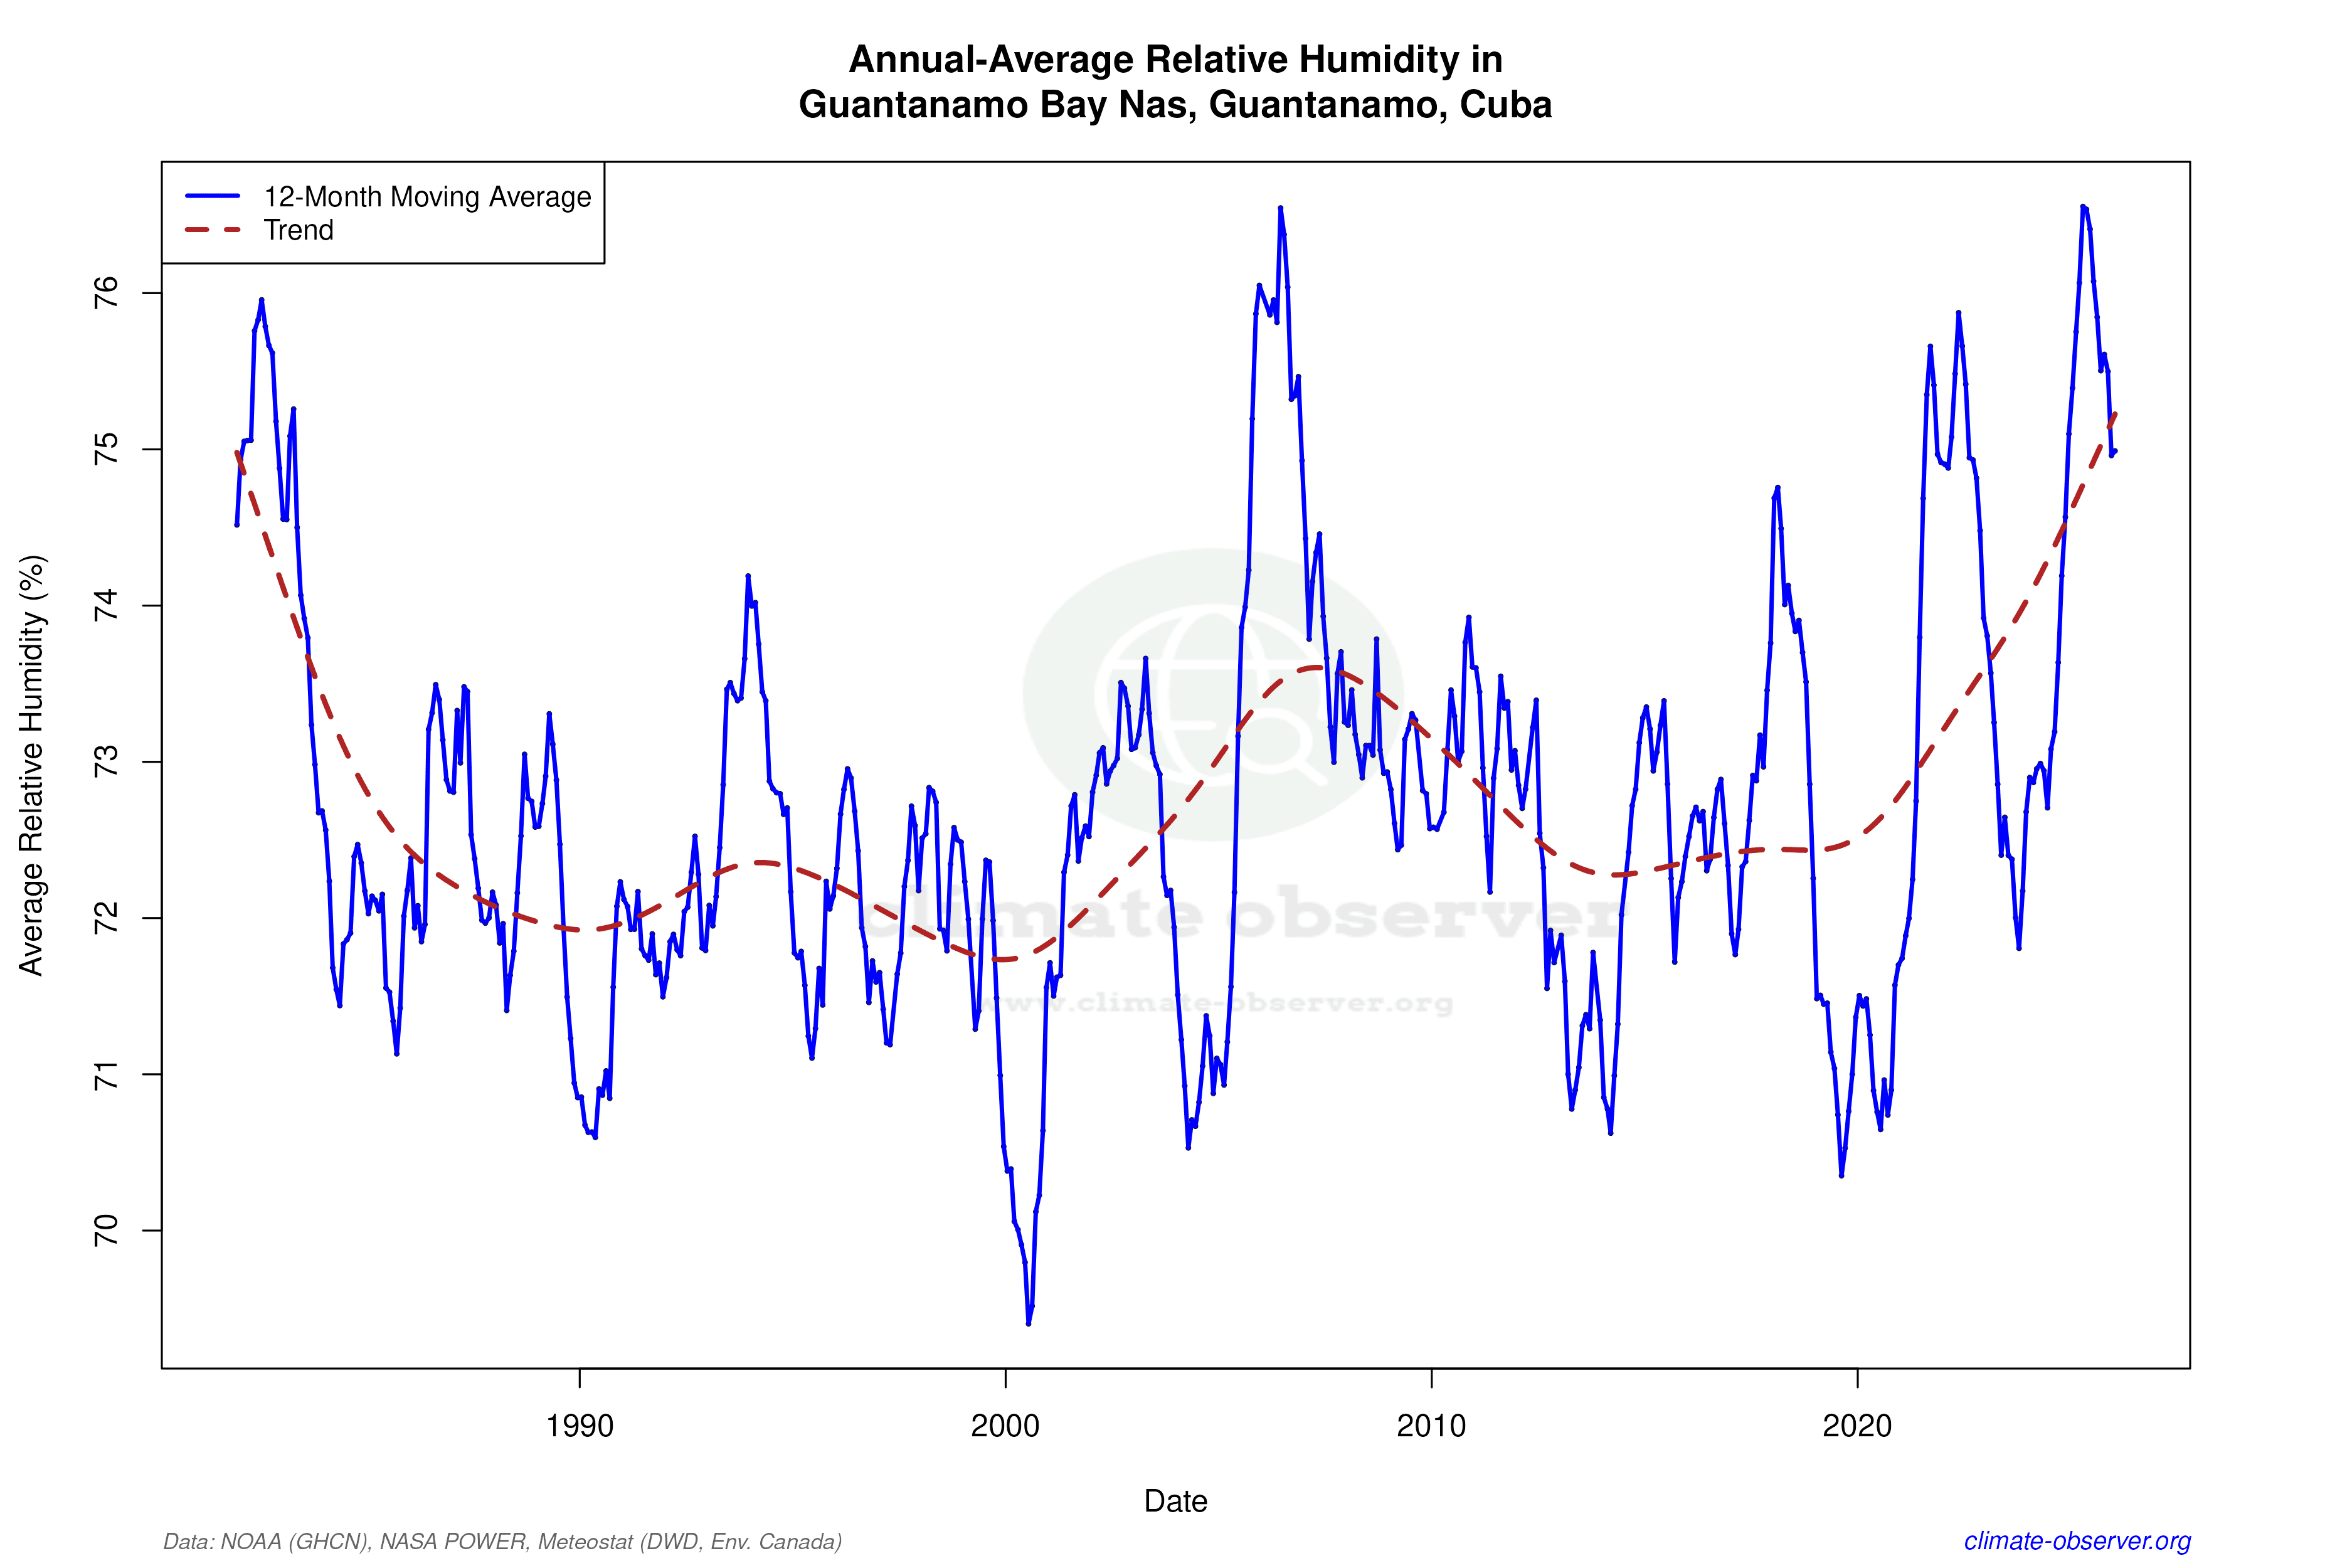

Max Temperature 12-Month MA | 1 of 6
Daily Data Points and Averages Throughout the Year


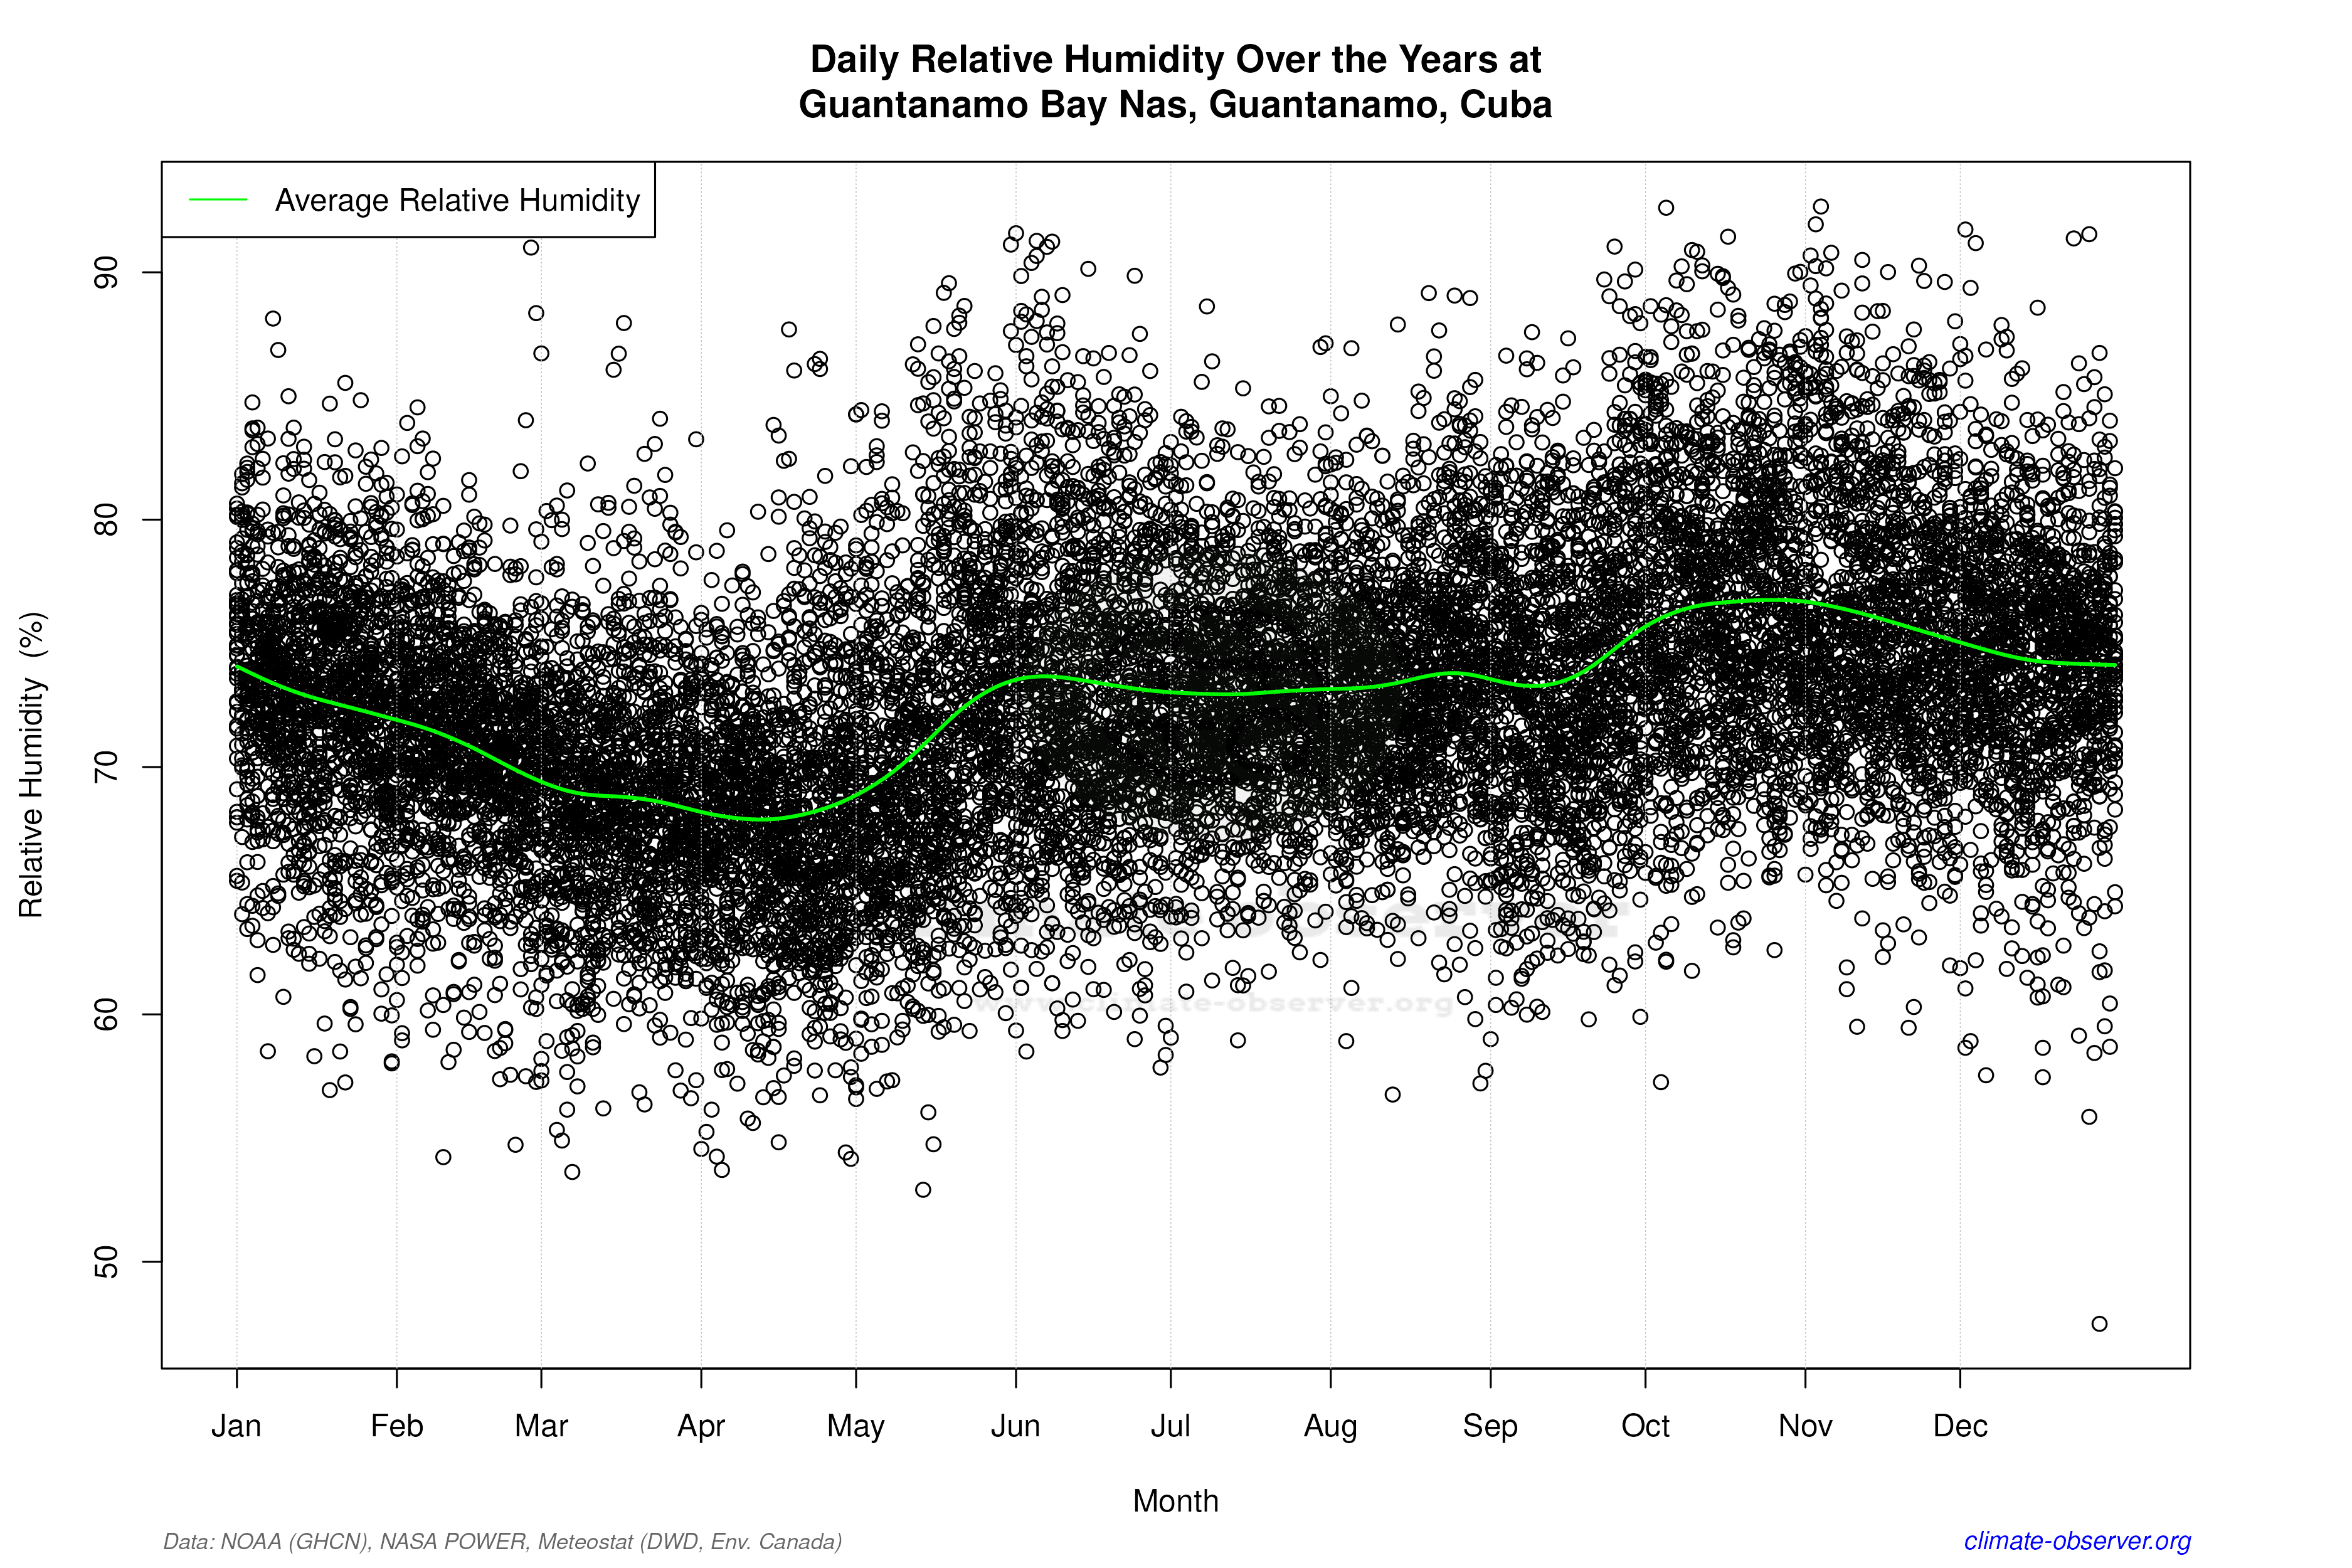

Average Max Temperature Throughout Year | 1 of 5
