Climate for Station: Hammer Odde Fyr-1, Capital Region (Hovedstaden), Denmark
Loading live weather...
Climate Analysis & Overview
Hammer Odde Fyr-1, located on the northern tip of Bornholm, Denmark, is experiencing a warming trend in both high and low temperatures over the past decade, with a more pronounced rise in highs. The Precipitation Concentration Index indicates slightly more even distribution of rainfall, which may have implications for local water management.
Coastal Climate Dynamics
Hammer Odde Fyr-1 is situated in a region classified under the Köppen climate system as Cfb, which denotes a temperate oceanic climate. This classification is characterised by mild temperatures and moderate rainfall, influenced significantly by the surrounding Baltic Sea. The sea acts as a thermal buffer, moderating temperature extremes and contributing to the area's unique climatic patterns.
Temperature Trends: A Decade of Change
Over the past ten years, Hammer Odde Fyr-1 has witnessed a notable warming trend. The high temperatures have increased by 0.98°C (1.76°F), while the lows have risen by 0.59°C (1.06°F). This short-term trend suggests a more pronounced warming in daytime temperatures, which could impact local ecosystems and agriculture. In contrast, the all-time trends reveal a more modest rise, with highs increasing by 0.42°C (0.76°F) and lows by 0.37°C (0.67°F). This long-term data indicates a consistent warming pattern, albeit at a slower rate than recent years.
Record Extremes: The Temperature Bookends
The station has recorded an absolute maximum temperature of 34.1°C (93.4°F) and a minimum of -12.2°C (10.0°F). These extremes highlight the variability within the temperate climate zone, where occasional heatwaves and cold snaps can occur despite the generally moderate conditions. Such records are crucial for understanding the potential range of temperature fluctuations that the region may face.
Precipitation Patterns: A Subtle Shift
The Precipitation Concentration Index (PCI) at Hammer Odde Fyr-1 has decreased slightly from a baseline of 11.5 to a current value of 10.5. This shift towards a more even distribution of rainfall suggests that precipitation events are becoming less concentrated, potentially reducing the risk of flooding and enhancing water availability throughout the year. A PCI under 10 is considered very even, so this slight change may not significantly alter current water management practices but is worth monitoring.
Regional Implications and Considerations
Denmark's commitment to reducing carbon emissions and enhancing climate resilience is particularly relevant in the context of these findings. The warming trends observed at Hammer Odde Fyr-1 could influence local policy decisions, especially in sectors like agriculture and infrastructure, which are sensitive to climatic shifts. Additionally, the more evenly distributed rainfall may offer opportunities for improved agricultural practices and water resource management, aligning with national sustainability goals.
Station Statistics
10-Year Trend
High: +0.64 °C/decade
Low: +0.61 °C/decade
Rain: -0.29 mm/decade
25-Year Trend
High: +0.65 °C/decade
Low: +0.47 °C/decade
Rain: -0.12 mm/decade
50-Year Trend
High: +0.53 °C/decade
Low: +0.46 °C/decade
Rain: +0.01 mm/decade
All-Time Trend
High: +0.41 °C/decade
Low: +0.37 °C/decade
Rain: +0.01 mm/decade
Percentage Above-Average Days
Last 12 Months: 47.4%
This Year: 29.4%
Precipitation Concentration Index (PCI) ℹ️
Last 12 Months: 9.8
Historical Average: 11.4
Percentile Rank of Last 12 Months ℹ️
High: 89th percentile
Low: 95th percentile
Rain: 1st percentile
Change in Variance ℹ️
High: +0.6%
Low: -6.3%
Intraday: +3.9%
Data Coverage
86.3%
First Year of Data
1960
Station Location
Historical Weather Records
| Max High | Avg High | Min High | Max Avg | Avg Avg | Min Avg | Max Low | Avg Low | Min Low | Max Precipitation | Avg Precipitation | Max Snow | Avg Snow | |
|---|---|---|---|---|---|---|---|---|---|---|---|---|---|
| Record | 34.1 °C | — | -7.7 °C | 26.6 °C | — | -9.5 °C | 21.7 °C | — | -12.2 °C | 74.4 mm | — | — | — |
| January | 11.3 °C | 3.3 °C | -7.7 °C | 9.4 °C | 1.8 °C | -8.7 °C | 7.1 °C | 0.2 °C | -12.2 °C | 24.1 mm | 1.6 mm | — | — |
| February | 14.9 °C | 3.0 °C | -7.3 °C | 10.7 °C | 1.4 °C | -9.5 °C | 8.1 °C | -0.2 °C | -11.9 °C | 20.0 mm | 1.3 mm | — | — |
| March | 18.3 °C | 4.8 °C | -7.5 °C | 13.1 °C | 2.8 °C | -8.5 °C | 9.8 °C | 0.9 °C | -10.8 °C | 19.2 mm | 1.1 mm | — | — |
| April | 23.5 °C | 8.3 °C | 0.2 °C | 17.4 °C | 5.5 °C | -1.1 °C | 10.1 °C | 3.3 °C | -3.5 °C | 29.2 mm | 1.0 mm | — | — |
| May | 28.0 °C | 13.0 °C | 2.2 °C | 21.1 °C | 10.0 °C | 1.1 °C | 15.4 °C | 7.4 °C | -2.0 °C | 42.2 mm | 1.1 mm | — | — |
| June | 30.6 °C | 17.4 °C | 8.7 °C | 24.6 °C | 14.5 °C | 6.8 °C | 20.9 °C | 11.9 °C | 3.7 °C | 36.0 mm | 1.3 mm | — | — |
| July | 34.1 °C | 19.9 °C | 12.6 °C | 26.5 °C | 17.2 °C | 11.9 °C | 21.5 °C | 14.8 °C | 9.2 °C | 54.8 mm | 1.7 mm | — | — |
| August | 33.6 °C | 20.1 °C | 13.3 °C | 26.6 °C | 17.5 °C | 11.9 °C | 21.7 °C | 15.3 °C | 7.8 °C | 74.4 mm | 1.8 mm | — | — |
| September | 27.0 °C | 16.6 °C | 9.5 °C | 23.3 °C | 14.5 °C | 7.9 °C | 20.4 °C | 12.5 °C | 5.0 °C | 41.0 mm | 1.8 mm | — | — |
| October | 23.4 °C | 12.1 °C | 4.0 °C | 19.3 °C | 10.6 °C | 2.7 °C | 16.1 °C | 8.7 °C | -0.2 °C | 39.6 mm | 1.8 mm | — | — |
| November | 17.1 °C | 7.9 °C | -1.2 °C | 15.2 °C | 6.5 °C | -2.2 °C | 12.7 °C | 4.8 °C | -3.7 °C | 29.5 mm | 2.0 mm | — | — |
| December | 12.6 °C | 5.0 °C | -6.7 °C | 9.8 °C | 3.5 °C | -7.4 °C | 8.9 °C | 1.9 °C | -9.6 °C | 26.7 mm | 1.8 mm | — | — |
Data Visualisations
Remove WatermarksCurrent Year Climate Trends vs Historical
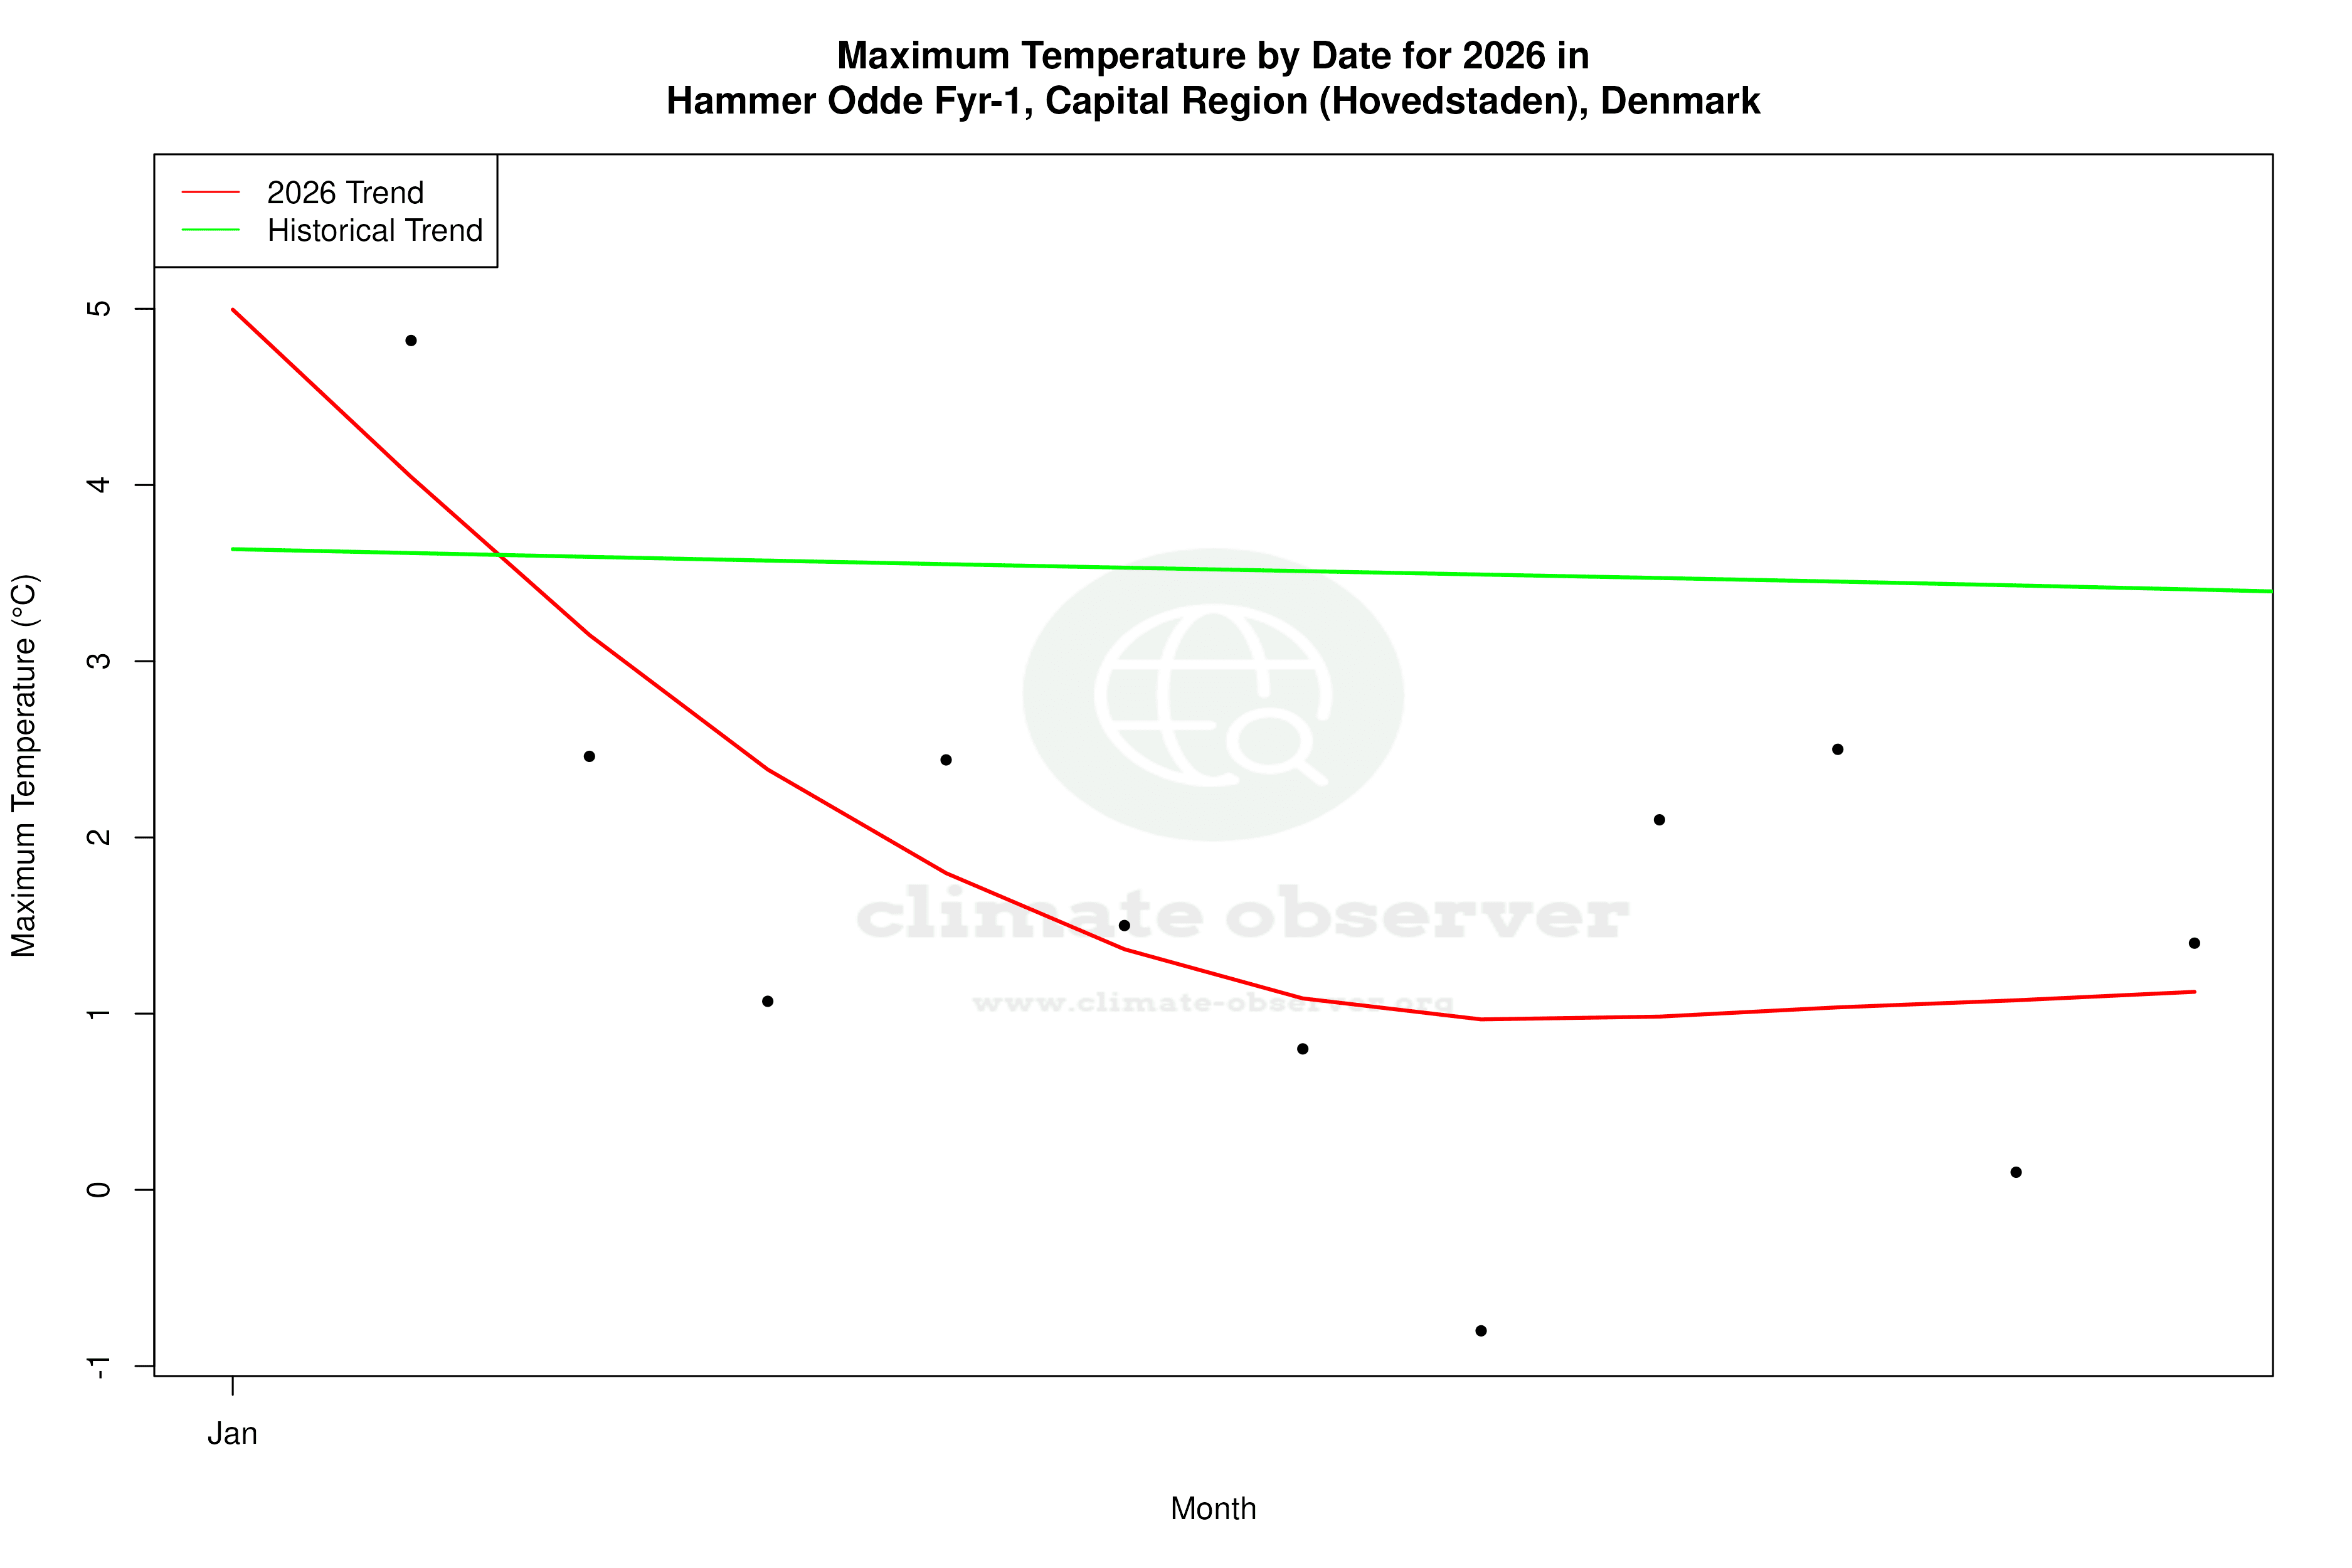


Max Temperature this Year | 1 of 6
Climate 12-Month Moving Averages


Max Temperature 12-Month MA | 1 of 6
Daily Data Points and Averages Throughout the Year


Average Max Temperature Throughout Year | 1 of 5
