Climate for Station: Maria Montez Intl, Barahona, Dominican Republic
Loading live weather...
Climate Analysis & Overview
Aeropuerto Internacional María Montez, located in the Dominican Republic, is experiencing a notable warming trend, with both high and low temperatures increasing over the past decade. The region's precipitation pattern has become slightly more evenly distributed, suggesting a subtle shift in rainfall events.
Warming Trends in the Tropics
Situated at coordinates 18.251, -71.12, Aeropuerto Internacional María Montez lies within the tropical savanna climate zone, characterised by a distinct wet and dry season. Over the past decade, the station has observed a warming trend, with high temperatures rising by 0.96°C (1.73°F) and low temperatures by 0.84°C (1.51°F). These changes are more pronounced than the all-time trends, which show a rise in highs of 0.49°C (0.88°F) and lows of 0.13°C (0.23°F). This suggests an acceleration in warming over recent years, aligning with broader regional climate goals to monitor and adapt to such changes.
Temperature Extremes and Records
The station has recorded an absolute maximum temperature of 39.0°C (102.2°F) and a minimum of 14.0°C (57.2°F). These figures highlight the potential for significant thermal variability within the tropical climate, influenced by geographical features such as the nearby Caribbean Sea and the mountainous terrain of the Dominican Republic, which can modulate local temperature extremes.
Precipitation Patterns and Distribution
The Precipitation Concentration Index (PCI) at this location has shown a slight decrease from a baseline of 15.6 to a current value of 14.4. The PCI is a measure of how rainfall is distributed over time; a decrease indicates that precipitation is becoming more evenly distributed, rather than concentrated in intense events. This slight change suggests a subtle shift towards a more balanced rainfall pattern, which could have implications for local agriculture and water resource management.
Interpreting the Data in Context
The warming trends observed at Aeropuerto Internacional María Montez are consistent with global climate patterns, where tropical regions are experiencing rising temperatures. The Dominican Republic's climate policies aim to address these changes through sustainable practices and adaptation strategies. The slight decrease in PCI may offer some resilience against extreme weather events, which are becoming more frequent due to climate change.
Regional Implications and Future Outlook
As the Dominican Republic navigates the challenges of climate change, the data from Aeropuerto Internacional María Montez provides valuable insights into local climate dynamics. The warming trends and evolving precipitation patterns underscore the importance of continued monitoring and adaptation to ensure the resilience of ecosystems and communities in the region.
Station Statistics
10-Year Trend
High: +0.60 °C/decade
Low: +0.88 °C/decade
Rain: +1.15 mm/decade
25-Year Trend
High: +0.45 °C/decade
Low: +0.24 °C/decade
Rain: +0.35 mm/decade
50-Year Trend
High: +0.50 °C/decade
Low: +0.13 °C/decade
Rain: +0.23 mm/decade
All-Time Trend
High: +0.47 °C/decade
Low: +0.14 °C/decade
Rain: +0.23 mm/decade
Percentage Above-Average Days
Last 12 Months: 32.3%
This Year: 29.6%
Precipitation Concentration Index (PCI) ℹ️
Last 12 Months: 19.6
Historical Average: 14.9
Percentile Rank of Last 12 Months ℹ️
High: 70th percentile
Low: 98th percentile
Rain: 84th percentile
Change in Variance ℹ️
High: +3.3%
Low: +27.0%
Intraday: +6.0%
Data Coverage
93.9%
First Year of Data
1973
Station Location
Historical Weather Records
| Max High | Avg High | Min High | Max Avg | Avg Avg | Min Avg | Max Low | Avg Low | Min Low | Max Precipitation | Avg Precipitation | Max Snow | Avg Snow | |
|---|---|---|---|---|---|---|---|---|---|---|---|---|---|
| Record | 39.0 °C | — | 23.5 °C | 34.5 °C | — | 20.3 °C | 28.5 °C | — | 14.0 °C | 392.9 mm | — | — | — |
| January | 36.0 °C | 30.0 °C | 24.4 °C | 29.5 °C | 25.7 °C | 20.8 °C | 25.0 °C | 19.8 °C | 15.1 °C | 40.1 mm | 1.0 mm | — | — |
| February | 34.0 °C | 30.2 °C | 26.1 °C | 29.7 °C | 26.0 °C | 20.4 °C | 24.8 °C | 20.0 °C | 14.0 °C | 40.1 mm | 0.8 mm | — | — |
| March | 34.9 °C | 30.4 °C | 25.5 °C | 30.7 °C | 26.5 °C | 21.0 °C | 25.8 °C | 20.9 °C | 15.0 °C | 87.4 mm | 1.4 mm | — | — |
| April | 35.2 °C | 31.0 °C | 25.5 °C | 31.2 °C | 27.2 °C | 22.4 °C | 26.5 °C | 22.1 °C | 17.0 °C | 73.4 mm | 2.2 mm | — | — |
| May | 37.2 °C | 31.0 °C | 24.1 °C | 31.4 °C | 27.6 °C | 22.8 °C | 27.2 °C | 22.9 °C | 19.0 °C | 124.7 mm | 3.6 mm | — | — |
| June | 36.2 °C | 31.3 °C | 23.9 °C | 32.7 °C | 28.2 °C | 22.5 °C | 28.5 °C | 23.5 °C | 18.0 °C | 392.9 mm | 3.2 mm | — | — |
| July | 38.0 °C | 32.3 °C | 25.1 °C | 34.5 °C | 28.9 °C | 23.2 °C | 27.6 °C | 23.7 °C | 19.0 °C | 96.5 mm | 1.9 mm | — | — |
| August | 38.4 °C | 32.6 °C | 25.1 °C | 33.6 °C | 29.0 °C | 23.0 °C | 27.6 °C | 23.7 °C | 20.0 °C | 191.8 mm | 3.4 mm | — | — |
| September | 39.0 °C | 32.2 °C | 25.4 °C | 34.1 °C | 28.5 °C | 23.1 °C | 27.0 °C | 23.4 °C | 19.0 °C | 89.2 mm | 2.9 mm | — | — |
| October | 38.0 °C | 31.4 °C | 24.6 °C | 32.7 °C | 27.9 °C | 23.1 °C | 27.0 °C | 22.9 °C | 18.5 °C | 129.8 mm | 3.8 mm | — | — |
| November | 37.0 °C | 31.0 °C | 23.5 °C | 30.9 °C | 27.1 °C | 21.8 °C | 26.0 °C | 21.8 °C | 17.0 °C | 105.2 mm | 2.3 mm | — | — |
| December | 35.0 °C | 30.4 °C | 24.4 °C | 30.2 °C | 26.2 °C | 20.3 °C | 25.8 °C | 20.3 °C | 15.9 °C | 61.7 mm | 1.0 mm | — | — |
Data Visualisations
Remove WatermarksCurrent Year Climate Trends vs Historical


Max Temperature this Year | 1 of 6
Climate 12-Month Moving Averages


Max Temperature 12-Month MA | 1 of 6
Daily Data Points and Averages Throughout the Year


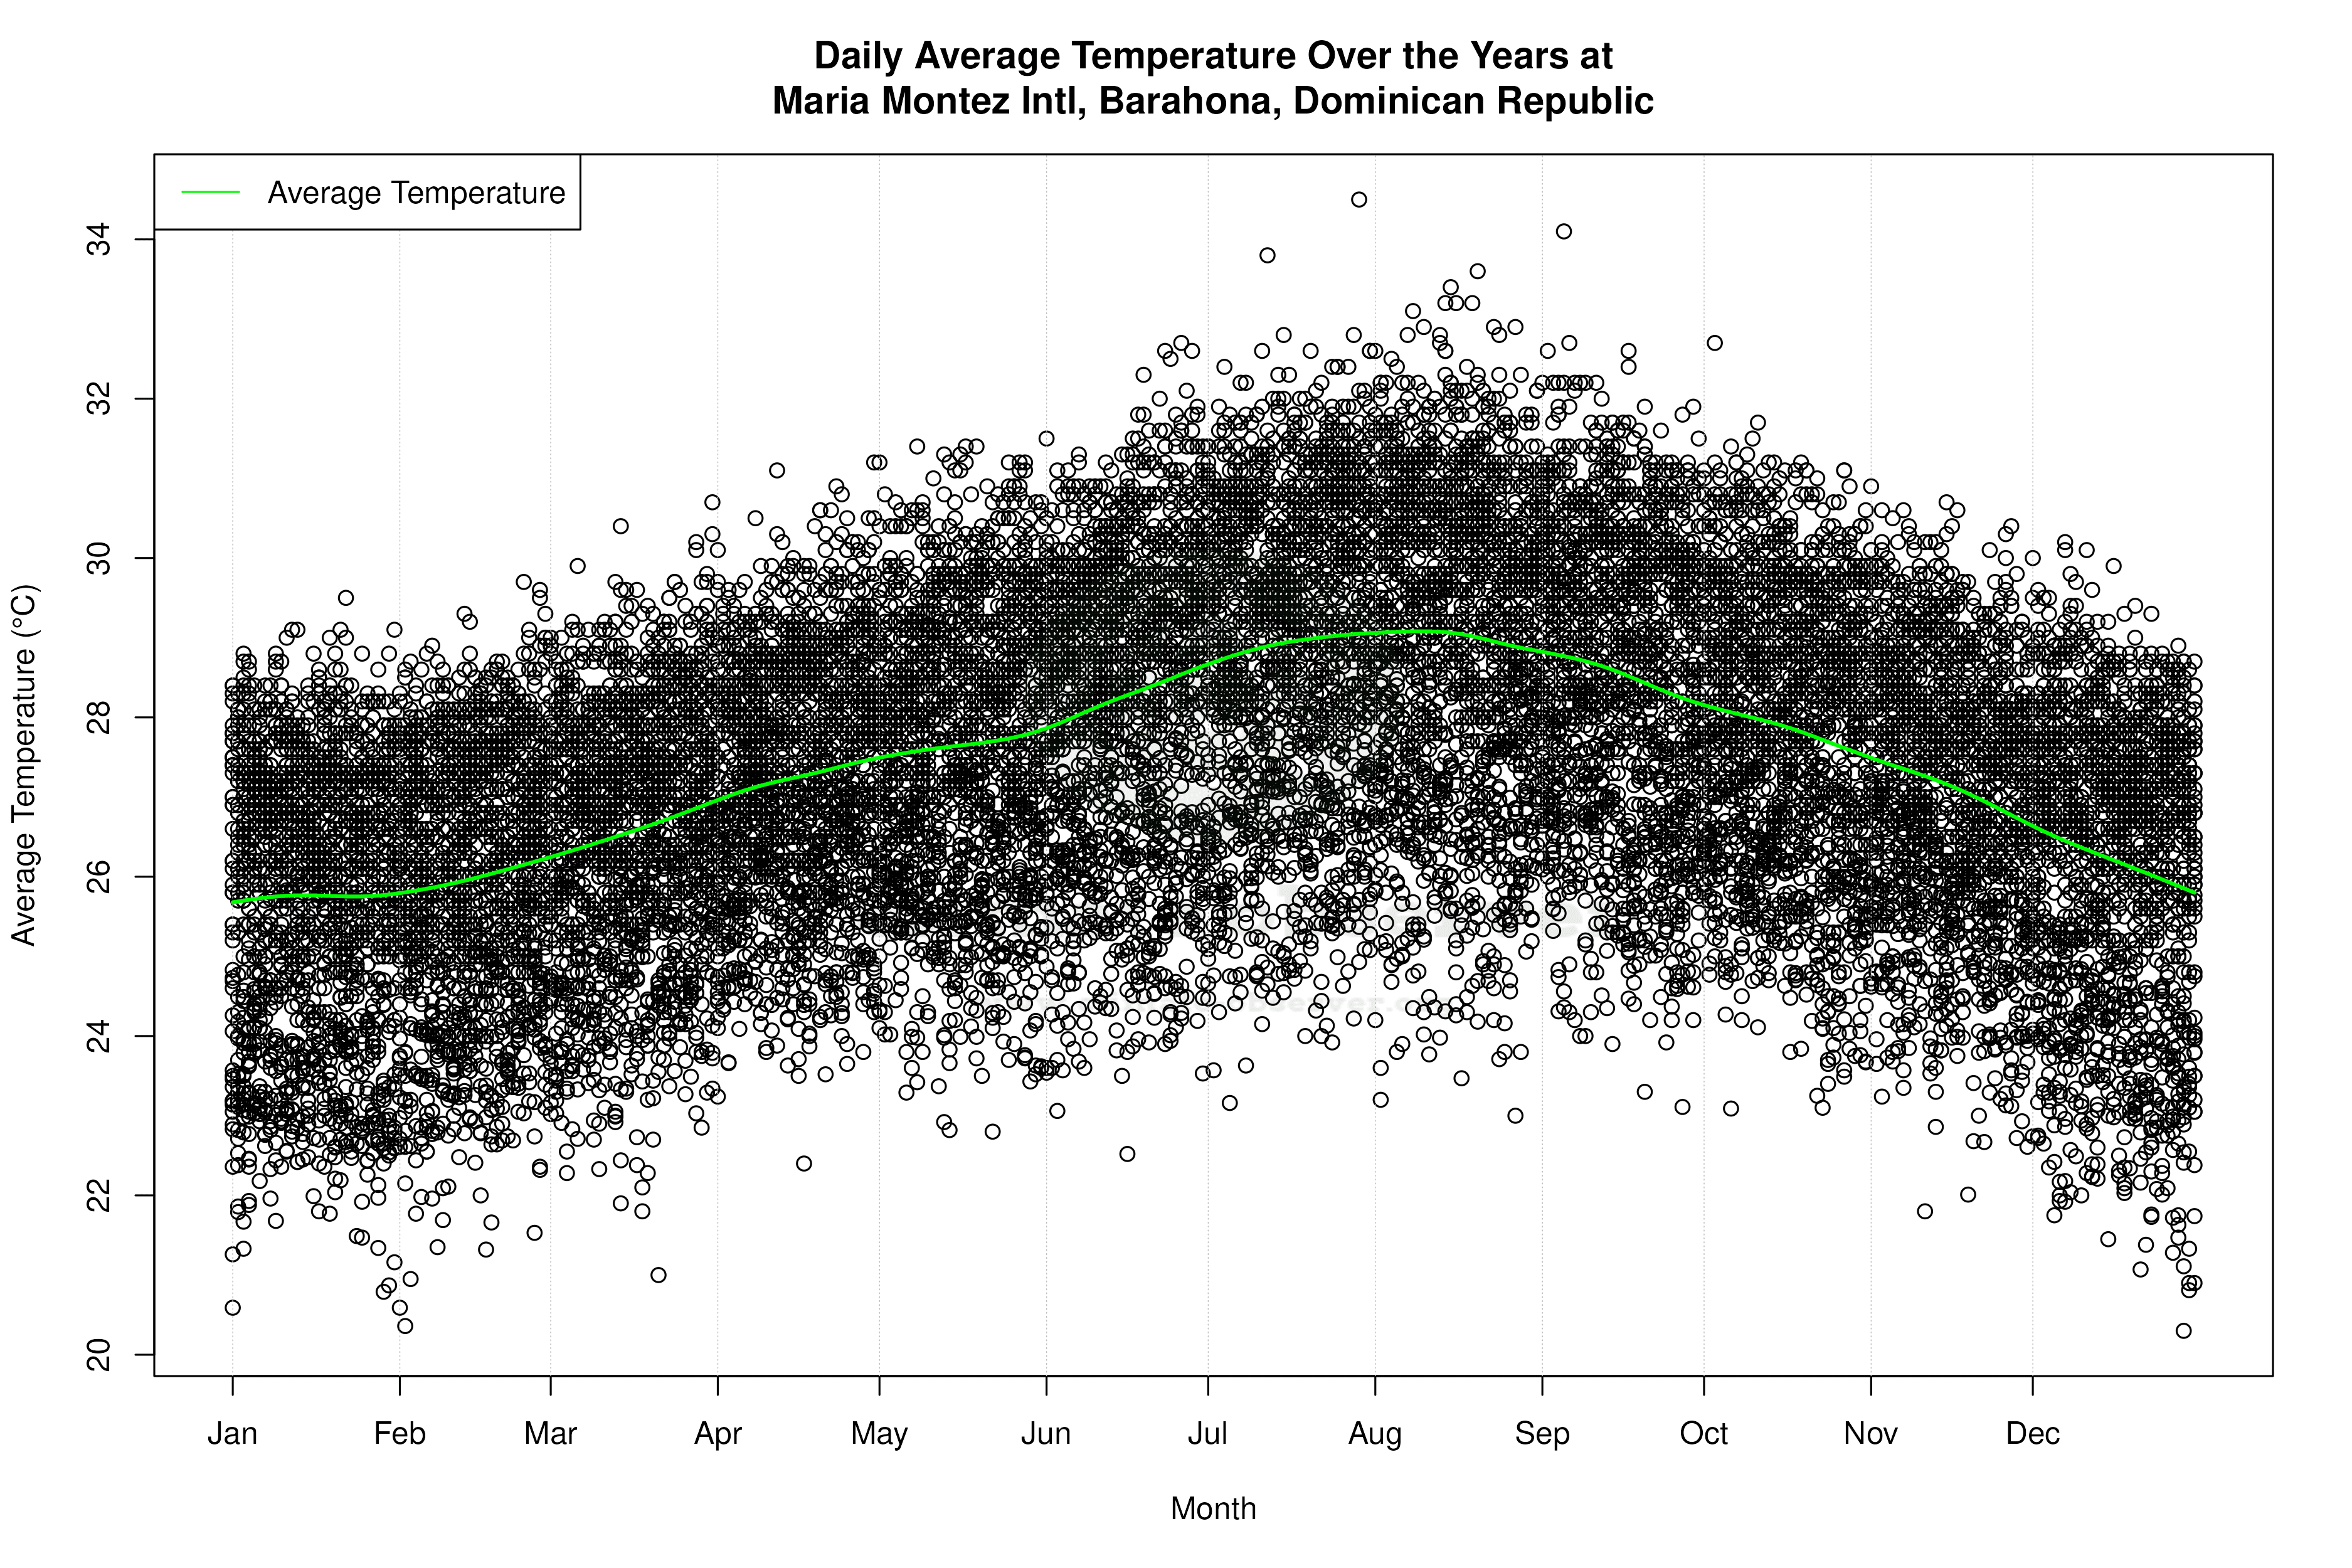

Average Max Temperature Throughout Year | 1 of 5
