Climate for Station: Santo Domingo, Distrito Nacional, Dominican Republic
Loading live weather...
Climate Analysis & Overview
Santo Domingo's climate is experiencing a noticeable warming trend, with highs increasing by 0.24°C (0.43°F) over the long term and lows by 0.34°C (0.61°F). Recent data shows a more rapid rise, particularly in nighttime temperatures. Precipitation patterns have become slightly more even, suggesting a shift in rainfall distribution.
Tropical Warmth and Urban Influence
Santo Domingo, located at 18.433°N, -69.883°W, sits within a tropical rainforest climate zone according to the Köppen classification. This classification is characterized by consistently high temperatures and significant rainfall throughout the year. The city's proximity to the Caribbean Sea moderates its climate, while urbanisation in the Zona Colonial area can exacerbate heat retention, especially during the night. Over the past decade, the city has experienced a significant warming trend, with average high temperatures increasing by 0.73°C (1.31°F) and lows by 0.97°C (1.75°F). This rapid rise in nighttime temperatures is particularly concerning, as it can affect energy consumption and public health.
Long-term Warming Trends
Examining the all-time data trends, Santo Domingo's climate shows a gradual warming pattern. High temperatures have risen by 0.24°C (0.43°F), while lows have increased by 0.34°C (0.61°F). This warming trend aligns with broader regional climate patterns observed across the Caribbean, where rising sea surface temperatures contribute to warmer air temperatures. The Dominican Republic has been actively working towards regional climate goals, aiming to mitigate these warming effects through sustainable practices and renewable energy initiatives.
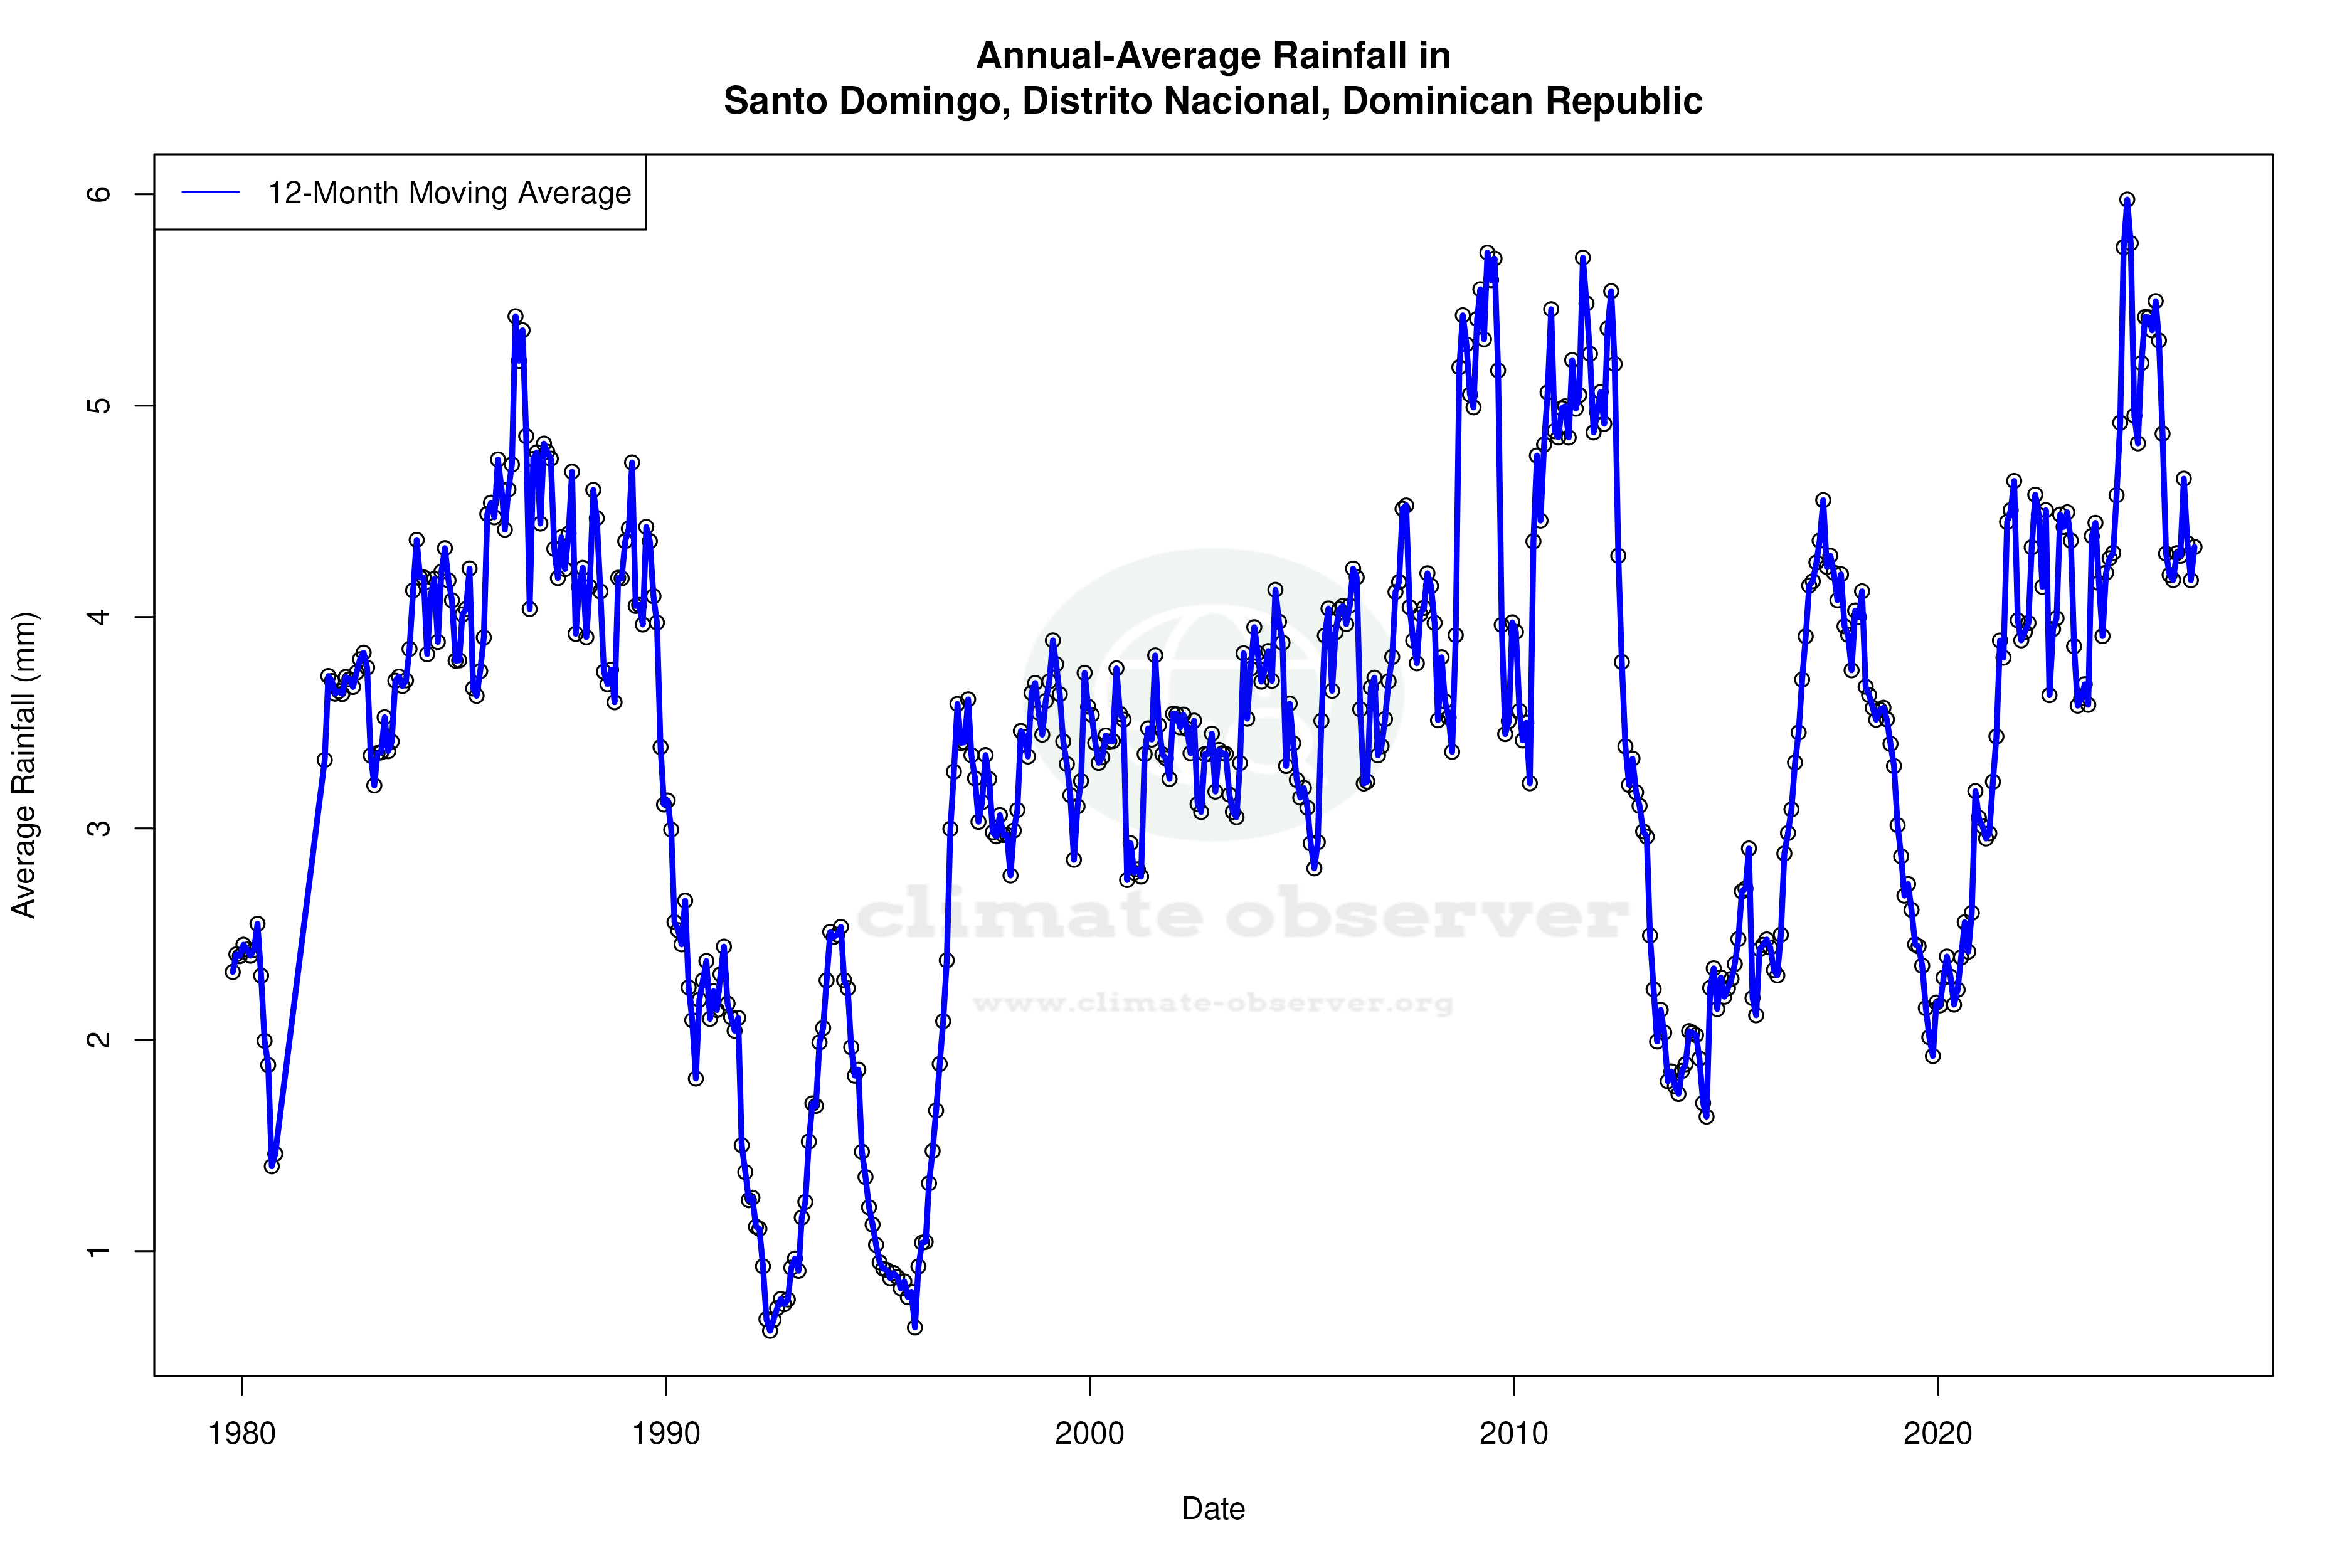
Precipitation Patterns and Shifts
The Precipitation Concentration Index (PCI) for Santo Domingo has decreased from a baseline of 13.72 to a current value of 12.44. This indicates a slight shift towards more evenly distributed rainfall events throughout the year. While the PCI value remains above 10, suggesting some concentration of precipitation, the trend towards even distribution could lead to more reliable water resources and reduced flood risks during extreme weather events.
Temperature Extremes and Records
The city has recorded an absolute maximum temperature of 37.8°C (100.0°F) and a minimum of 10.4°C (50.7°F). These extremes highlight the potential for significant thermal variability within a tropical climate, influenced by both natural and anthropogenic factors. The increasing frequency of extreme heat events poses challenges for urban planning and infrastructure resilience, particularly in densely populated areas like Santo Domingo.
Adapting to a Changing Climate
As Santo Domingo continues to experience these climatic changes, local authorities and communities must adapt to mitigate potential impacts. This includes enhancing green spaces to combat urban heat, improving water management systems to handle shifting precipitation patterns, and investing in climate-resilient infrastructure. The city's efforts to align with national and regional climate goals will be crucial in ensuring a sustainable and resilient future for its residents.
Station Statistics
10-Year Trend
High: +0.73 °C/decade
Low: +0.97 °C/decade
Rain: +1.68 mm/decade
25-Year Trend
High: +0.48 °C/decade
Low: +0.68 °C/decade
Rain: +0.14 mm/decade
50-Year Trend
High: +0.36 °C/decade
Low: +0.47 °C/decade
Rain: +0.20 mm/decade
All-Time Trend
High: +0.20 °C/decade
Low: +0.34 °C/decade
Rain: +0.20 mm/decade
Percentage Above-Average Days
Last 12 Months: 62.2%
This Year: 7.5%
Precipitation Concentration Index (PCI) ℹ️
Last 12 Months: 11.6
Historical Average: 13.9
Percentile Rank of Last 12 Months ℹ️
High: 93rd percentile
Low: 95th percentile
Rain: 89th percentile
Change in Variance ℹ️
High: +24.0%
Low: -20.7%
Intraday: -19.9%
Data Coverage
68.2%
First Year of Data
1947
Station Location
Historical Weather Records
| Max High | Avg High | Min High | Max Avg | Avg Avg | Min Avg | Max Low | Avg Low | Min Low | Max Precipitation | Avg Precipitation | Max Snow | Avg Snow | |
|---|---|---|---|---|---|---|---|---|---|---|---|---|---|
| Record | 38.8 °C | — | 23.3 °C | 31.4 °C | — | 19.2 °C | 28.0 °C | — | 13.0 °C | 359.9 mm | — | — | — |
| January | 34.4 °C | 29.9 °C | 23.3 °C | 28.0 °C | 24.5 °C | 20.3 °C | 24.0 °C | 20.4 °C | 14.0 °C | 66.9 mm | 1.9 mm | — | — |
| February | 33.9 °C | 30.0 °C | 25.3 °C | 28.2 °C | 24.6 °C | 19.2 °C | 25.9 °C | 20.4 °C | 13.0 °C | 58.7 mm | 1.8 mm | — | — |
| March | 36.0 °C | 30.5 °C | 26.0 °C | 31.0 °C | 25.2 °C | 20.7 °C | 25.5 °C | 20.9 °C | 13.3 °C | 138.9 mm | 2.0 mm | — | — |
| April | 37.0 °C | 31.0 °C | 26.7 °C | 29.8 °C | 26.0 °C | 21.7 °C | 26.6 °C | 21.9 °C | 15.5 °C | 91.9 mm | 2.7 mm | — | — |
| May | 35.5 °C | 31.2 °C | 26.1 °C | 30.7 °C | 26.6 °C | 21.3 °C | 27.0 °C | 22.9 °C | 16.5 °C | 359.9 mm | 4.8 mm | — | — |
| June | 37.2 °C | 31.7 °C | 24.9 °C | 31.4 °C | 27.3 °C | 22.4 °C | 28.0 °C | 23.7 °C | 18.6 °C | 92.7 mm | 3.8 mm | — | — |
| July | 37.8 °C | 32.1 °C | 26.0 °C | 31.2 °C | 27.4 °C | 22.1 °C | 27.6 °C | 23.7 °C | 18.2 °C | 111.0 mm | 4.0 mm | — | — |
| August | 38.8 °C | 32.3 °C | 26.0 °C | 30.8 °C | 27.4 °C | 23.6 °C | 27.6 °C | 23.8 °C | 18.0 °C | 179.6 mm | 5.1 mm | — | — |
| September | 37.7 °C | 32.2 °C | 25.8 °C | 30.8 °C | 27.4 °C | 22.2 °C | 27.8 °C | 23.8 °C | 18.0 °C | 130.3 mm | 4.8 mm | — | — |
| October | 38.8 °C | 31.9 °C | 25.4 °C | 30.7 °C | 27.0 °C | 22.9 °C | 28.0 °C | 23.4 °C | 17.0 °C | 111.3 mm | 4.7 mm | — | — |
| November | 37.0 °C | 31.1 °C | 25.6 °C | 30.1 °C | 25.9 °C | 22.4 °C | 26.4 °C | 22.4 °C | 17.0 °C | 116.0 mm | 3.7 mm | — | — |
| December | 35.0 °C | 30.3 °C | 24.0 °C | 28.6 °C | 24.9 °C | 20.3 °C | 25.0 °C | 21.2 °C | 15.0 °C | 341.4 mm | 2.3 mm | — | — |
Data Visualisations
Remove WatermarksCurrent Year Climate Trends vs Historical


Max Temperature this Year | 1 of 6
Climate 12-Month Moving Averages


Max Temperature 12-Month MA | 1 of 6
Daily Data Points and Averages Throughout the Year


Average Max Temperature Throughout Year | 1 of 5
