Climate for Station: Mersa Matruh, Matrouh, Egypt
Loading live weather...
Climate Analysis & Overview
Mersa Matruh, nestled along Egypt's Mediterranean coast, is experiencing a warming trend with both high and low temperatures rising over time. The Precipitation Concentration Index has significantly decreased, suggesting a more even distribution of rainfall. These changes align with broader regional climate shifts and Egypt's sustainability goals.
Mediterranean Climate Dynamics
Mersa Matruh is characterised by a hot desert climate (BWh) according to the Köppen classification, influenced heavily by its proximity to the Mediterranean Sea. This coastal location moderates temperature extremes, providing milder winters and hot, dry summers. The all-time temperature trends reveal a 0.13°C (0.23°F) rise in high temperatures and a 0.14°C (0.25°F) increase in low temperatures. These figures indicate a gradual warming over the station's recorded history, aligning with global climate patterns.
Recent Decadal Shifts
Over the past decade, Mersa Matruh has experienced more pronounced warming. High temperatures have increased by 0.19°C (0.34°F), while low temperatures have risen by a more significant 0.65°C (1.17°F). This disparity suggests that nighttime temperatures are rising faster, a common trend in many regions due to increased greenhouse gases and urban heat effects. Such changes could impact local agriculture, water resources, and energy consumption, pressing issues for Egypt's climate resilience strategies.
Precipitation Patterns and Implications
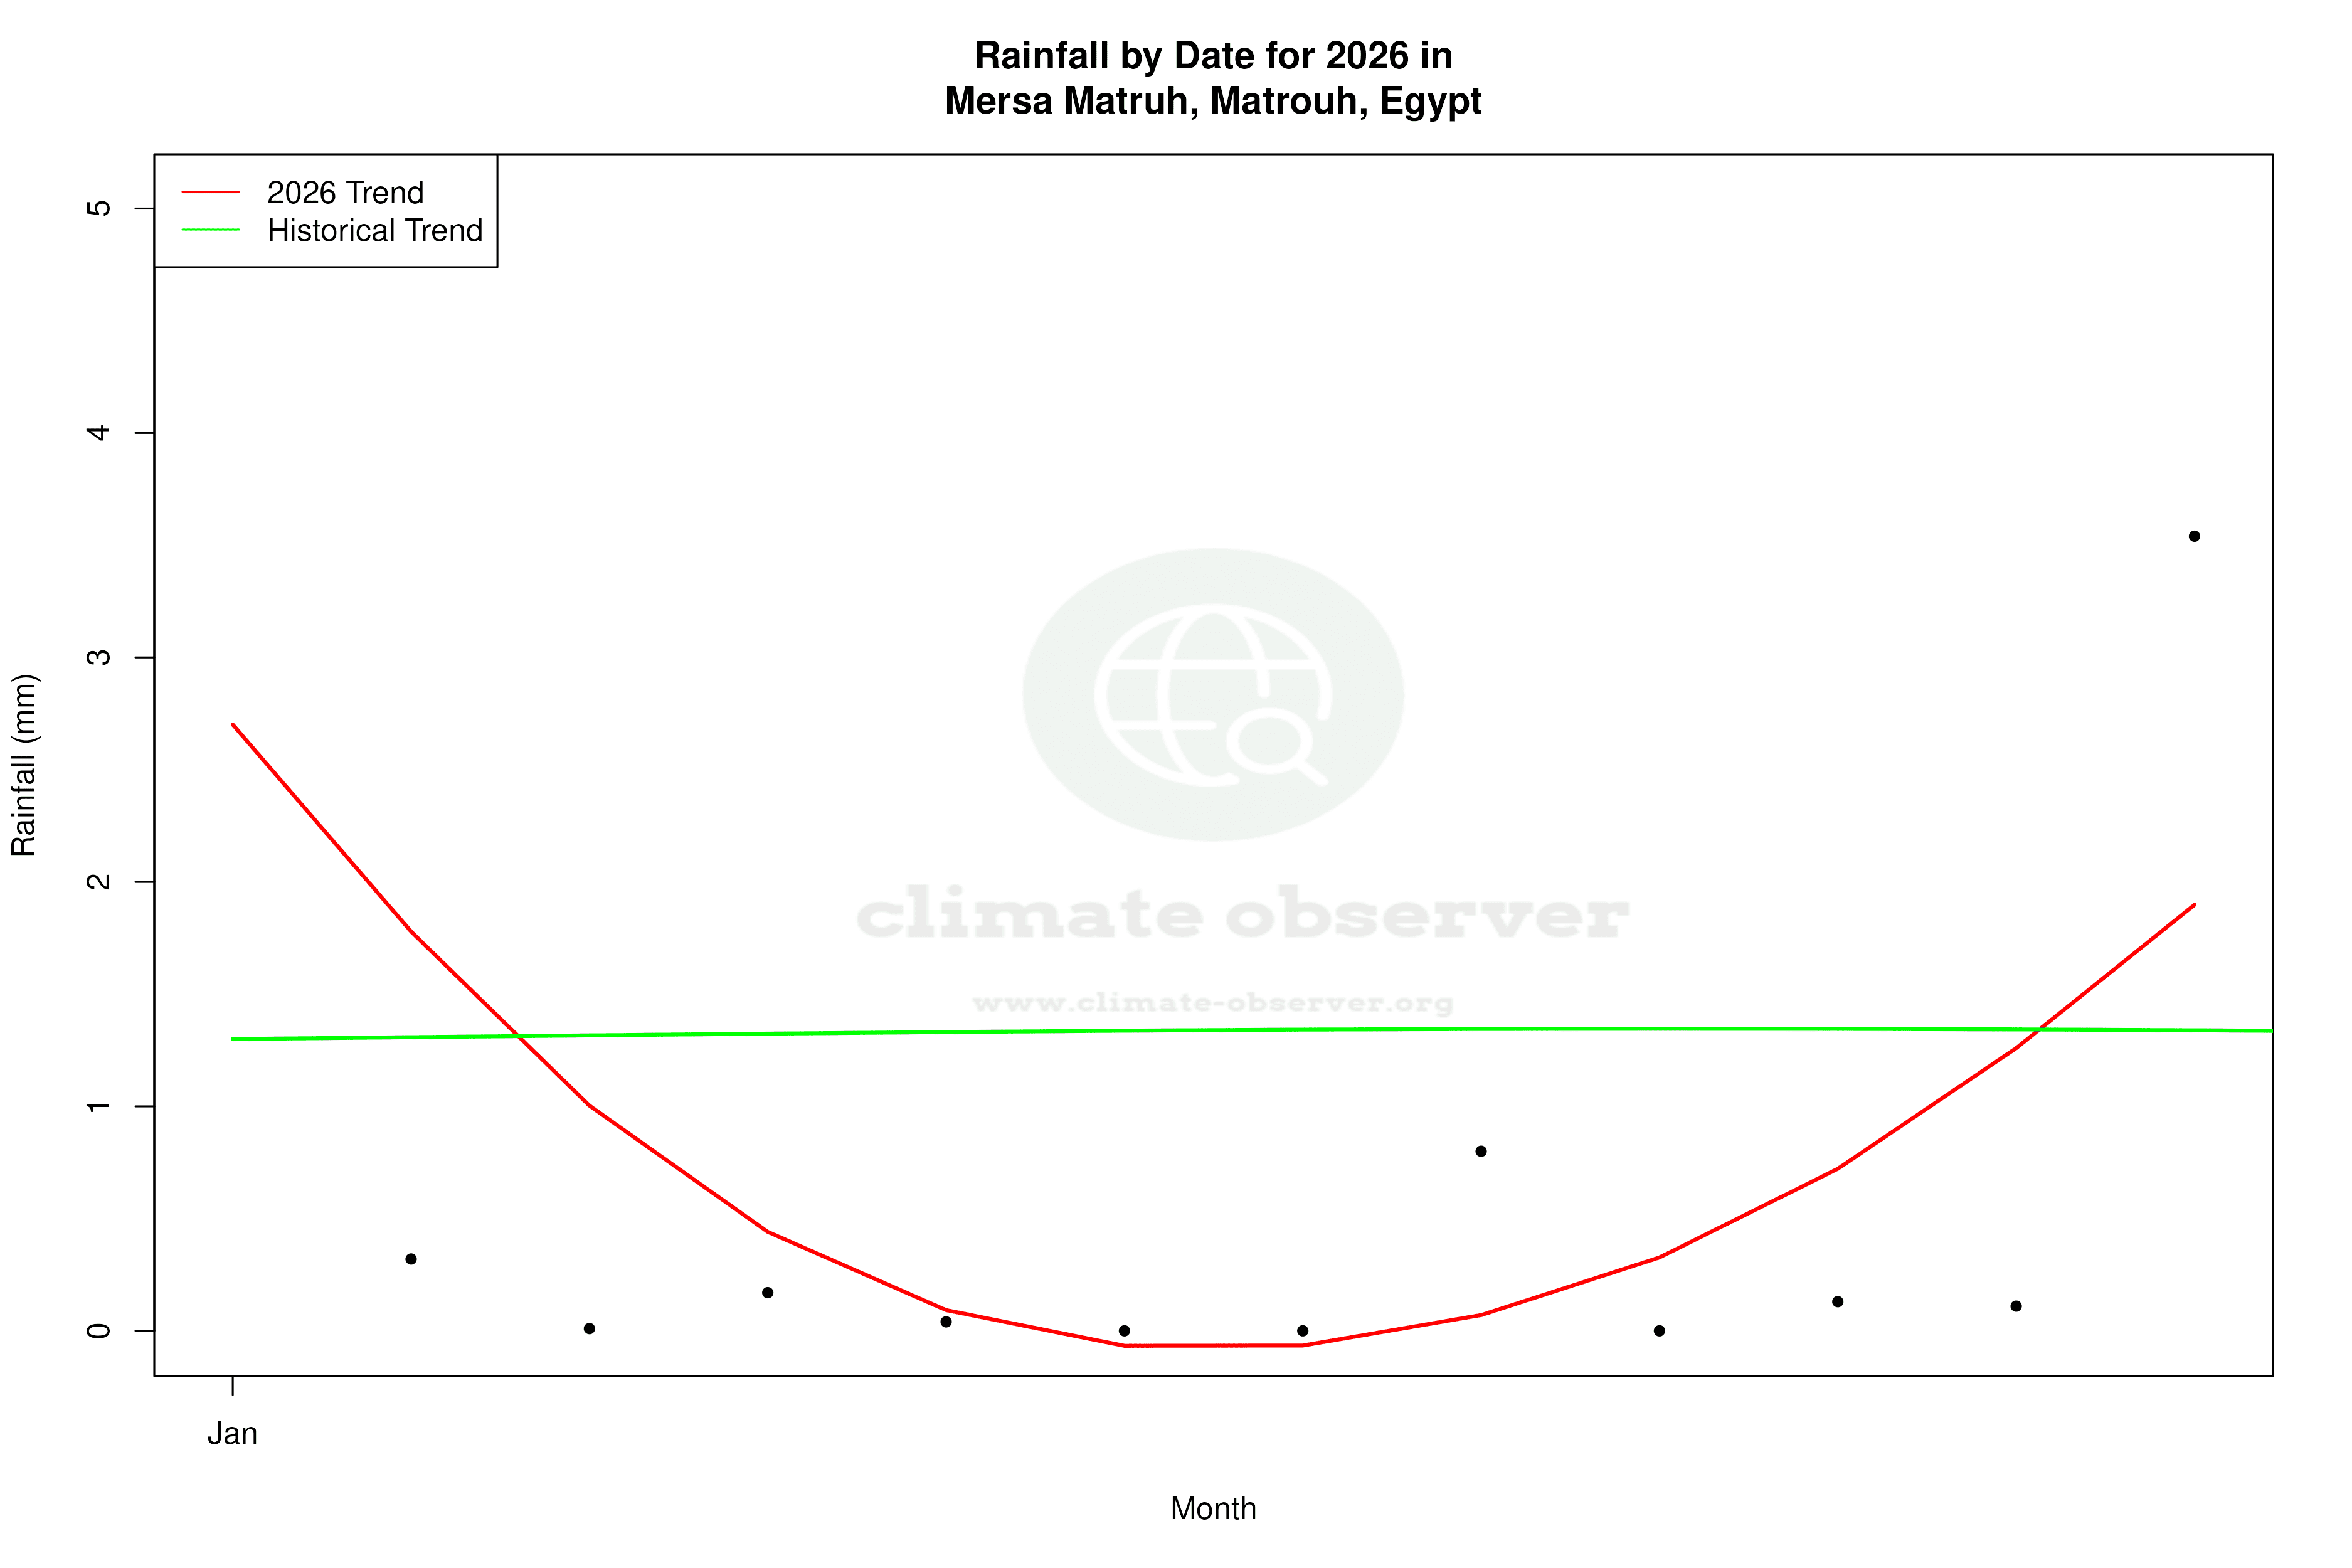
The Precipitation Concentration Index (PCI) at Mersa Matruh has seen a notable decrease from a baseline of 29.4 to the current 15.9. A lower PCI indicates a more even distribution of rainfall throughout the year, which could benefit local ecosystems and agriculture by reducing the risk of droughts and floods. This shift may also align with Egypt's efforts to enhance water management practices amid growing climate challenges.
Temperature Extremes and Records
Mersa Matruh's temperature records highlight the extremes of its climate. The highest recorded temperature is 42.4°C (108.3°F), while the lowest is 0.0°C (32.0°F). These extremes underscore the variability and potential for harsh weather conditions, which can have significant implications for infrastructure and public health, particularly in a region where heatwaves are becoming more frequent.
Regional Climate Context
Egypt's broader climate goals, focusing on adaptation and mitigation, provide a backdrop for understanding these trends. The warming observed in Mersa Matruh is consistent with national objectives to monitor and respond to climate impacts. Recent weather events, such as unusual heatwaves or shifts in precipitation patterns, further highlight the importance of robust climate data in shaping policy and ensuring sustainable development.
Station Statistics
10-Year Trend
High: +0.15 °C/decade
Low: +0.83 °C/decade
Rain: -0.21 mm/decade
25-Year Trend
High: +0.37 °C/decade
Low: +0.32 °C/decade
Rain: +0.12 mm/decade
50-Year Trend
High: +0.52 °C/decade
Low: +0.19 °C/decade
Rain: +0.04 mm/decade
All-Time Trend
High: +0.13 °C/decade
Low: +0.14 °C/decade
Rain: +0.02 mm/decade
Percentage Above-Average Days
Last 12 Months: 47.9%
This Year: 28.3%
Precipitation Concentration Index (PCI) ℹ️
Last 12 Months: 37.0
Historical Average: 27.6
Percentile Rank of Last 12 Months ℹ️
High: 86th percentile
Low: 97th percentile
Rain: 13th percentile
Change in Variance ℹ️
High: +10.3%
Low: +7.4%
Intraday: -19.7%
Data Coverage
71.1%
First Year of Data
1920
Station Location
Historical Weather Records
| Max High | Avg High | Min High | Max Avg | Avg Avg | Min Avg | Max Low | Avg Low | Min Low | Max Precipitation | Avg Precipitation | Max Snow | Avg Snow | |
|---|---|---|---|---|---|---|---|---|---|---|---|---|---|
| Record | 42.4 °C | — | 8.0 °C | 32.9 °C | — | 7.1 °C | 27.4 °C | — | 0.0 °C | 333.0 mm | — | — | — |
| January | 29.2 °C | 17.9 °C | 10.6 °C | 22.1 °C | 13.7 °C | 7.1 °C | 17.0 °C | 9.5 °C | 1.0 °C | 44.0 mm | 1.3 mm | — | — |
| February | 30.4 °C | 18.3 °C | 8.0 °C | 22.3 °C | 14.1 °C | 7.1 °C | 19.0 °C | 9.7 °C | 1.0 °C | 43.0 mm | 0.8 mm | — | — |
| March | 36.0 °C | 20.0 °C | 10.0 °C | 25.1 °C | 15.6 °C | 8.5 °C | 20.0 °C | 11.1 °C | 1.0 °C | 333.0 mm | 0.6 mm | — | — |
| April | 41.8 °C | 22.7 °C | 13.0 °C | 28.9 °C | 18.1 °C | 10.7 °C | 26.0 °C | 13.3 °C | 1.8 °C | 29.2 mm | 0.1 mm | — | — |
| May | 42.4 °C | 25.2 °C | 18.0 °C | 31.1 °C | 20.8 °C | 14.1 °C | 27.0 °C | 16.0 °C | 7.8 °C | 27.4 mm | 0.1 mm | — | — |
| June | 39.0 °C | 27.5 °C | 21.0 °C | 32.6 °C | 24.0 °C | 18.7 °C | 26.0 °C | 19.4 °C | 8.8 °C | 47.0 mm | 0.0 mm | — | — |
| July | 37.0 °C | 29.0 °C | 24.7 °C | 31.7 °C | 25.9 °C | 22.4 °C | 26.9 °C | 21.6 °C | 11.6 °C | 7.9 mm | 0.0 mm | — | — |
| August | 36.5 °C | 29.7 °C | 24.0 °C | 31.6 °C | 26.6 °C | 23.4 °C | 27.4 °C | 22.3 °C | 17.0 °C | 11.0 mm | 0.0 mm | — | — |
| September | 37.6 °C | 28.7 °C | 23.2 °C | 32.9 °C | 25.3 °C | 20.4 °C | 27.0 °C | 21.1 °C | 10.0 °C | 12.0 mm | 0.0 mm | — | — |
| October | 38.2 °C | 26.8 °C | 19.3 °C | 30.8 °C | 22.7 °C | 15.7 °C | 25.0 °C | 18.4 °C | 4.8 °C | 43.9 mm | 0.3 mm | — | — |
| November | 34.4 °C | 23.4 °C | 13.0 °C | 25.7 °C | 18.8 °C | 11.1 °C | 22.7 °C | 14.8 °C | 6.0 °C | 52.0 mm | 0.8 mm | — | — |
| December | 29.2 °C | 19.7 °C | 10.2 °C | 22.2 °C | 15.1 °C | 8.3 °C | 19.9 °C | 11.1 °C | 0.0 °C | 77.1 mm | 1.1 mm | — | — |
Data Visualisations
Remove WatermarksCurrent Year Climate Trends vs Historical


Max Temperature this Year | 1 of 6
Climate 12-Month Moving Averages


Max Temperature 12-Month MA | 1 of 6
Daily Data Points and Averages Throughout the Year


Average Max Temperature Throughout Year | 1 of 5
