Climate for Station: Malin Head, Donegal, Ireland
Loading live weather...
Climate Analysis & Overview
Malin Head, located in County Donegal, Ireland, is experiencing a warming trend, with significant increases in both high and low temperatures over the past decade. Precipitation is becoming more evenly distributed, suggesting changes in weather patterns that may impact local climate resilience.
Coastal Climate Dynamics
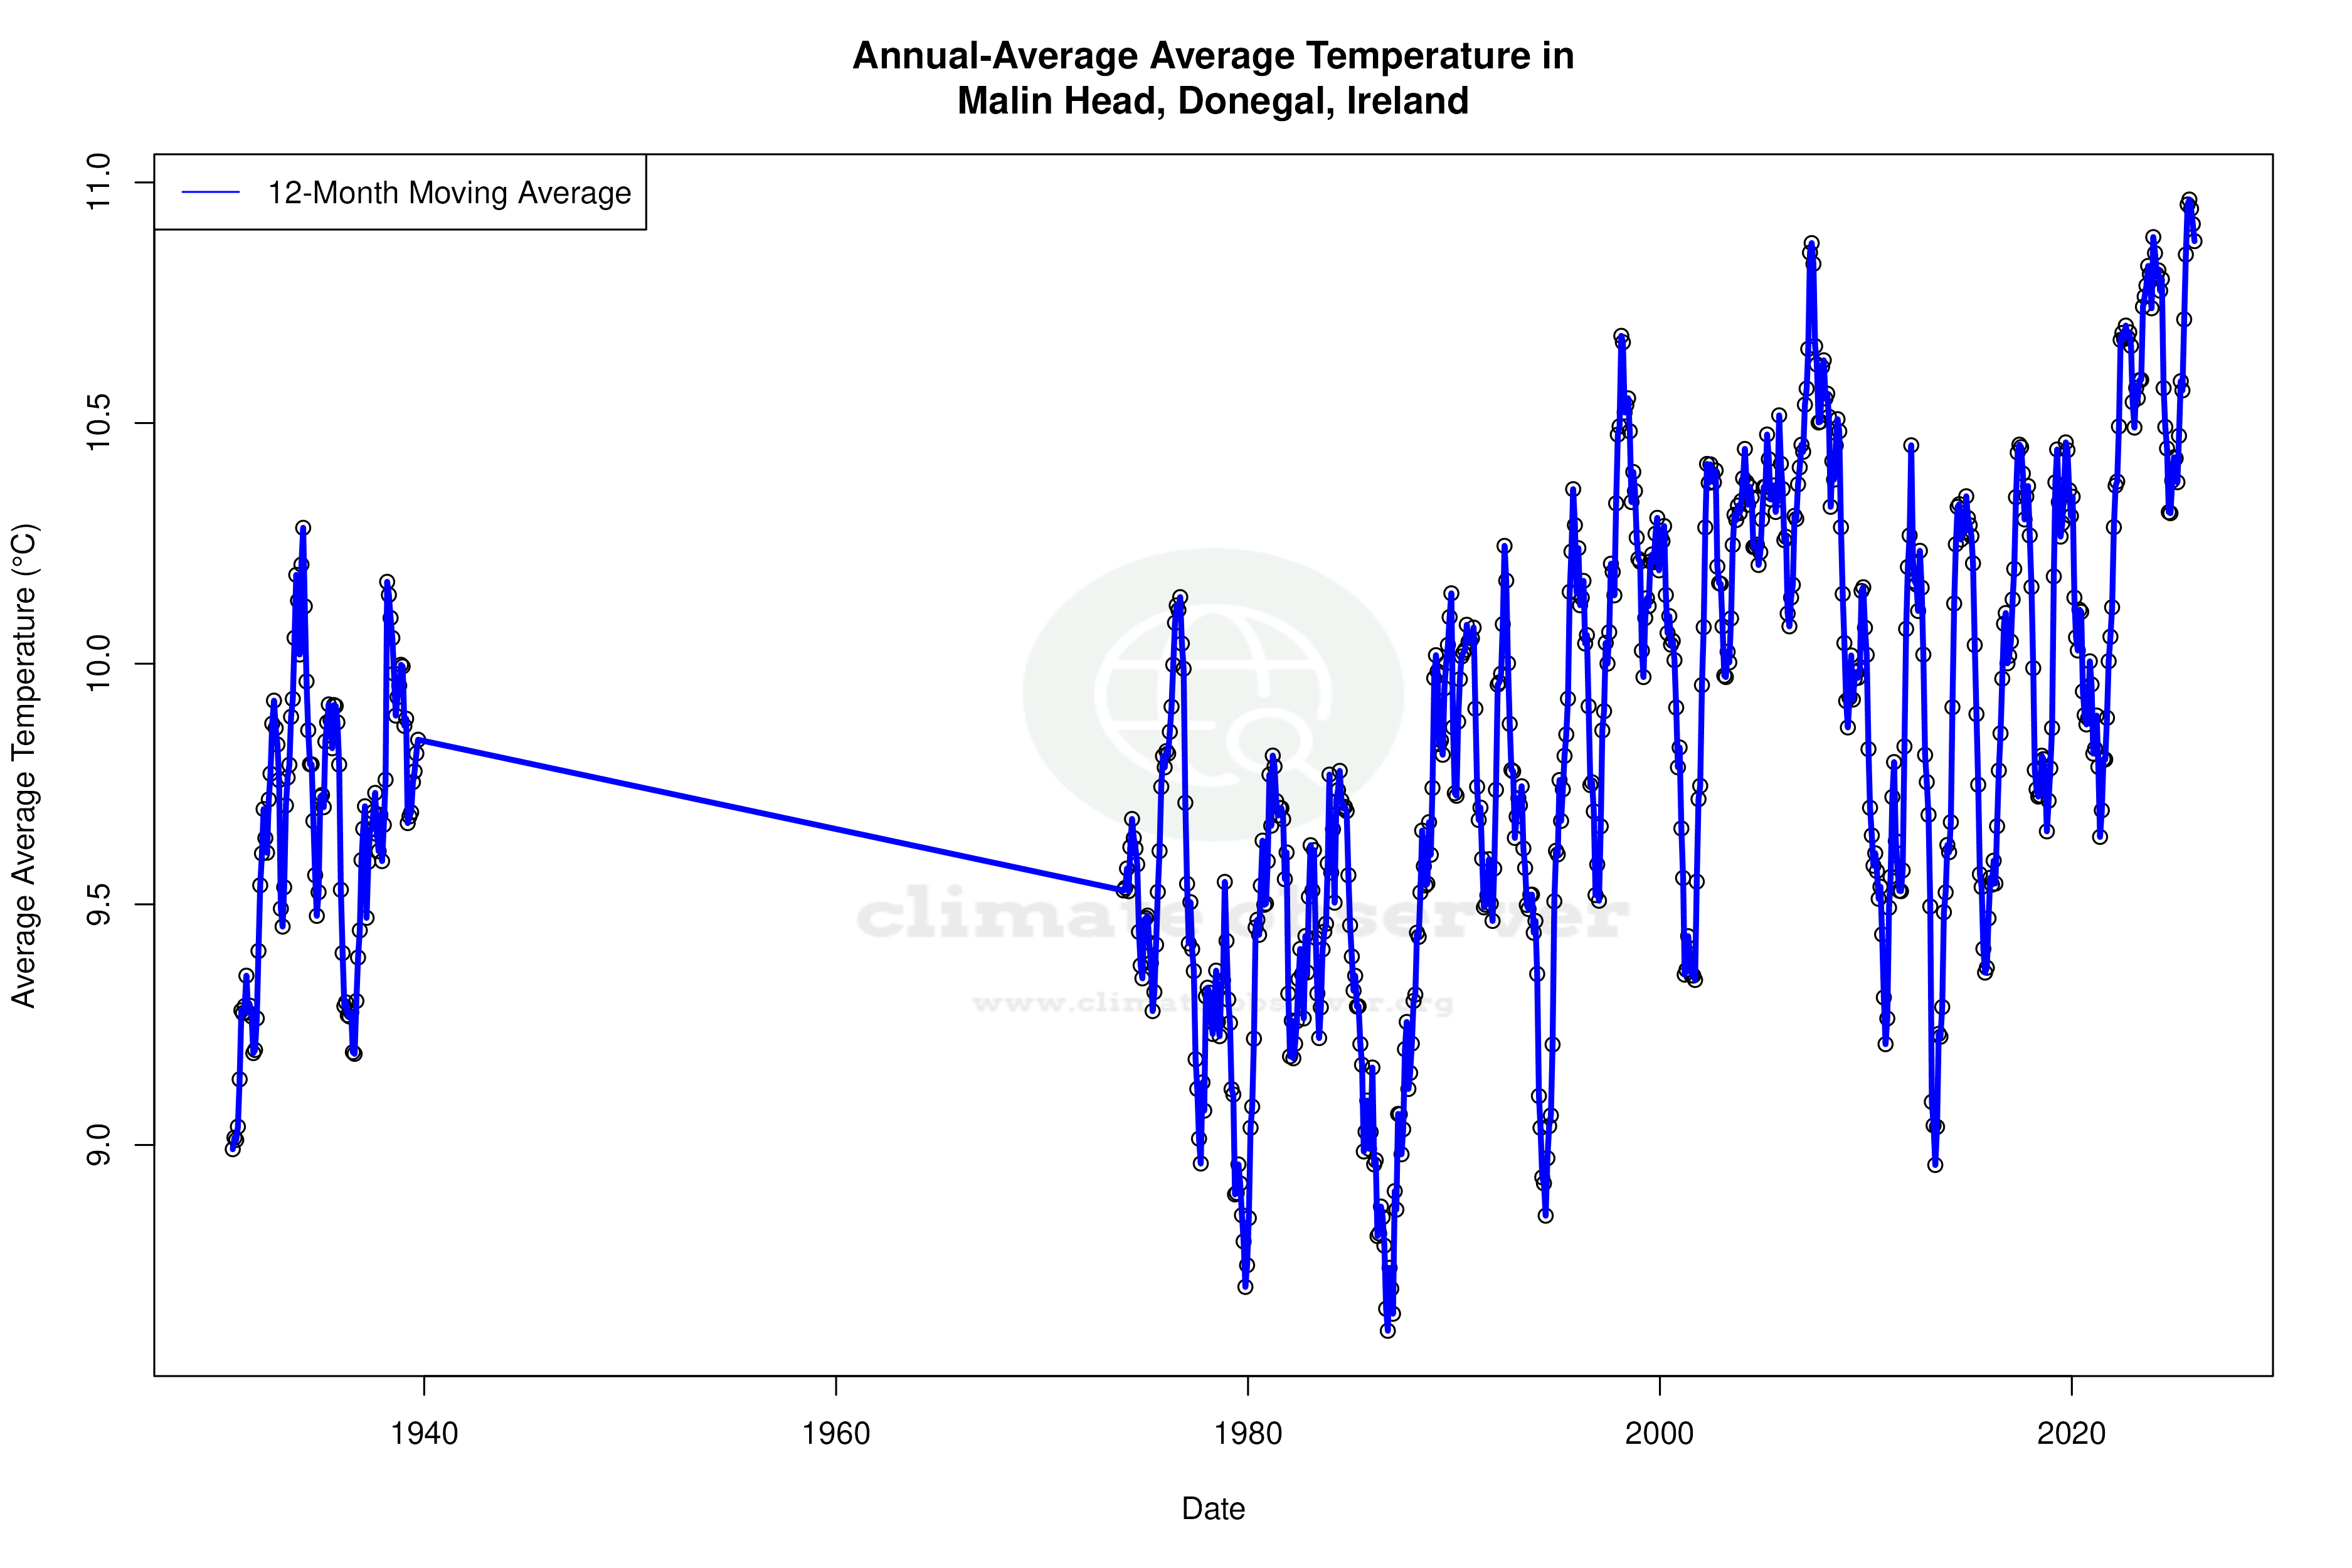
Malin Head, positioned at the northern tip of Ireland, is classified under the Köppen climate classification as a Cfb climate—temperate oceanic. This classification is characterised by mild temperatures and significant rainfall throughout the year. The proximity to the Atlantic Ocean moderates temperature extremes, contributing to the area's relatively stable climate. However, the data indicates a notable warming trend, with the 10-year interval showing an increase in high temperatures by 0.76°C (1.37°F) and low temperatures by 0.99°C (1.79°F). This warming is more pronounced than the all-time trends, which show a rise of 0.14°C (0.25°F) for highs and 0.12°C (0.22°F) for lows, suggesting recent acceleration.
Temperature Extremes and Records
The recorded temperature extremes at Malin Head underscore the variability within this temperate climate. The maximum recorded temperature is 27.0°C (80.6°F), while the minimum is -6.2°C (20.8°F). These records highlight the potential for both warm and cold extremes despite the overall moderate climate. The recent warming trends may influence the frequency and intensity of these extremes, potentially impacting local ecosystems and human activities.
Precipitation Patterns and Distribution
The Precipitation Concentration Index (PCI) is a measure of how rainfall is distributed over time. A decrease from a baseline PCI of 10.90 to a current value of 8.92 indicates that precipitation is becoming more evenly distributed across the year. This change suggests a shift away from intense, concentrated rainfall events towards a more uniform distribution, which could have implications for water management and agricultural practices in the region.
Regional Climate Implications
These climatic changes at Malin Head occur within the broader context of Ireland's climate goals, which aim to reduce greenhouse gas emissions and enhance climate resilience. The observed warming trends and changes in precipitation distribution may influence local strategies for adaptation and mitigation. Recent weather events, such as storms and flooding, underscore the importance of understanding these trends to prepare for future climate variability.
Geographical Influences on Climate
The geographical features surrounding Malin Head, including its coastal location and exposure to Atlantic weather systems, play a crucial role in shaping its climate. The ocean's moderating influence helps maintain mild temperatures, while the prevailing westerly winds bring frequent rainfall. As climate patterns evolve, the interplay between these geographical factors and climatic trends will be pivotal in determining the future climate landscape of Malin Head.
Station Statistics
10-Year Trend
High: +0.64 °C/decade
Low: +0.98 °C/decade
Rain: -0.08 mm/decade
25-Year Trend
High: +0.21 °C/decade
Low: -0.04 °C/decade
Rain: +0.07 mm/decade
50-Year Trend
High: +0.24 °C/decade
Low: +0.29 °C/decade
Rain: +0.06 mm/decade
All-Time Trend
High: +0.14 °C/decade
Low: +0.12 °C/decade
Rain: +0.08 mm/decade
Percentage Above-Average Days
Last 12 Months: 50.1%
This Year: 41.2%
Precipitation Concentration Index (PCI) ℹ️
Last 12 Months: 8.6
Historical Average: 10.2
Percentile Rank of Last 12 Months ℹ️
High: 97th percentile
Low: 97th percentile
Rain: 55th percentile
Change in Variance ℹ️
High: -0.2%
Low: -3.8%
Intraday: +8.1%
Data Coverage
63.9%
First Year of Data
1885
Station Location
Historical Weather Records
| Max High | Avg High | Min High | Max Avg | Avg Avg | Min Avg | Max Low | Avg Low | Min Low | Max Precipitation | Avg Precipitation | Max Snow | Avg Snow | |
|---|---|---|---|---|---|---|---|---|---|---|---|---|---|
| Record | 27.0 °C | — | -1.0 °C | 21.5 °C | — | -2.7 °C | 18.5 °C | — | -6.2 °C | 71.4 mm | — | — | — |
| January | 14.5 °C | 8.0 °C | -1.0 °C | 13.3 °C | 6.1 °C | -1.8 °C | 11.2 °C | 3.6 °C | -6.2 °C | 51.8 mm | 3.2 mm | — | — |
| February | 14.6 °C | 8.0 °C | -0.2 °C | 12.8 °C | 6.0 °C | -0.7 °C | 11.8 °C | 3.5 °C | -6.2 °C | 44.3 mm | 2.7 mm | — | — |
| March | 19.9 °C | 9.2 °C | 2.2 °C | 14.8 °C | 6.8 °C | -0.6 °C | 11.1 °C | 4.3 °C | -4.4 °C | 31.4 mm | 2.2 mm | — | — |
| April | 21.4 °C | 10.7 °C | 4.4 °C | 16.6 °C | 8.2 °C | 2.0 °C | 12.9 °C | 5.6 °C | -1.8 °C | 32.1 mm | 1.9 mm | — | — |
| May | 25.1 °C | 13.1 °C | 5.5 °C | 19.2 °C | 10.4 °C | 2.9 °C | 14.2 °C | 7.7 °C | -0.5 °C | 35.0 mm | 1.9 mm | — | — |
| June | 25.8 °C | 15.3 °C | 9.4 °C | 20.5 °C | 12.6 °C | 7.7 °C | 16.6 °C | 10.2 °C | 2.6 °C | 43.7 mm | 2.2 mm | — | — |
| July | 27.0 °C | 16.6 °C | 11.0 °C | 21.3 °C | 14.2 °C | 7.9 °C | 18.5 °C | 11.9 °C | 4.4 °C | 71.4 mm | 2.6 mm | — | — |
| August | 25.9 °C | 16.9 °C | 11.9 °C | 21.1 °C | 14.5 °C | 10.4 °C | 18.4 °C | 12.0 °C | 5.2 °C | 49.9 mm | 2.9 mm | — | — |
| September | 26.2 °C | 15.6 °C | 9.9 °C | 21.5 °C | 13.2 °C | 7.2 °C | 17.9 °C | 10.8 °C | 2.0 °C | 56.0 mm | 3.0 mm | — | — |
| October | 21.1 °C | 13.1 °C | 6.6 °C | 18.0 °C | 10.8 °C | 4.2 °C | 16.5 °C | 8.7 °C | 0.4 °C | 60.0 mm | 3.3 mm | — | — |
| November | 17.6 °C | 10.2 °C | 4.4 °C | 15.1 °C | 8.3 °C | 1.2 °C | 14.1 °C | 5.9 °C | -2.5 °C | 54.3 mm | 3.4 mm | — | — |
| December | 16.0 °C | 8.7 °C | 0.4 °C | 13.6 °C | 6.8 °C | -2.7 °C | 11.6 °C | 4.4 °C | -4.8 °C | 39.6 mm | 3.4 mm | — | — |
Data Visualisations
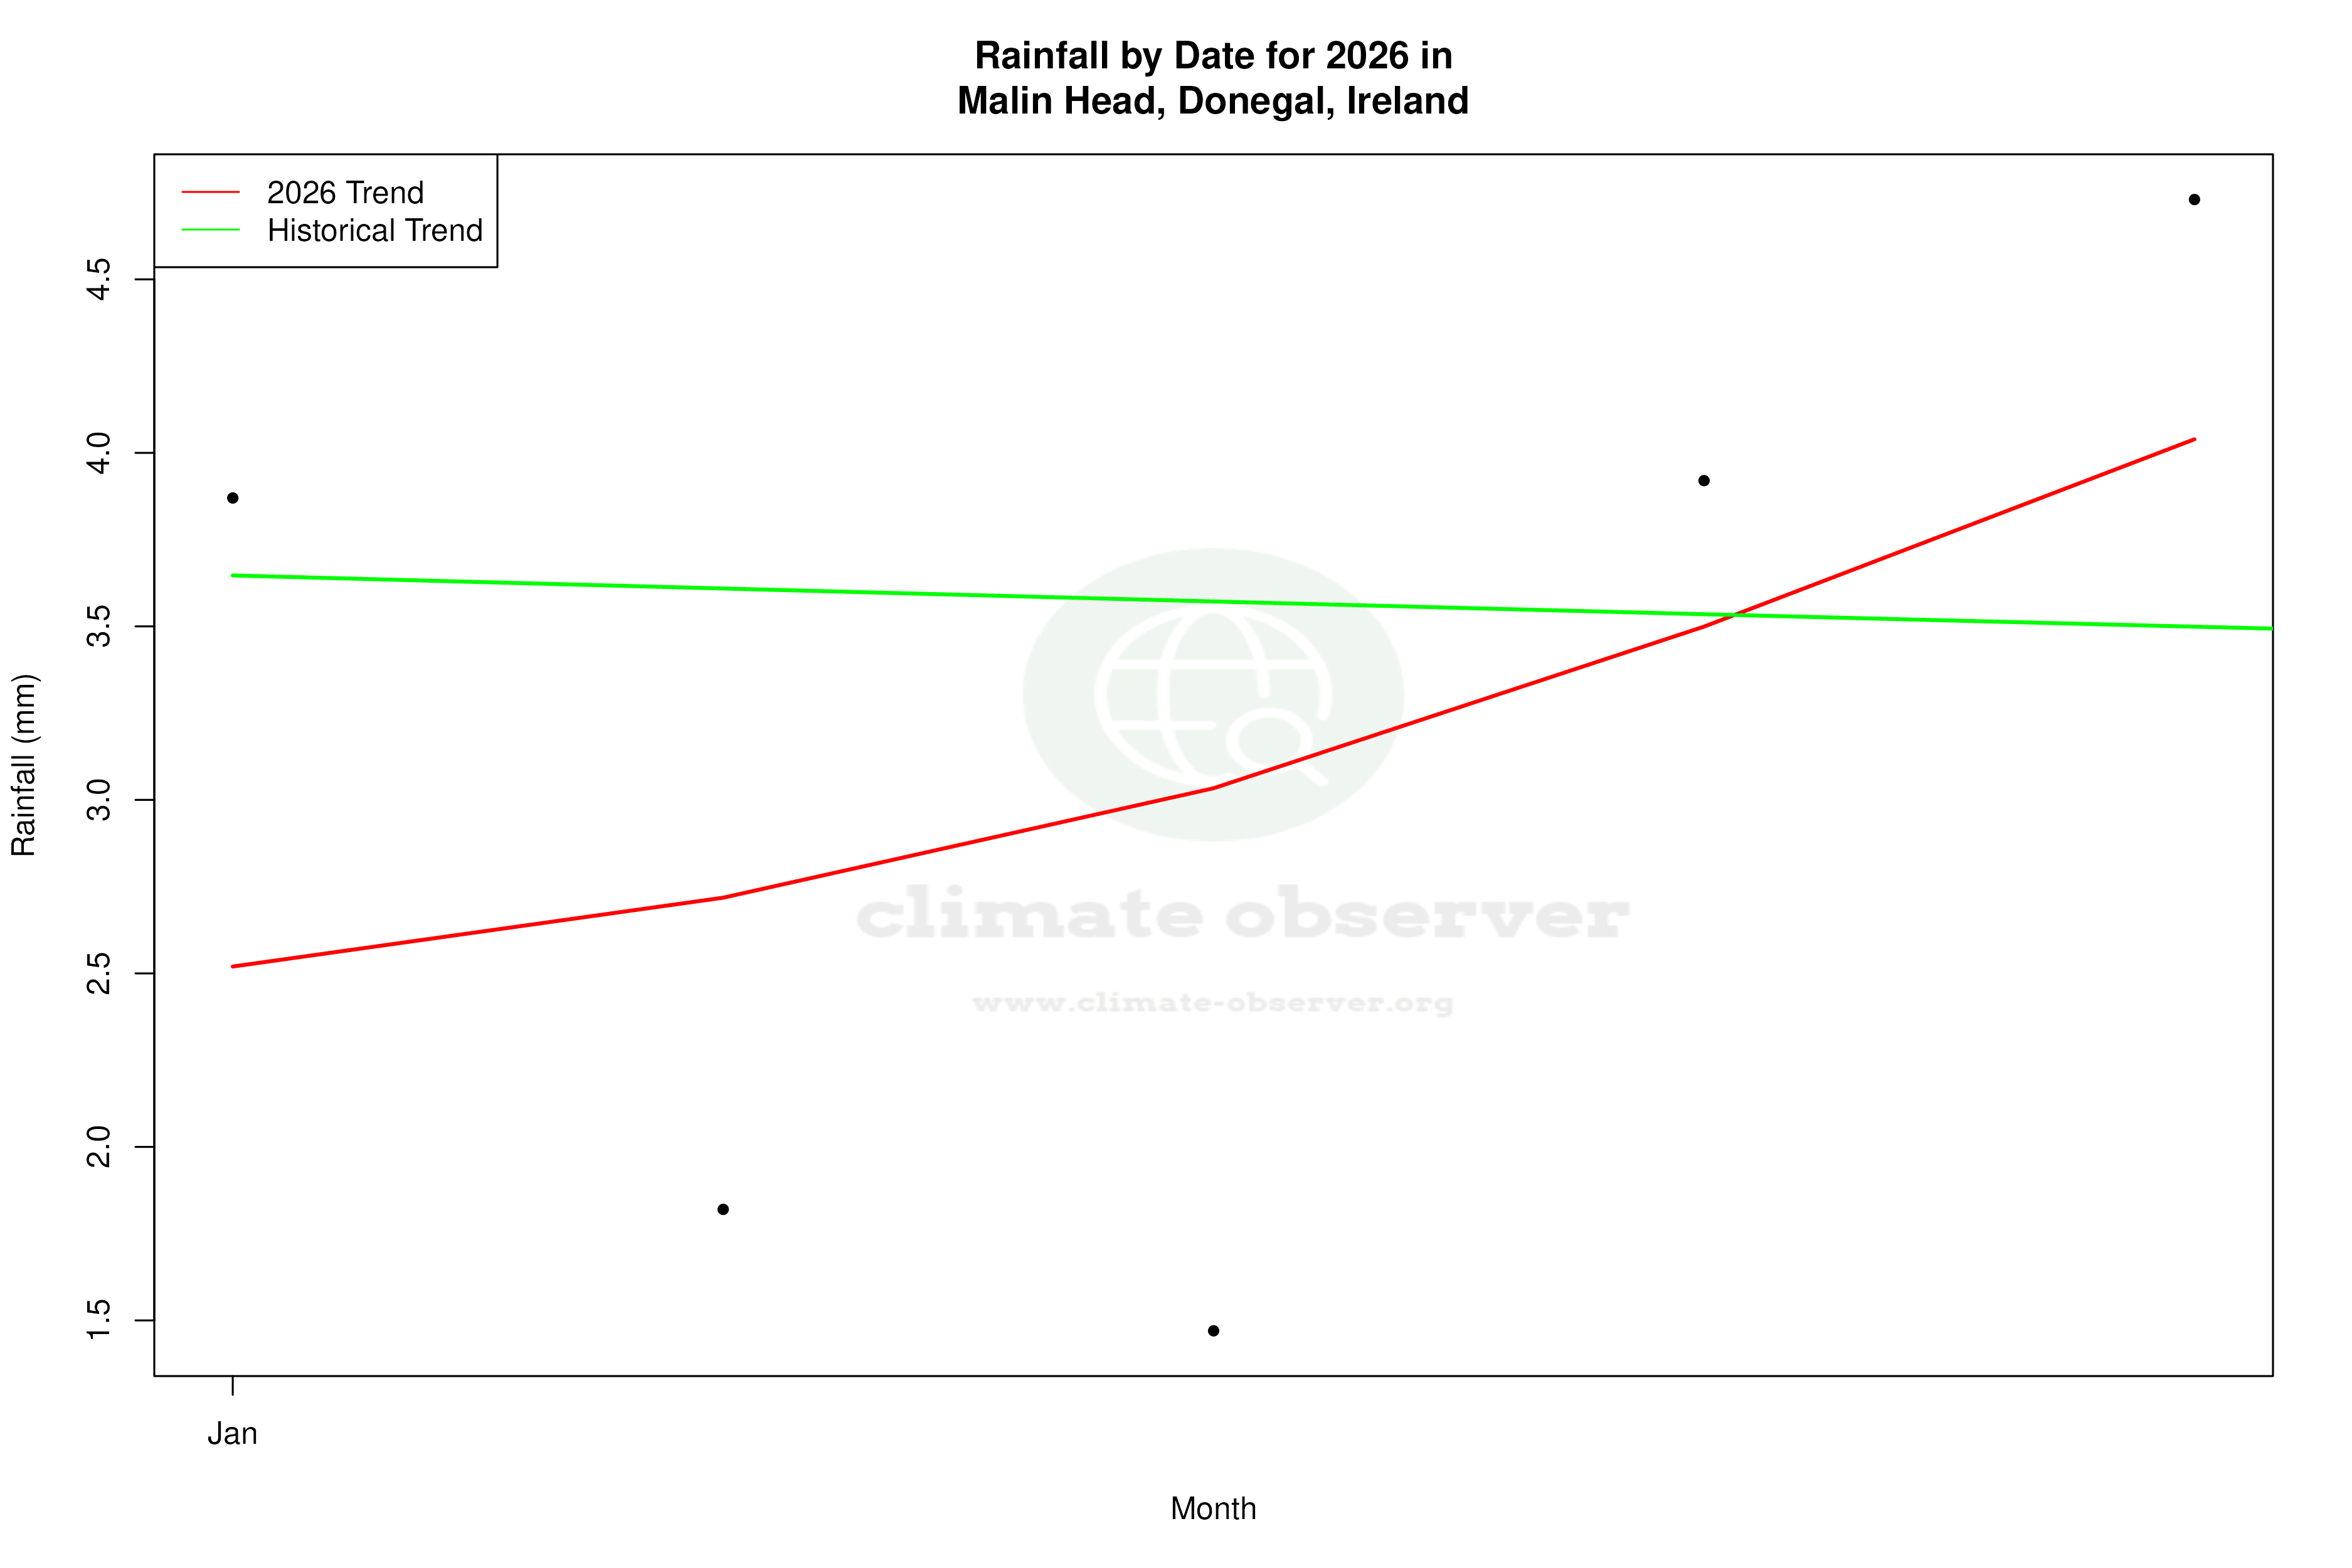
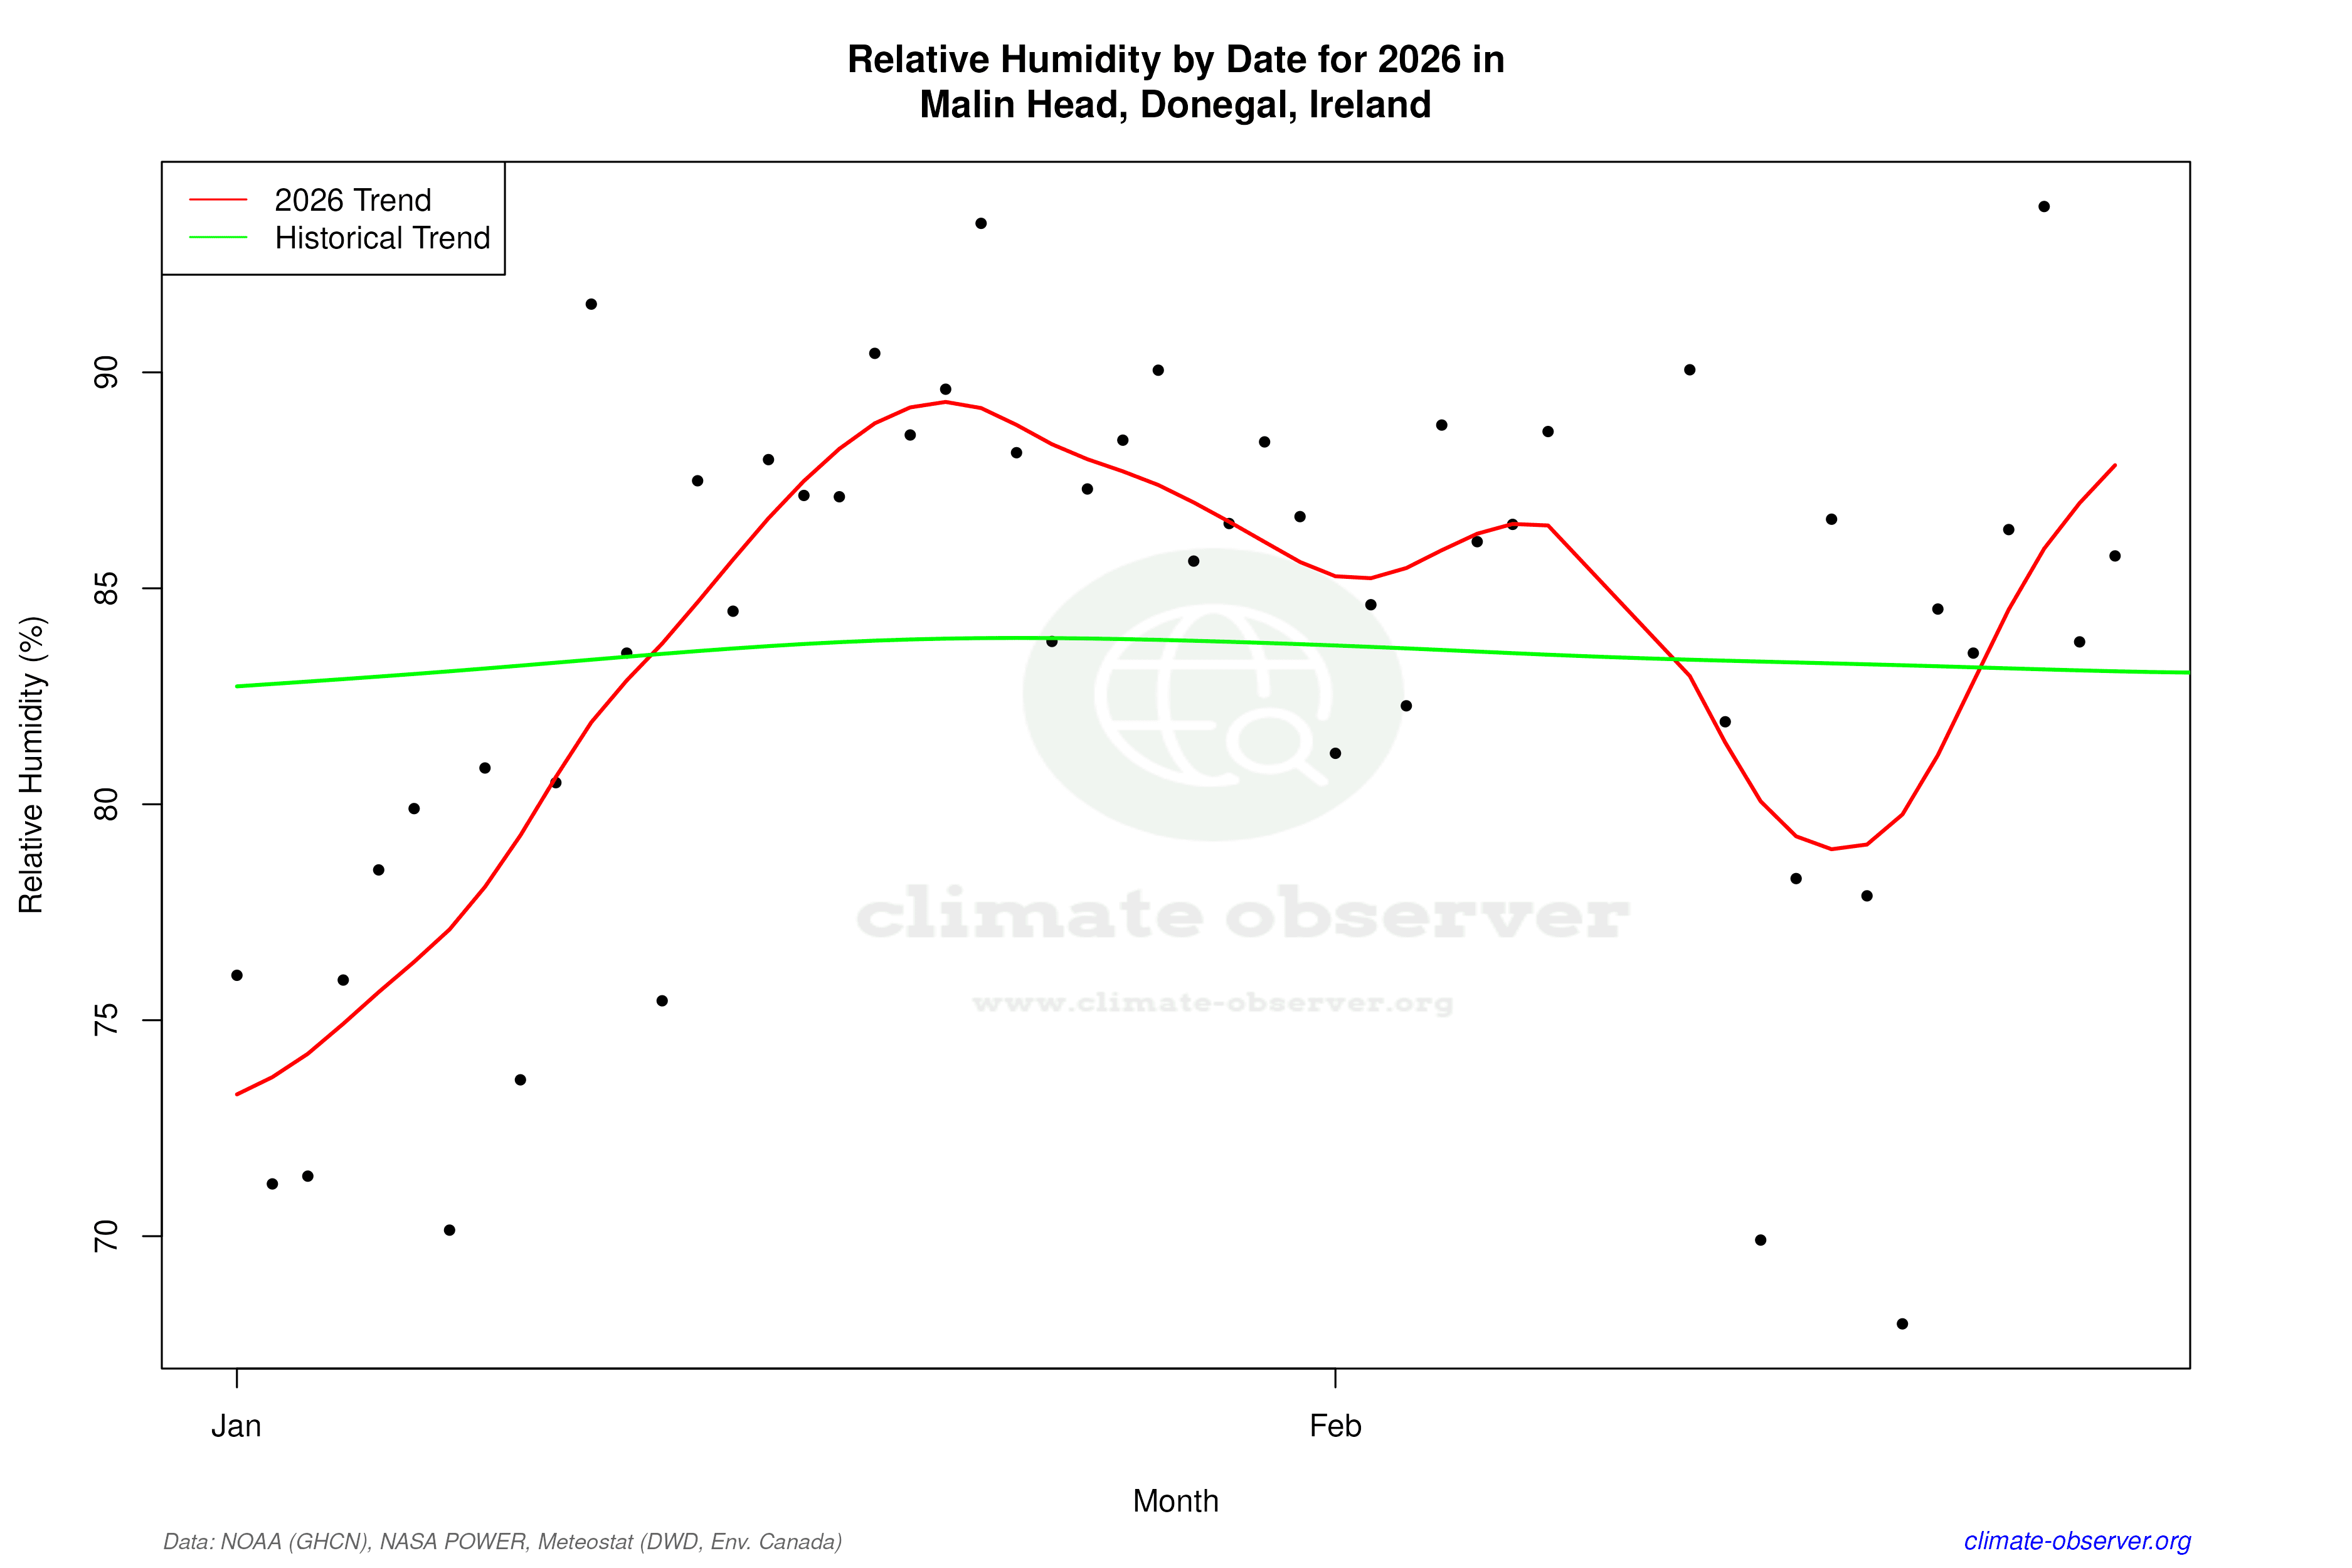
Remove WatermarksCurrent Year Climate Trends vs Historical


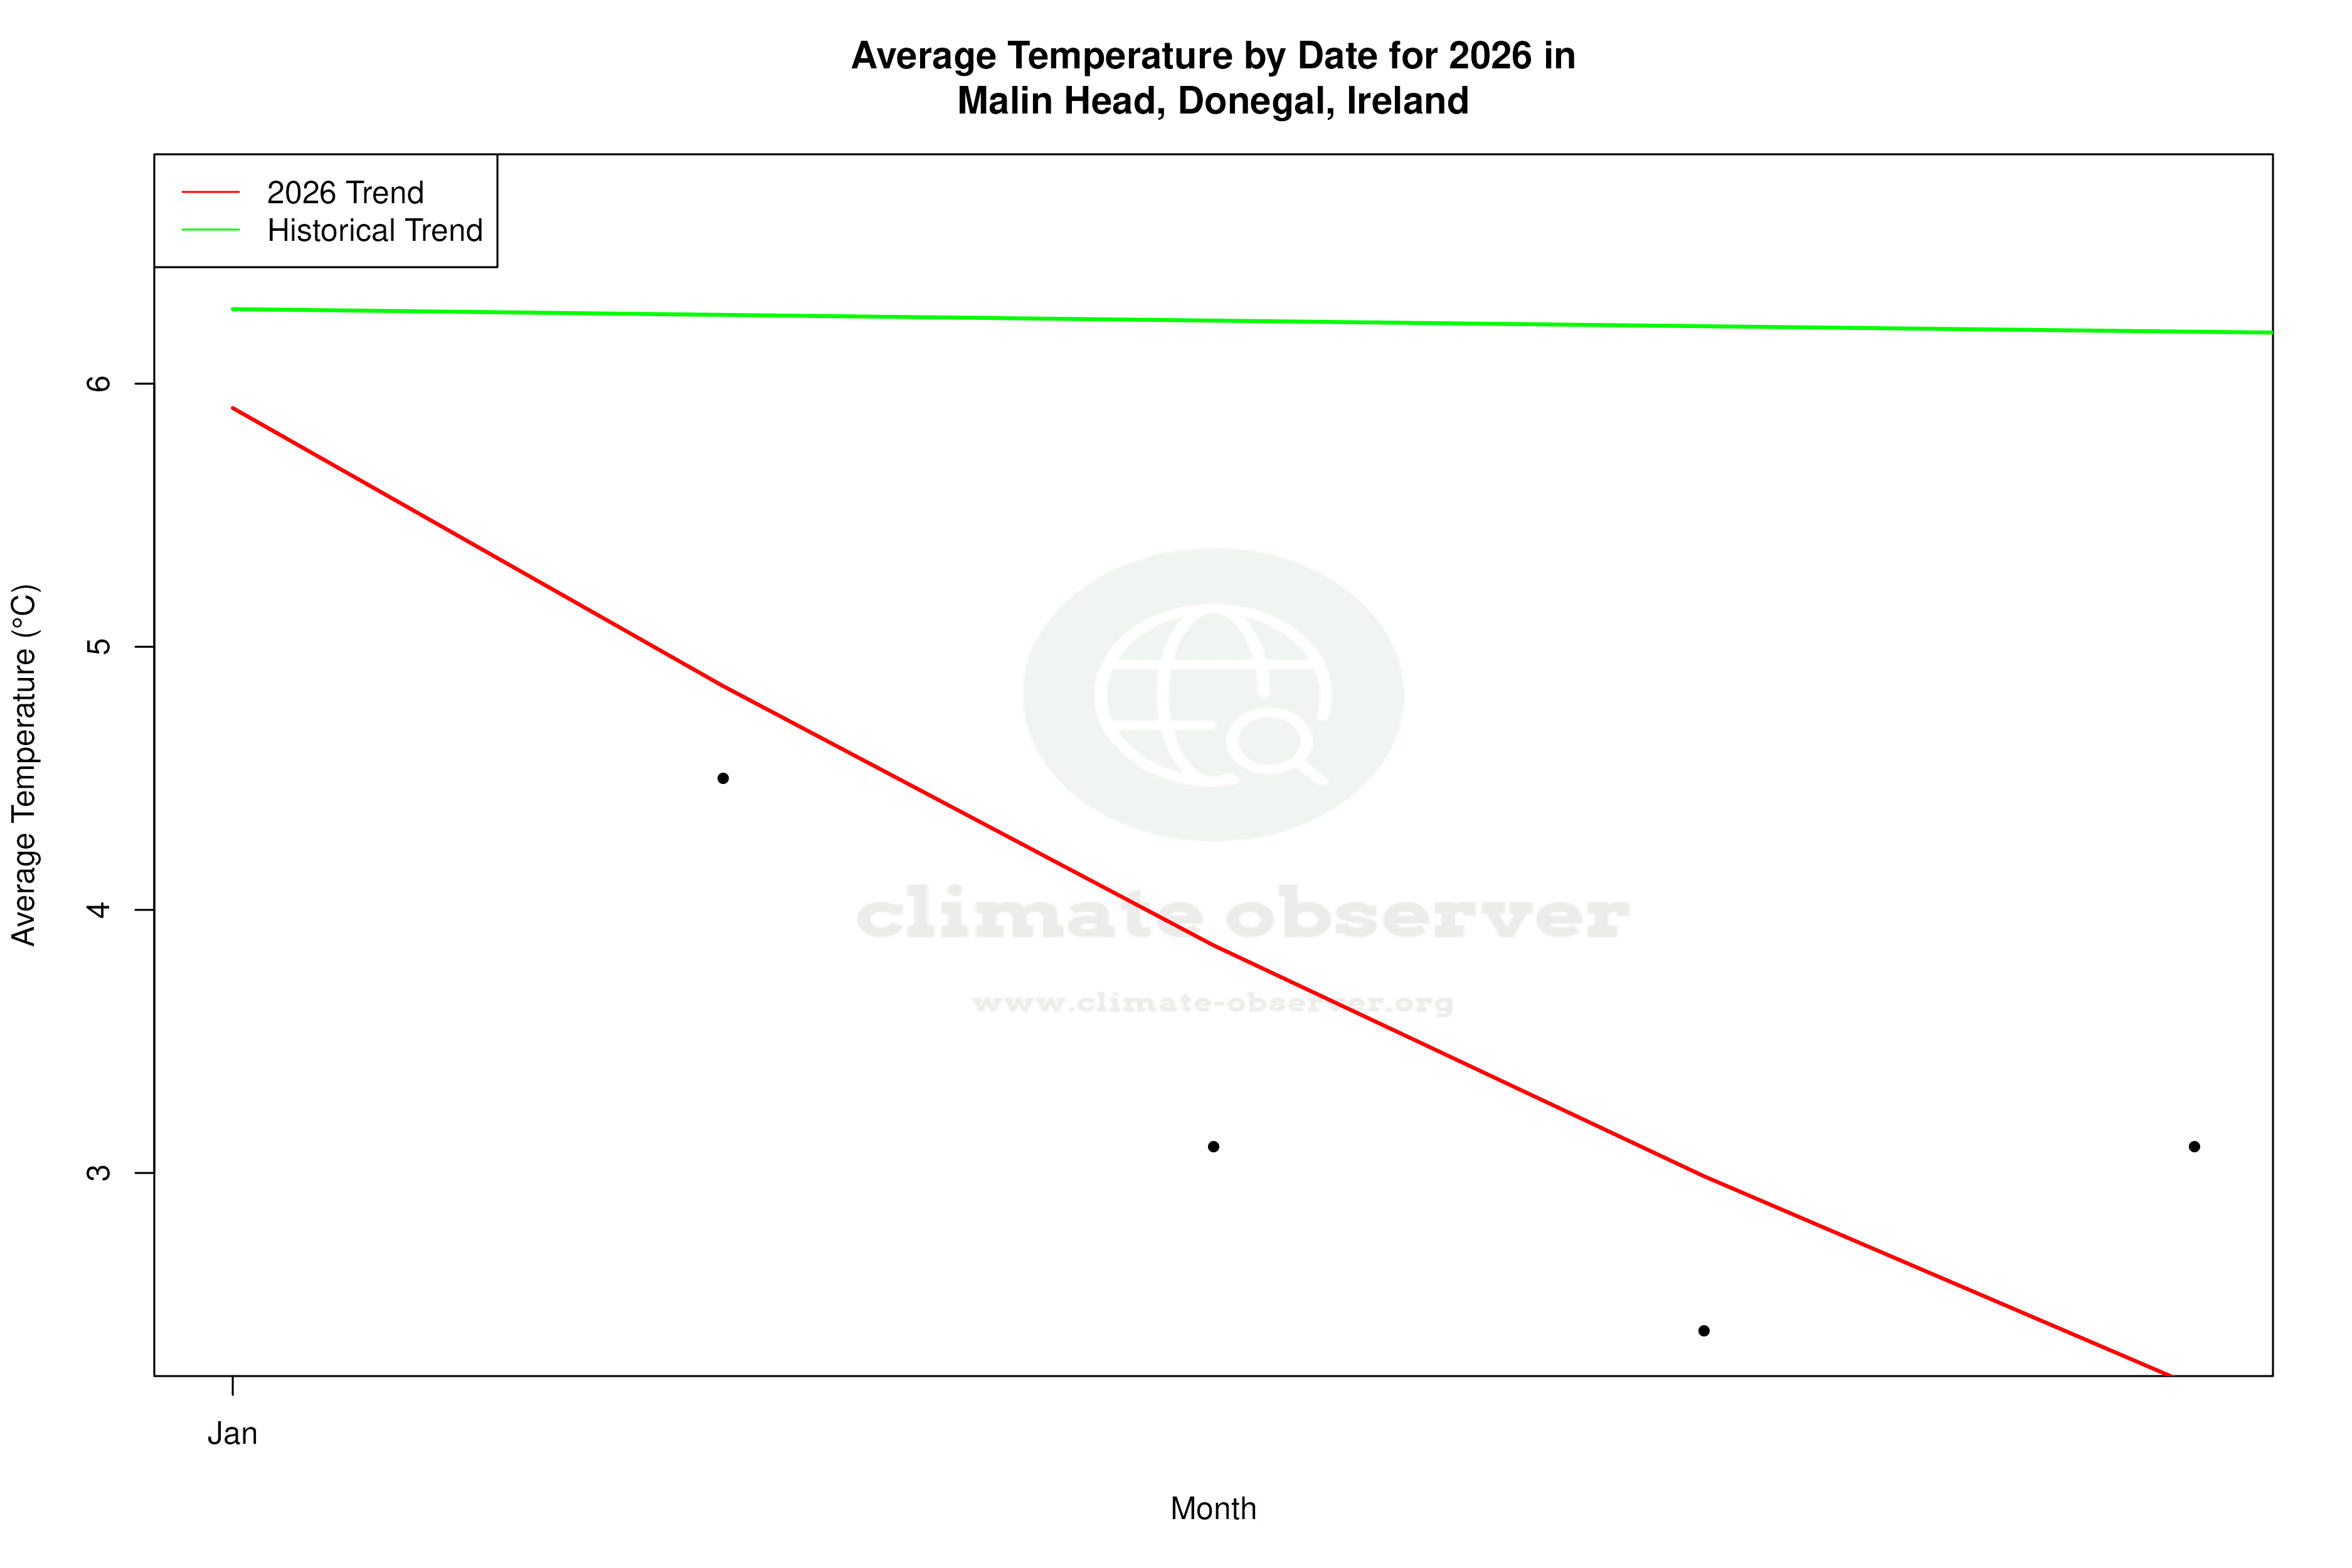

Max Temperature this Year | 1 of 6
Climate 12-Month Moving Averages
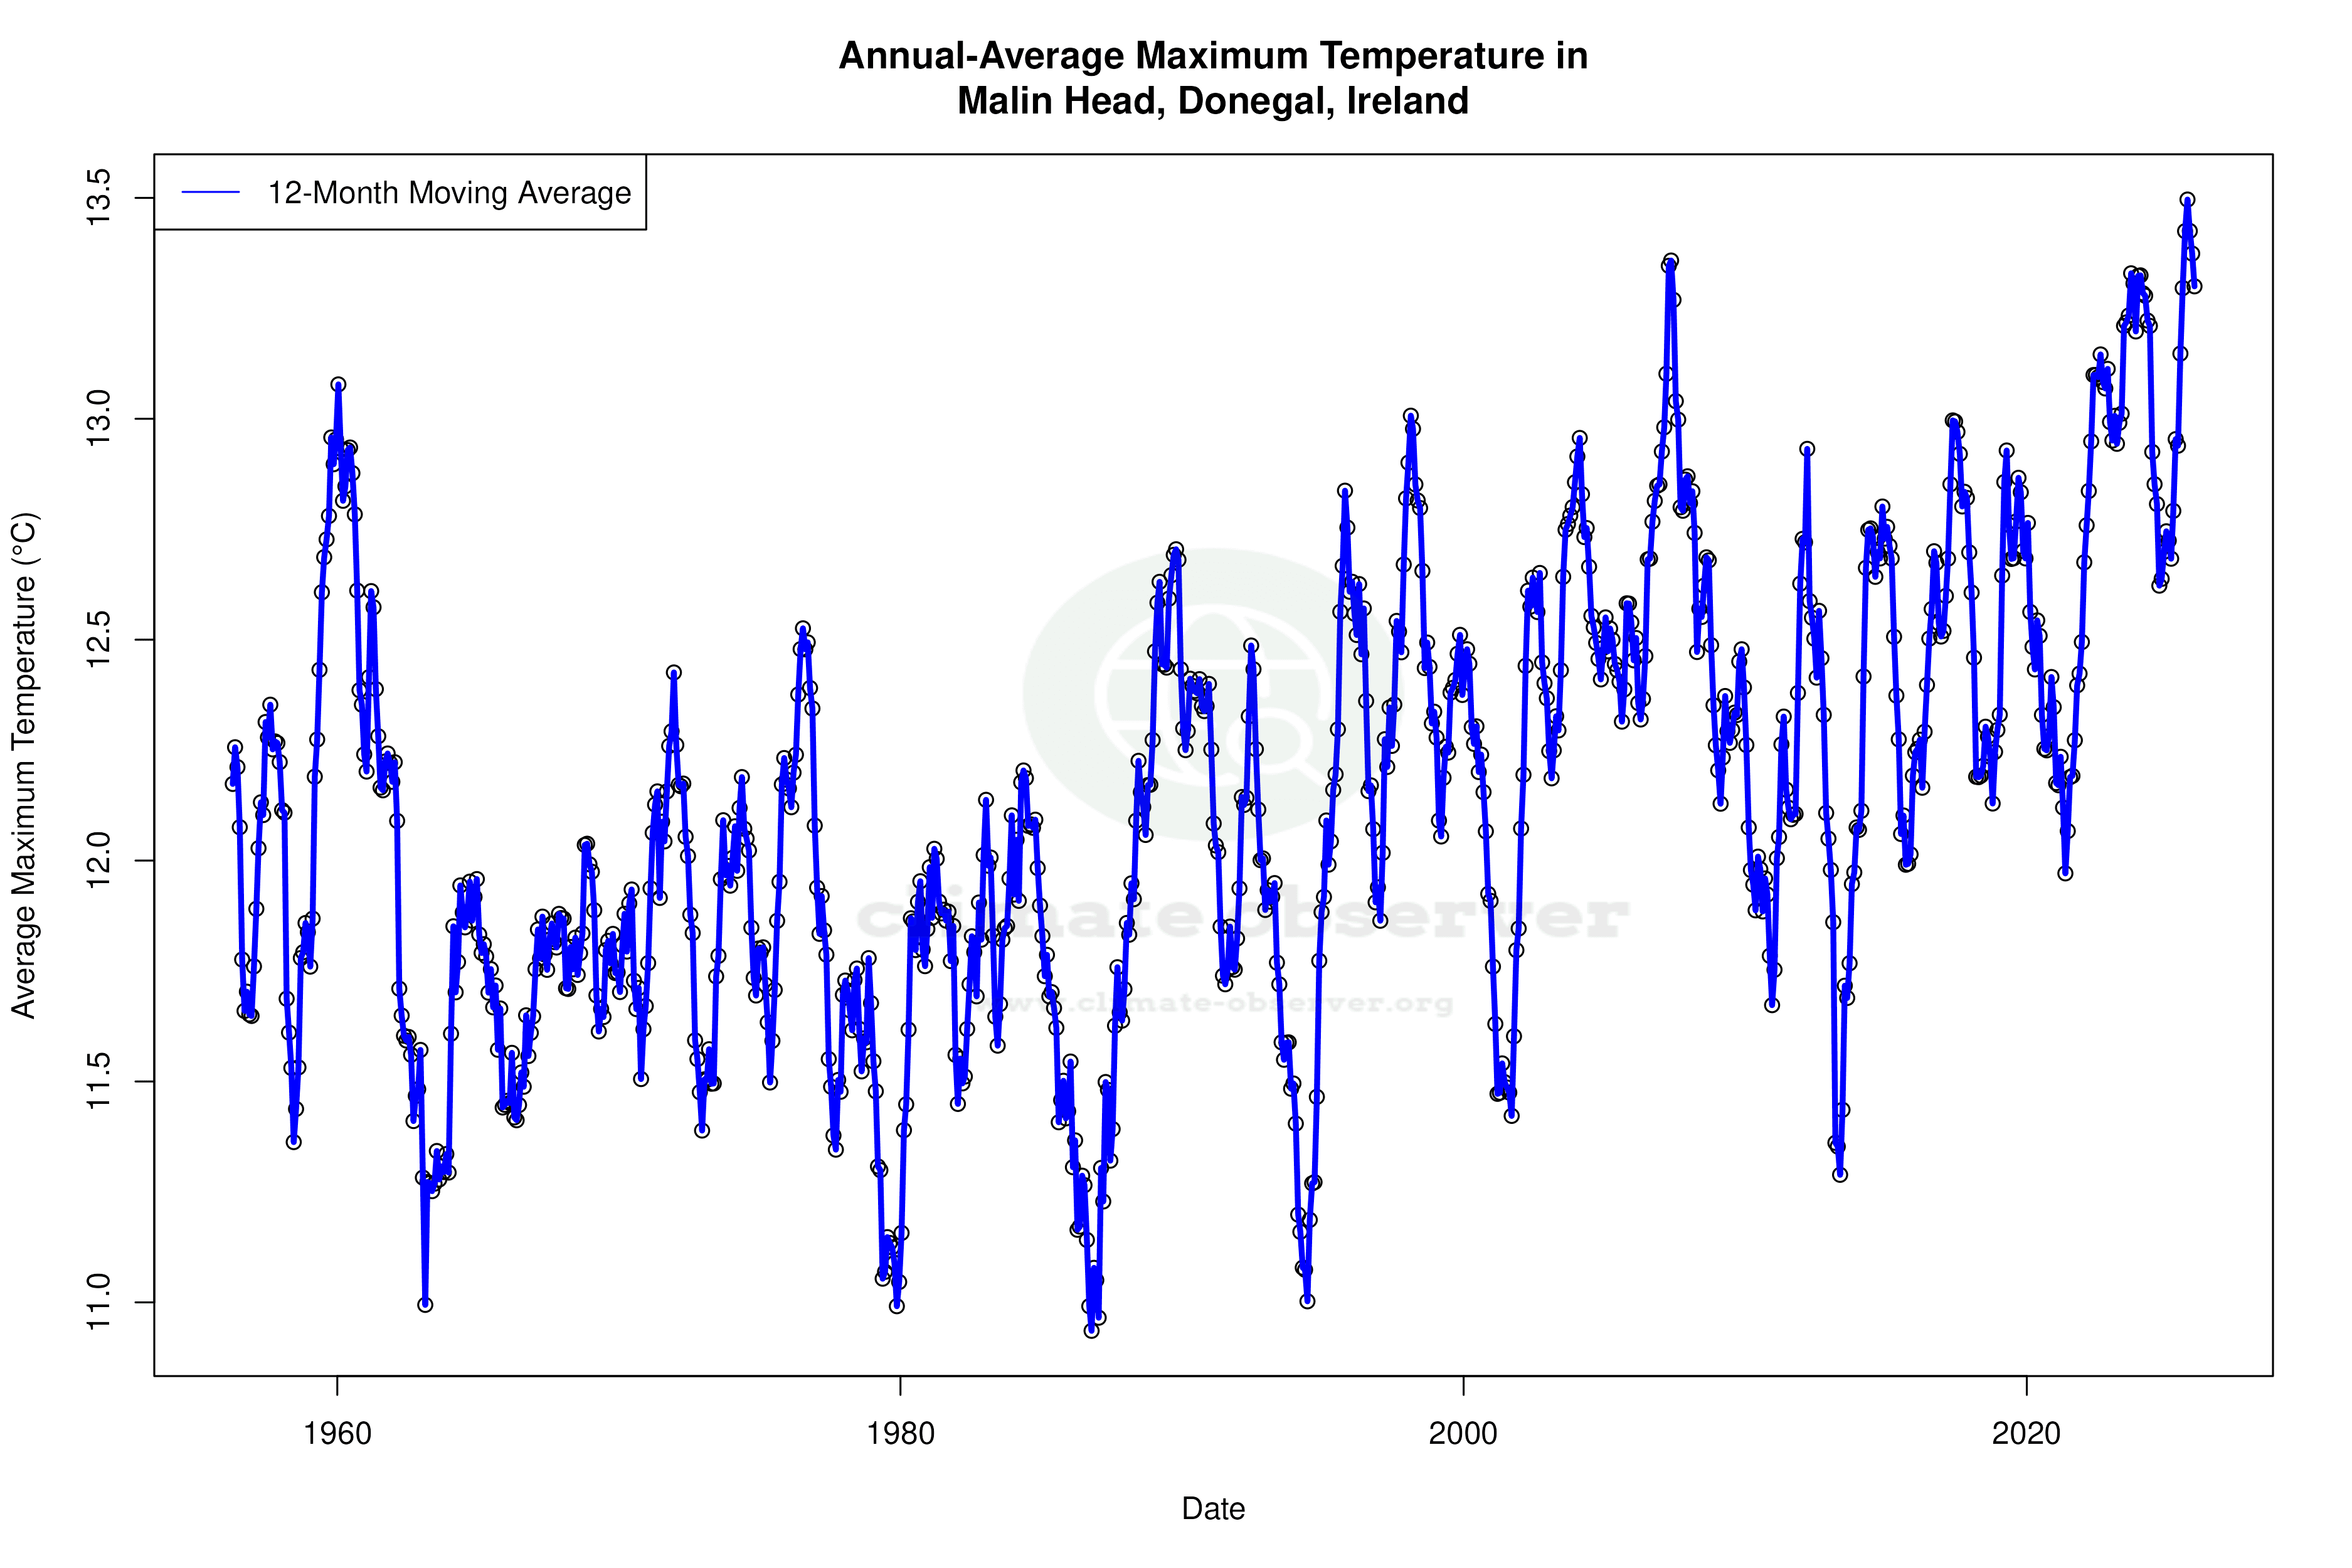
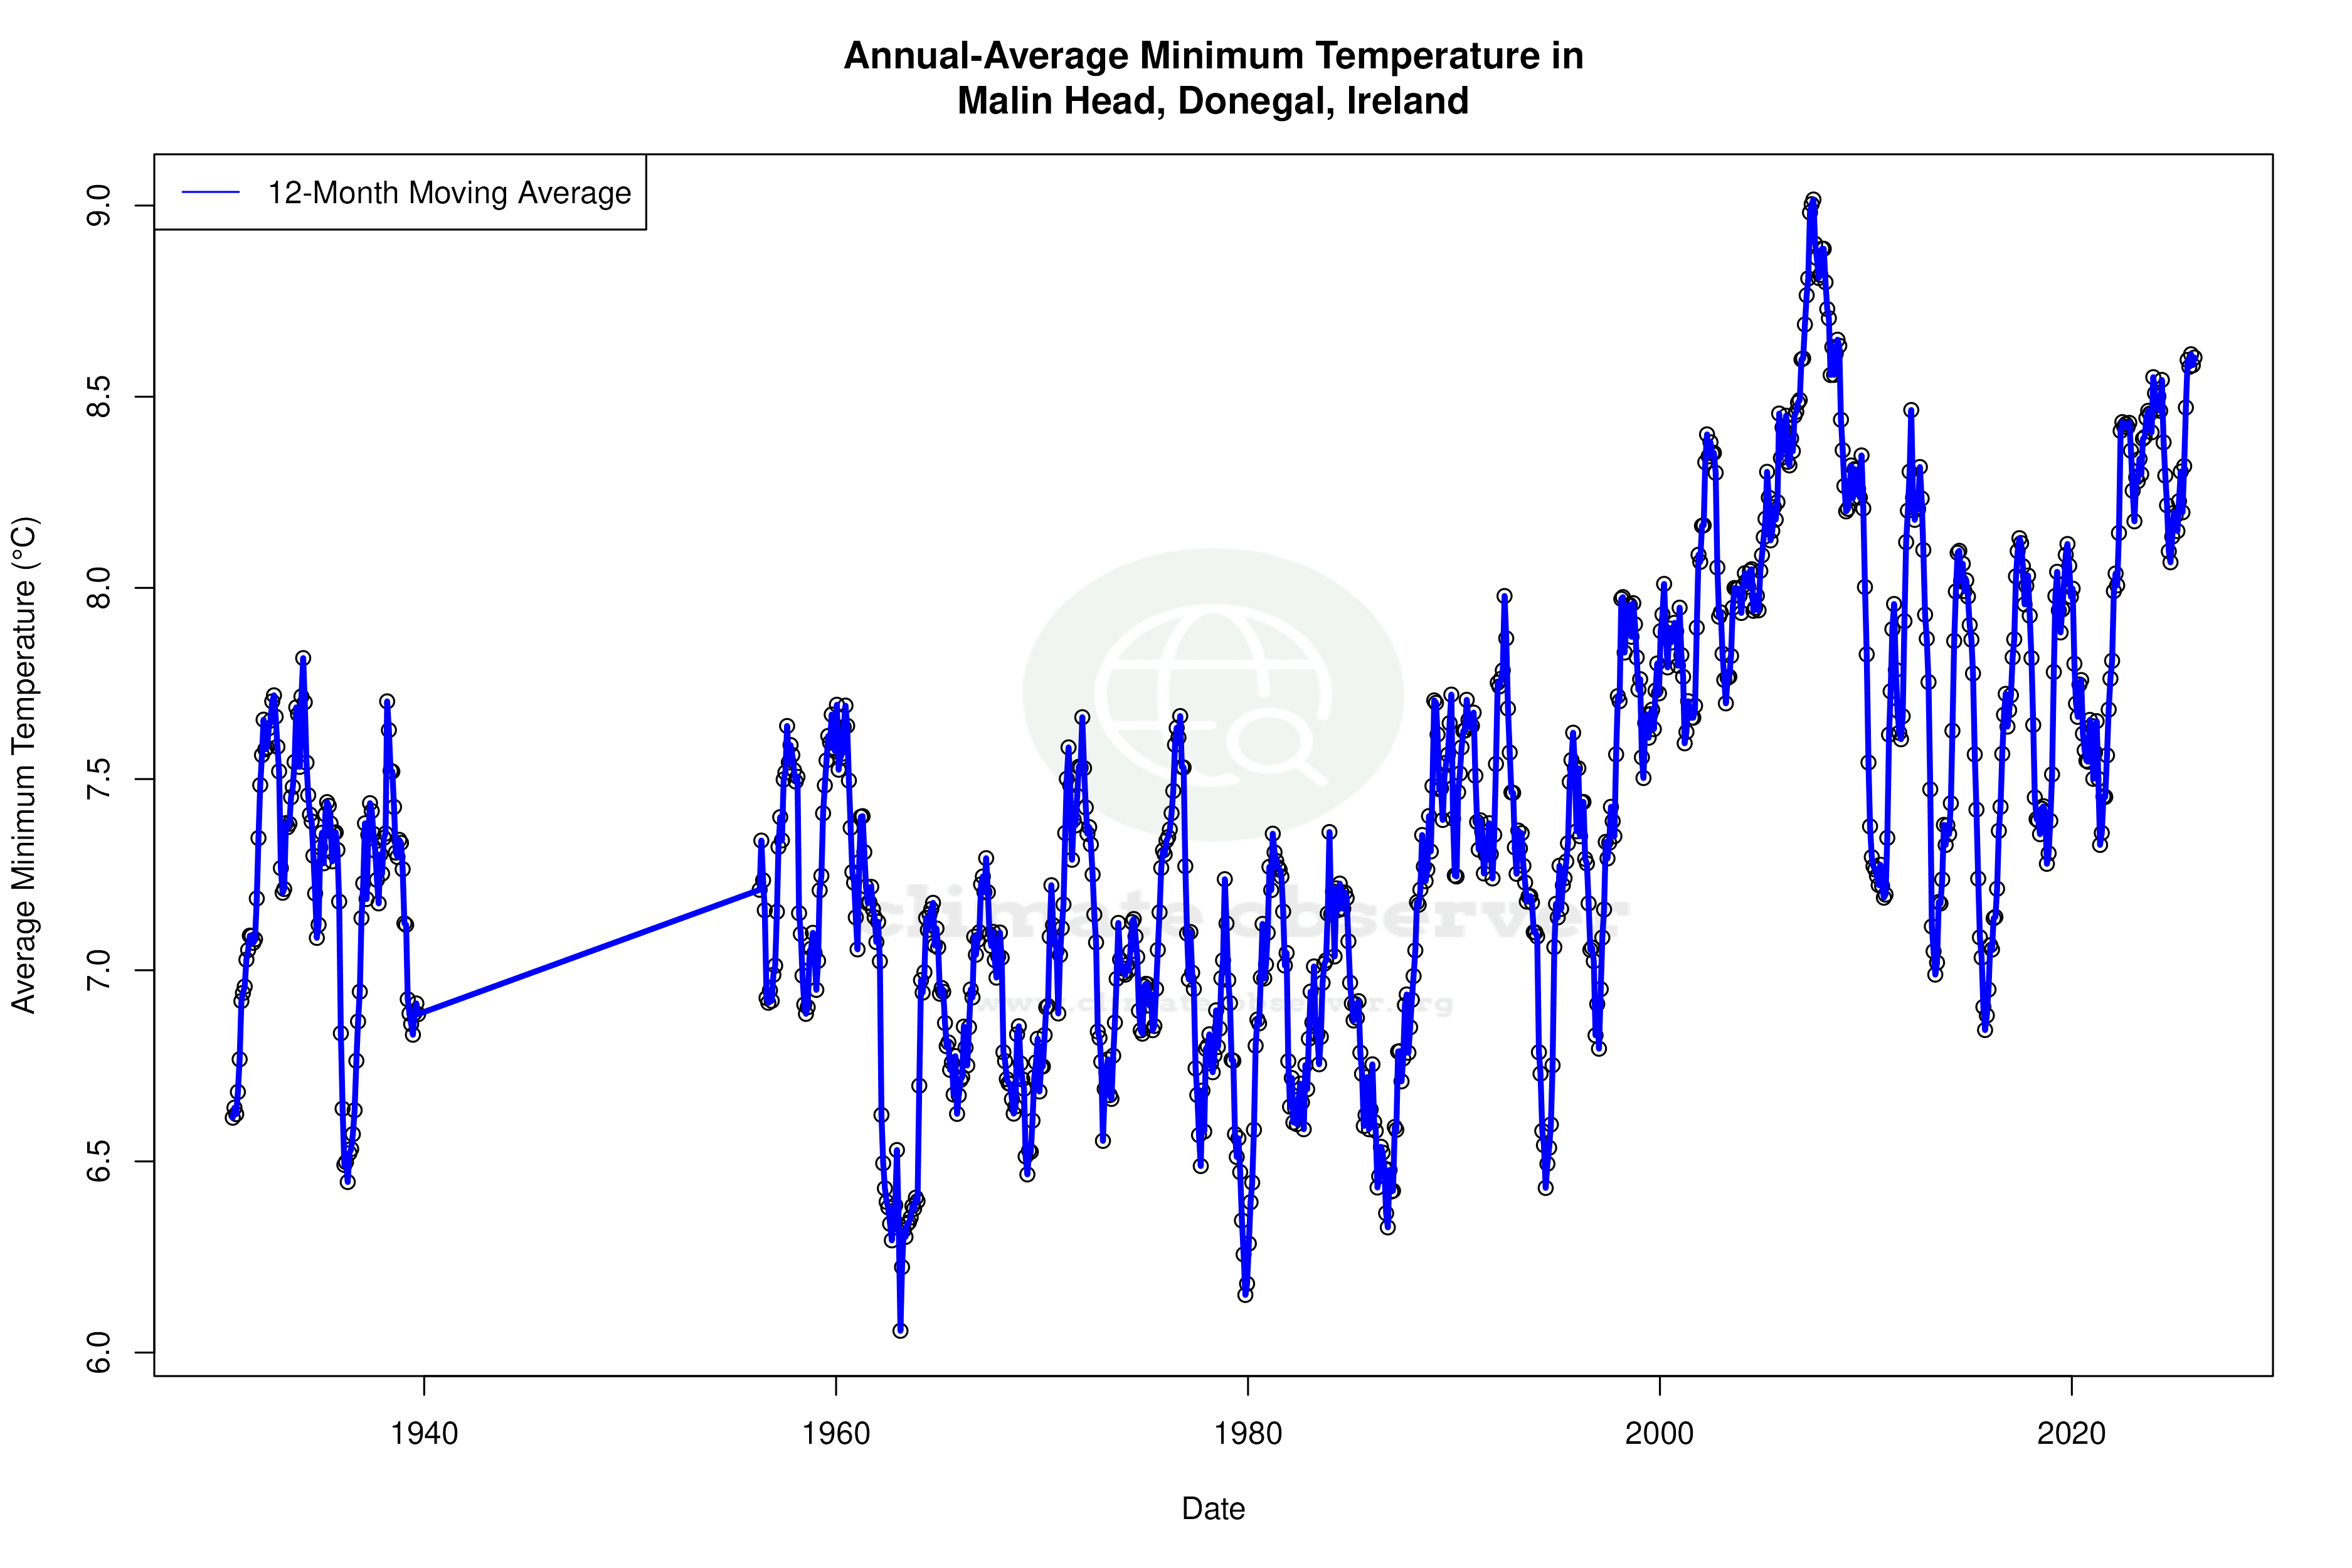


Max Temperature 12-Month MA | 1 of 6
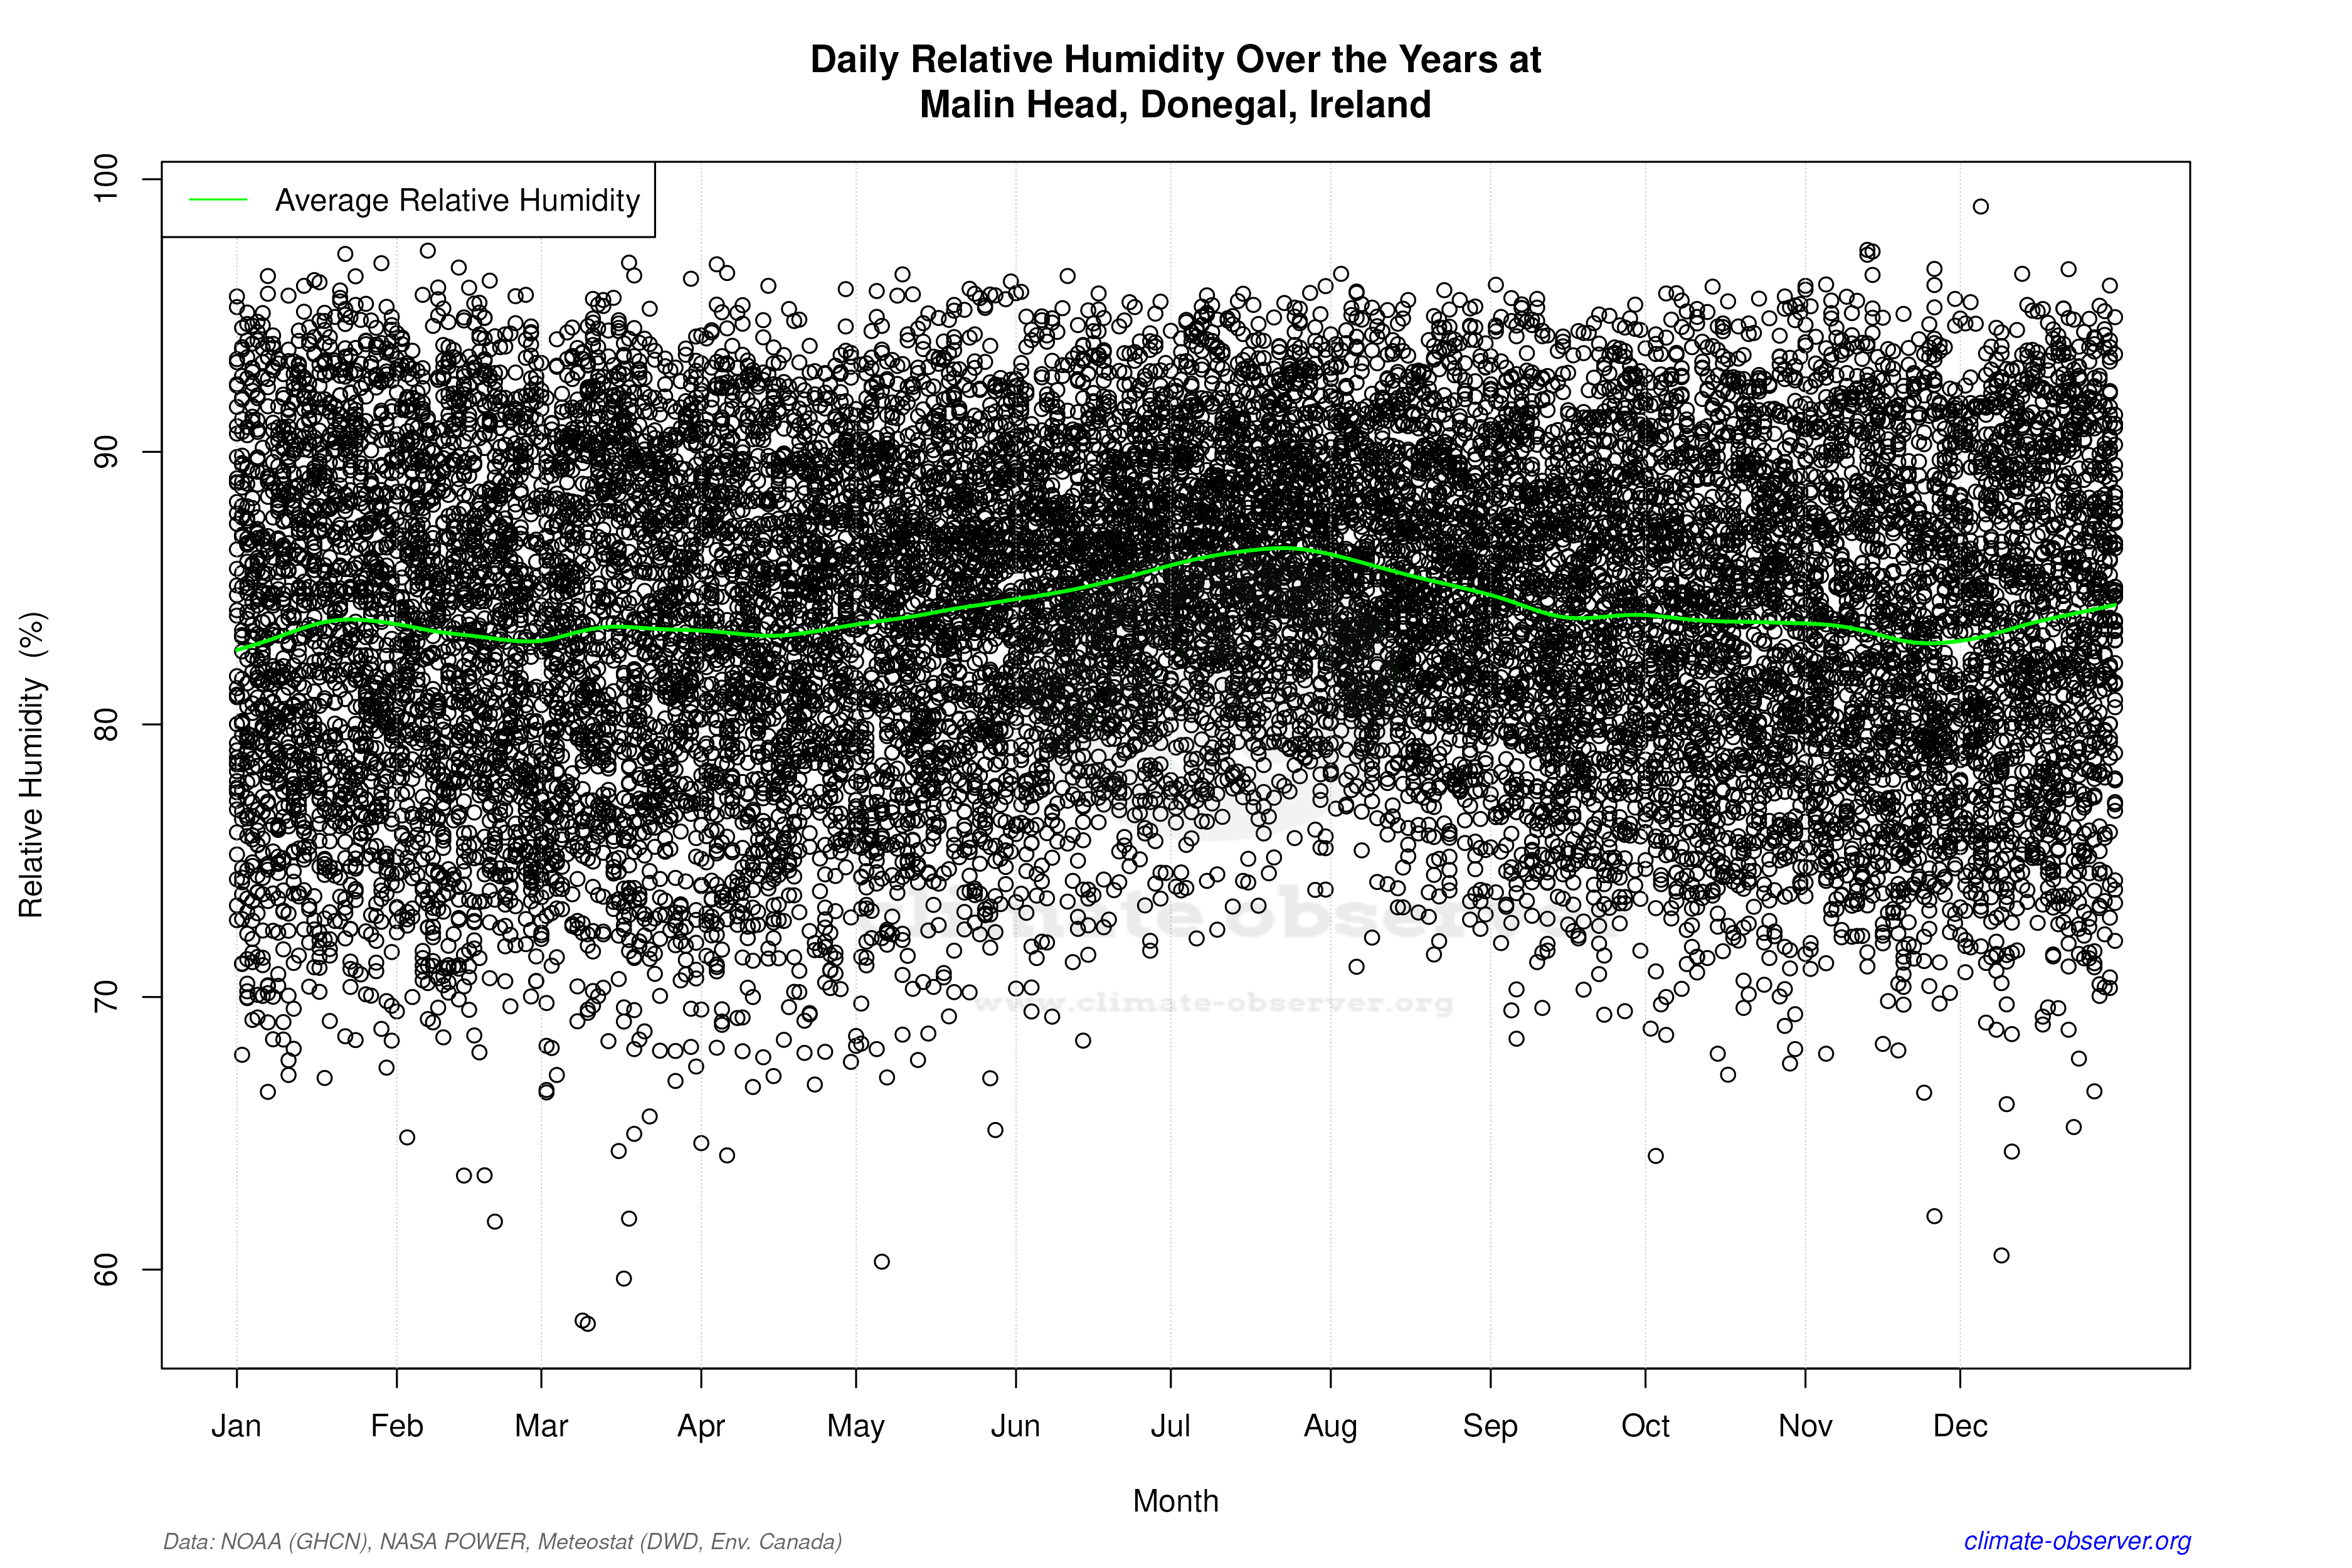
Daily Data Points and Averages Throughout the Year
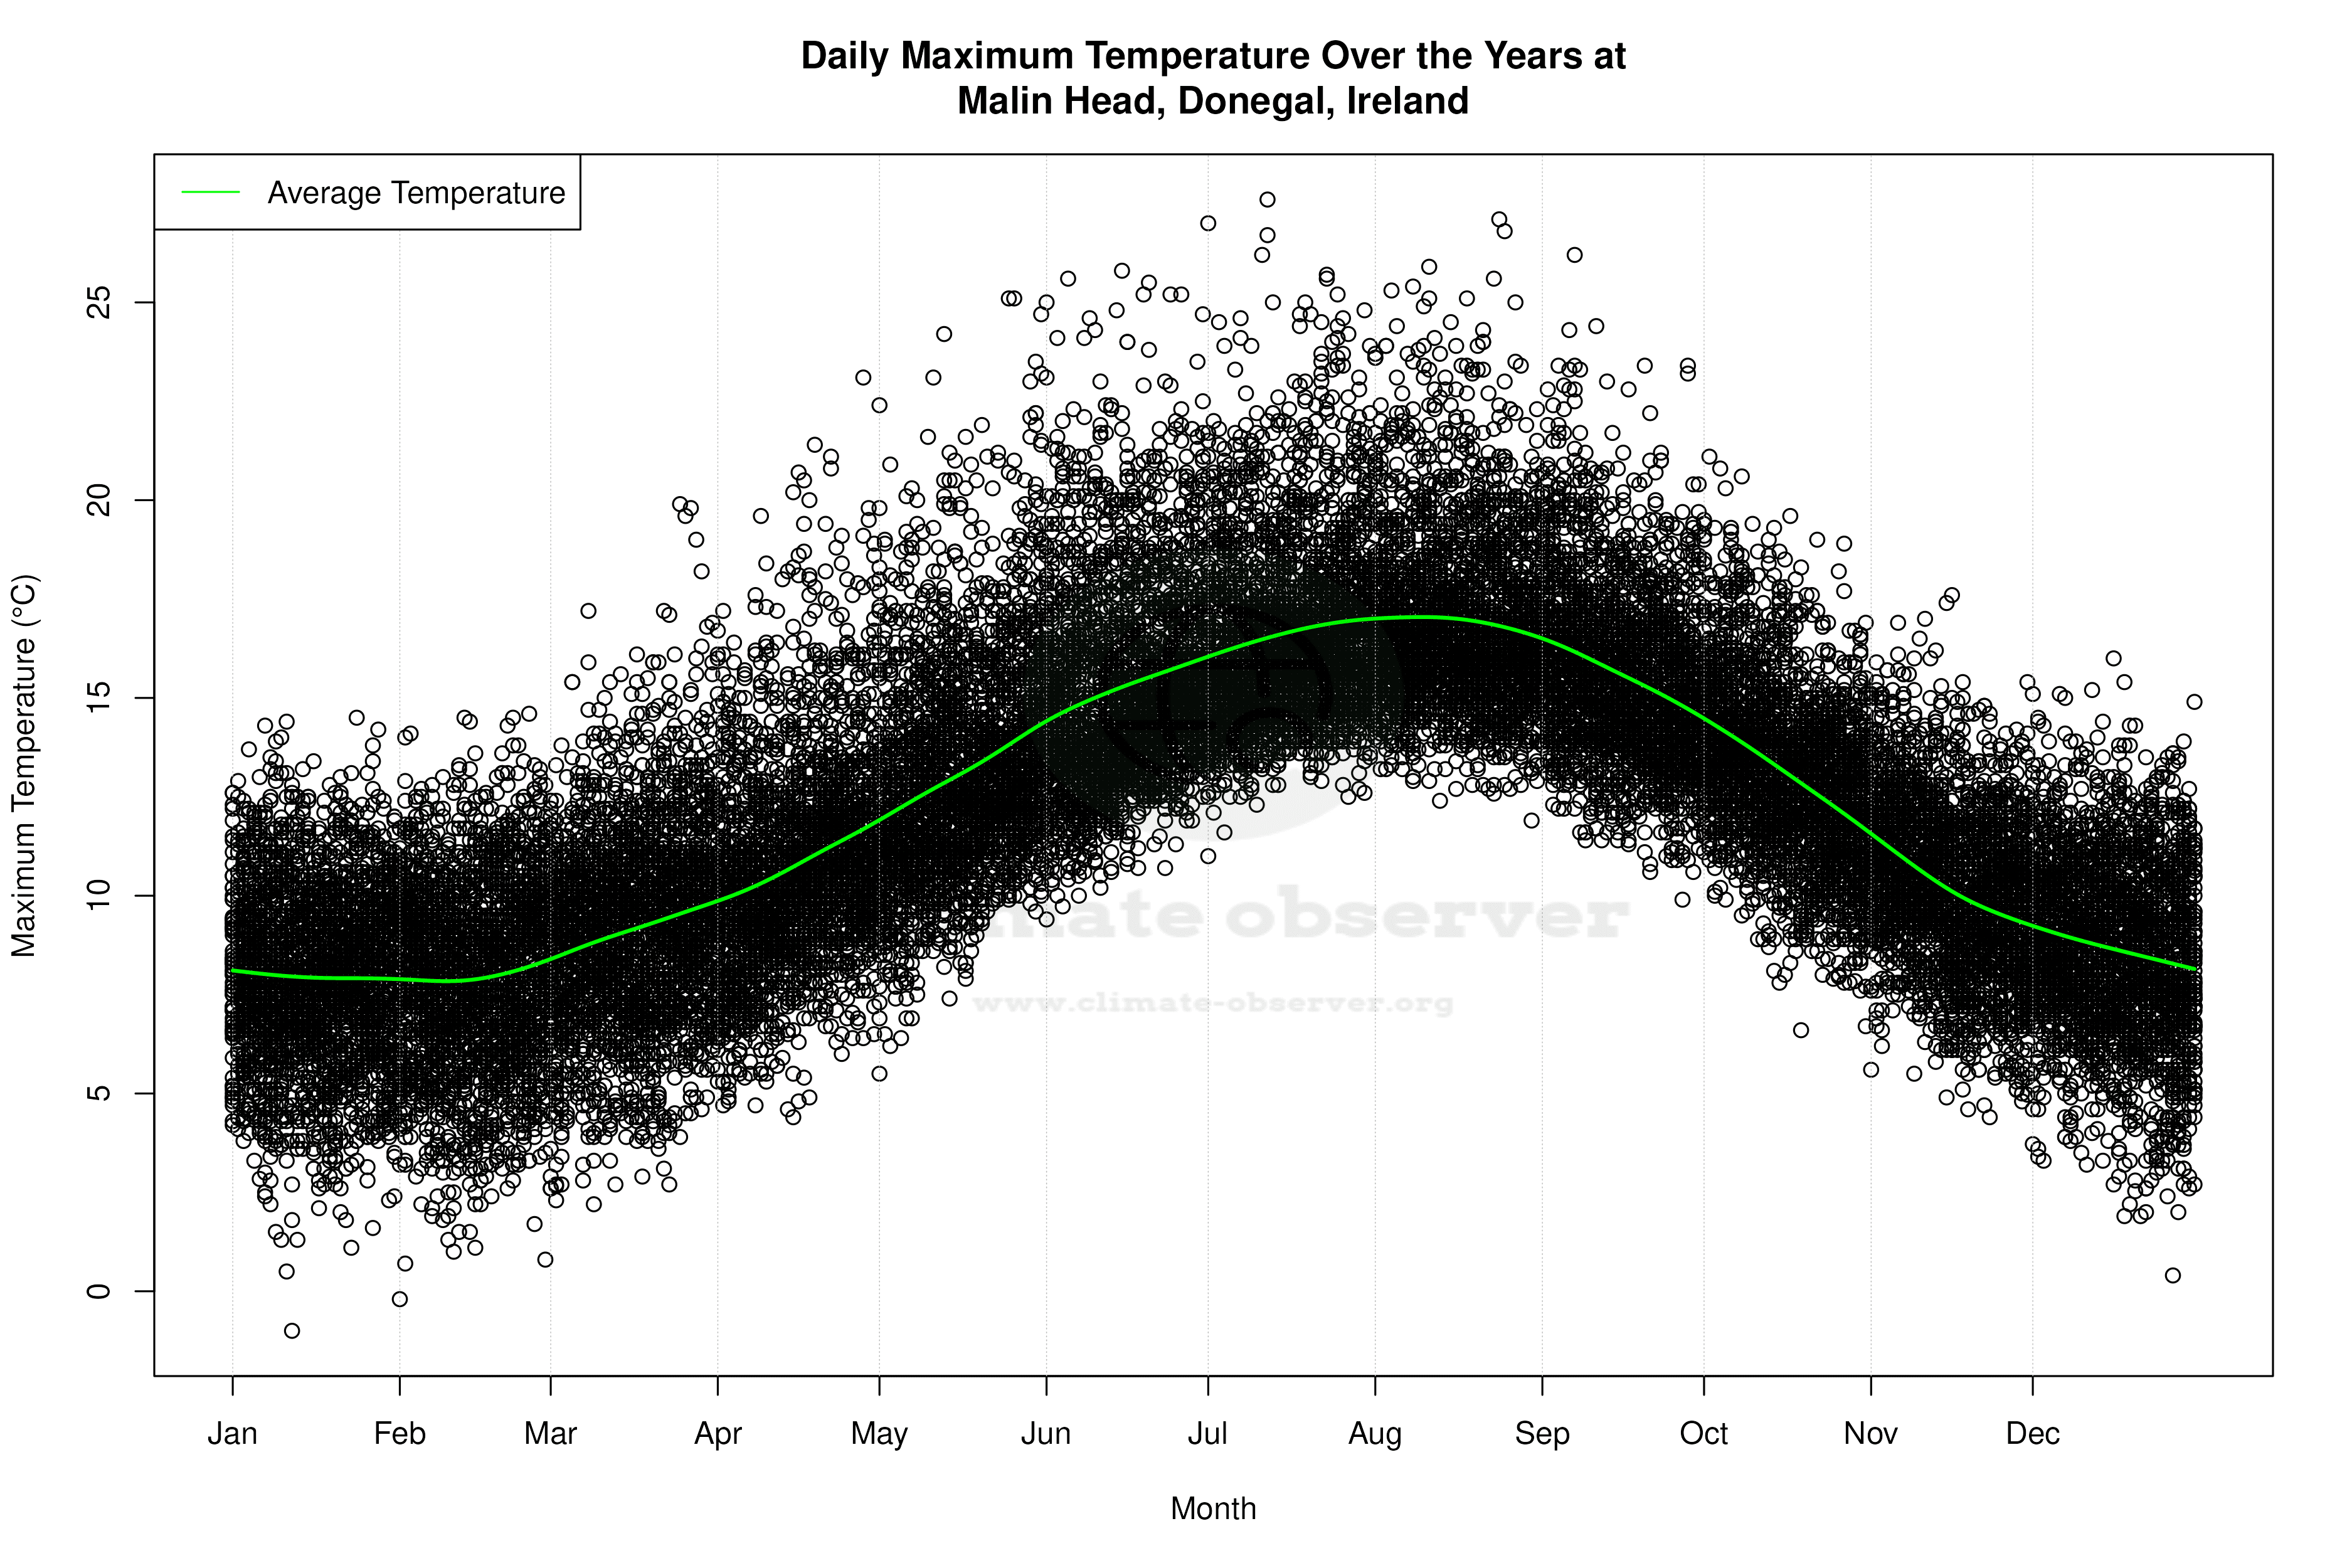

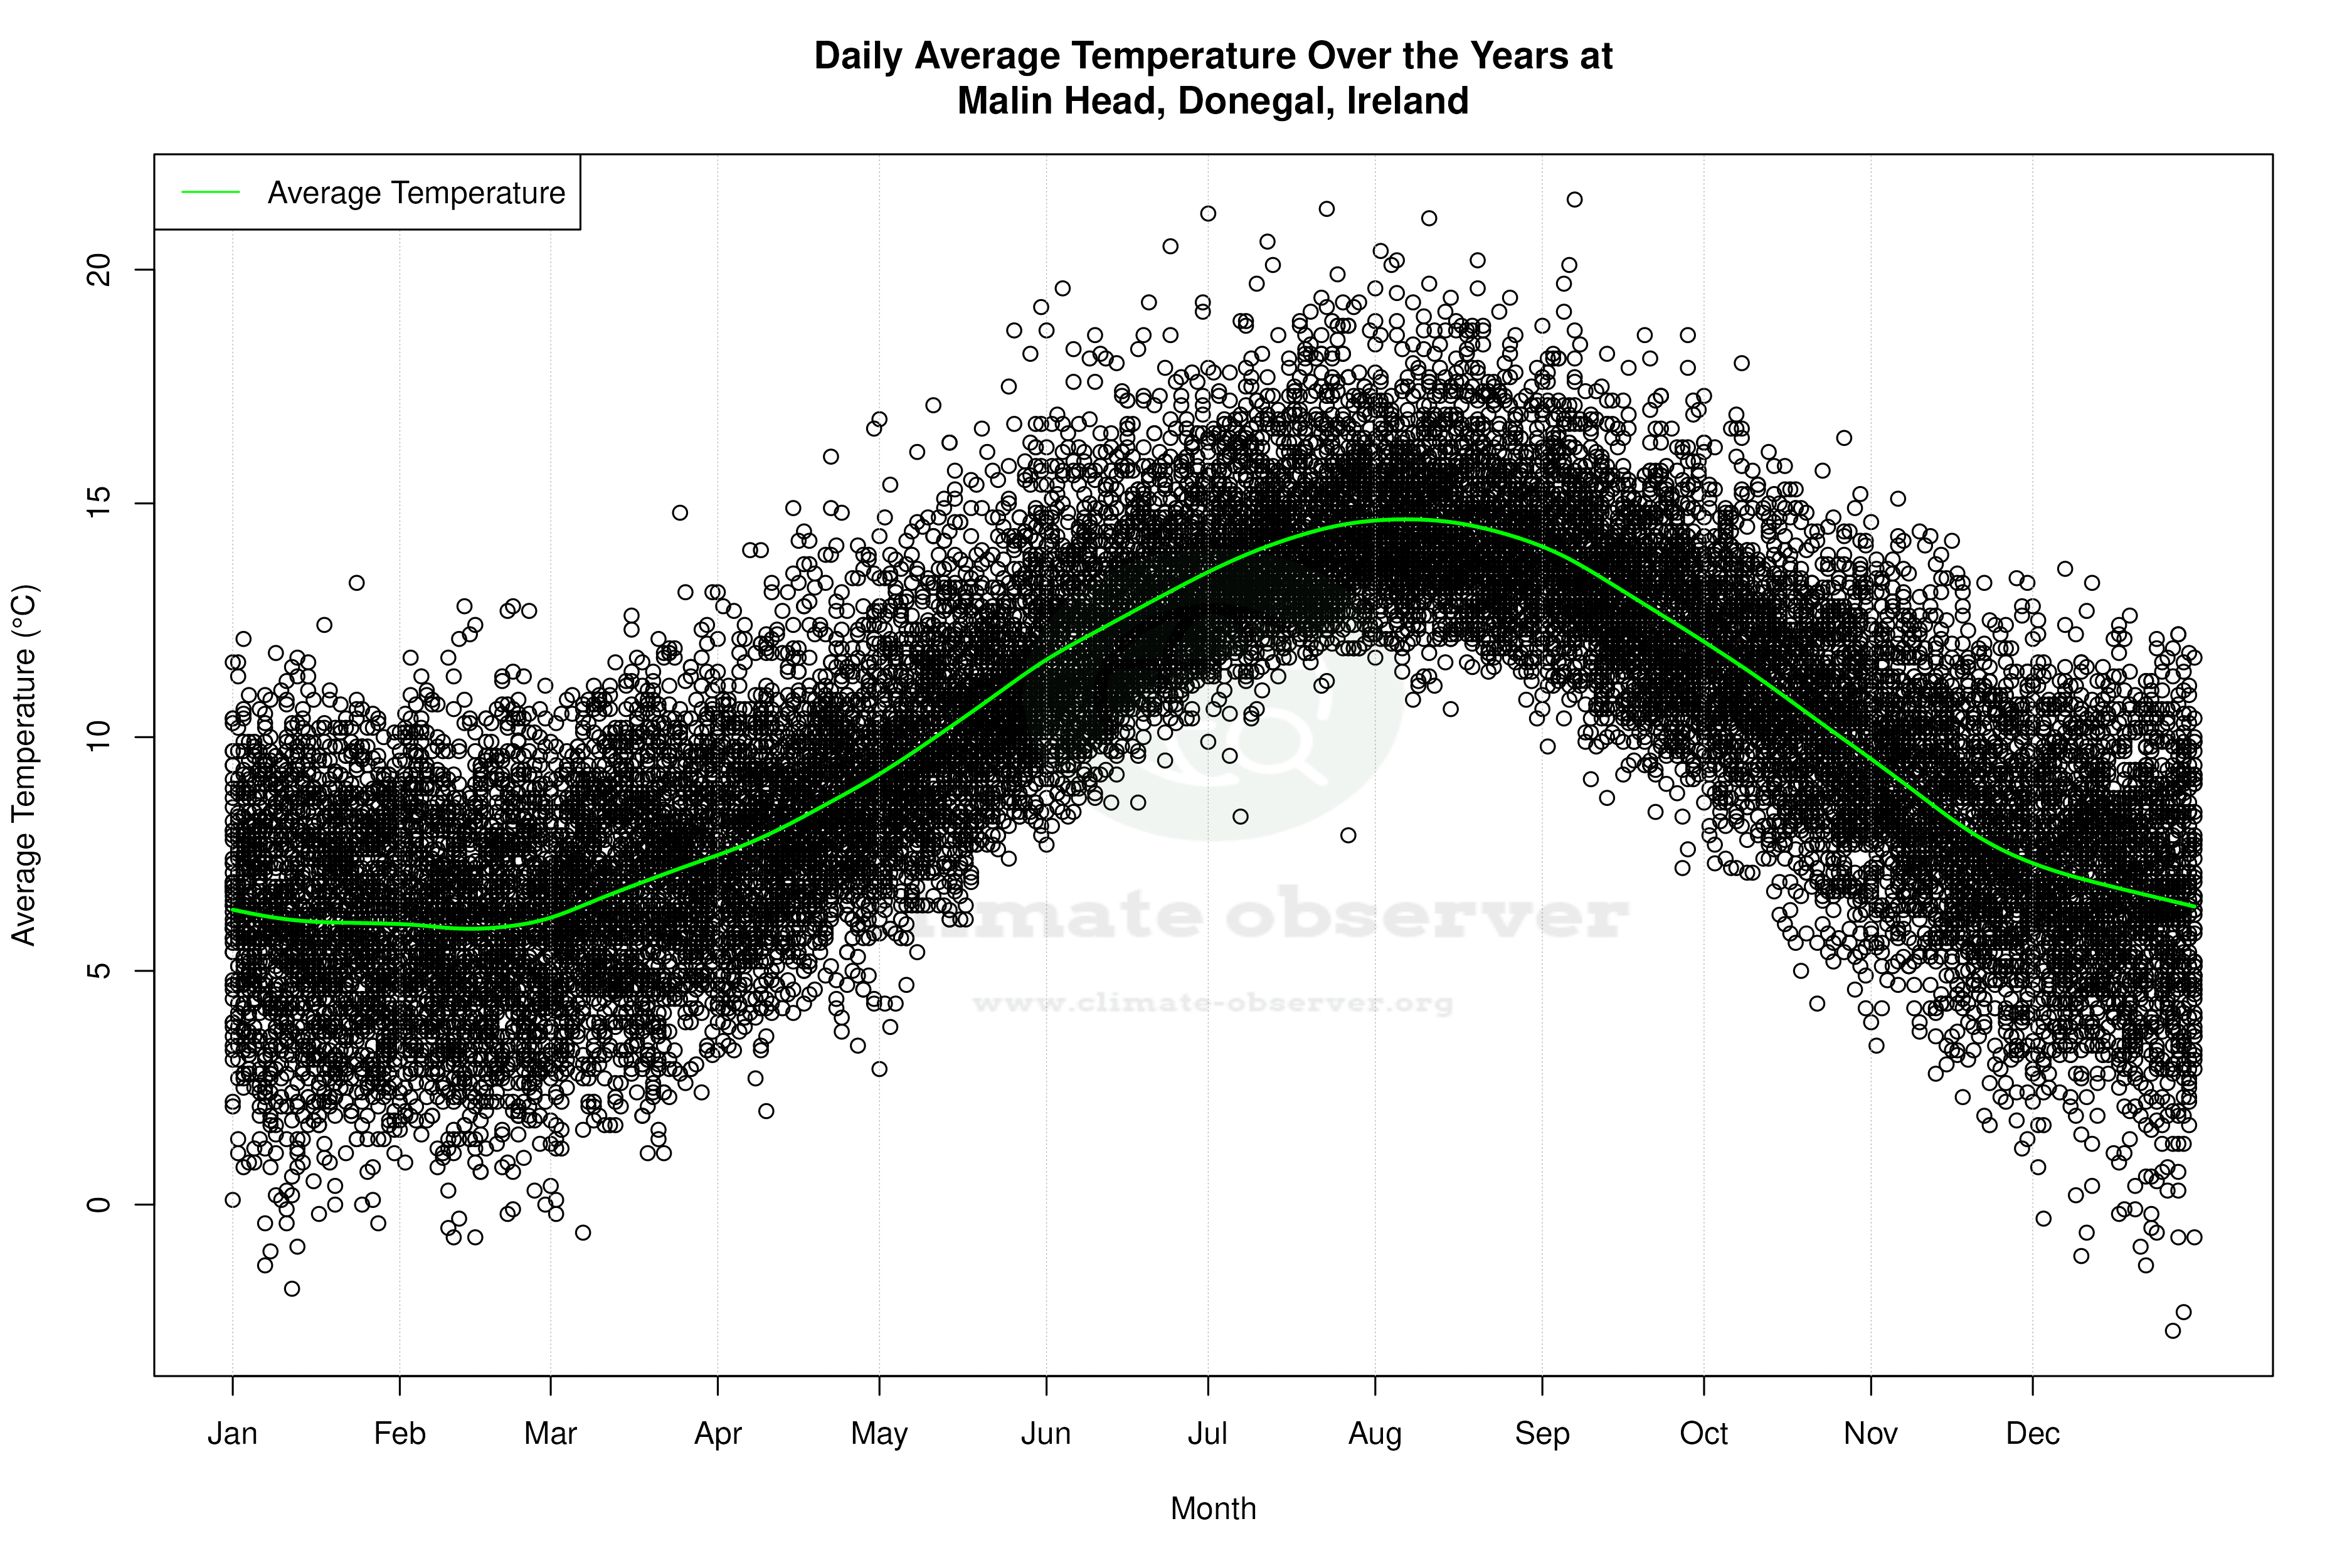

Average Max Temperature Throughout Year | 1 of 5
