Climate for Station: Acajutla, Sonsonate, El Salvador
Loading live weather...
Climate Analysis & Overview
Acajutla's climate narrative is marked by a recent warming trend in highs and a cooling trend in lows over the past decade, contrasting with a long-term cooling in highs and warming in lows. The Precipitation Concentration Index indicates a more even distribution of rainfall, reflecting a shift in precipitation patterns.
Geographical and Climatic Context
Acajutla, located at 13.567°N, -89.833°W, sits on the Pacific coast of El Salvador. This region is classified under the Köppen climate system as a tropical savanna climate (Aw), characterised by distinct wet and dry seasons. The nearby Pacific Ocean moderates temperatures, while the coastal geography influences local weather patterns, contributing to the region's unique climatic profile.
Temperature Trends: A Tale of Two Timescales
Over the past decade, Acajutla has experienced a notable warming in high temperatures, with an increase of 2.95°C (5.32°F). This short-term trend suggests a significant regional warming, possibly influenced by broader global climate dynamics. Conversely, low temperatures have cooled by 1.24°C (2.23°F) during the same period, indicating a complex interplay of factors affecting nocturnal temperatures.
In contrast, the all-time trends tell a different story. Highs have cooled slightly by 0.17°C (0.31°F), while lows have warmed by 0.49°C (0.88°F). This long-term cooling in highs suggests a historical moderation of extreme heat events, while the warming of lows could be linked to changes in atmospheric conditions or urbanisation effects.
Precipitation Patterns: A More Even Distribution
The Precipitation Concentration Index (PCI) serves as a measure of how rainfall is distributed over time. Acajutla's PCI has decreased from a baseline of 17.5 to a current value of 14.8, indicating a more even distribution of precipitation events. This shift suggests that rainfall is becoming less concentrated in intense downpours and more evenly spread throughout the year, which could have implications for water management and agricultural practices.
Temperature Extremes: Record Highs and Lows
Acajutla's climate extremes are marked by a record high of 39.5°C (103.1°F) and a record low of 15.6°C (60.1°F). These figures highlight the potential for significant thermal variability in the region, which can impact both natural ecosystems and human activities.
Regional Climate Goals and Implications
El Salvador has been proactive in addressing climate change, aiming to enhance resilience and adapt to changing weather patterns. The trends observed in Acajutla, particularly the recent warming of highs and the more even distribution of rainfall, align with regional efforts to understand and mitigate climate impacts. These insights are crucial for informing policy and guiding sustainable development initiatives in the face of evolving climatic conditions.
Station Statistics
10-Year Trend
High: +2.58 °C/decade
Low: -0.98 °C/decade
Rain: -2.23 mm/decade
25-Year Trend
High: +0.30 °C/decade
Low: +0.32 °C/decade
Rain: +0.74 mm/decade
50-Year Trend
High: -0.27 °C/decade
Low: +0.53 °C/decade
Rain: +0.77 mm/decade
All-Time Trend
High: -0.16 °C/decade
Low: +0.48 °C/decade
Rain: +0.77 mm/decade
Percentage Above-Average Days
Last 12 Months: 46.0%
This Year: 24.2%
Precipitation Concentration Index (PCI) ℹ️
Last 12 Months: 17.3
Historical Average: 16.9
Percentile Rank of Last 12 Months ℹ️
High: 61st percentile
Low: 70th percentile
Rain: 34th percentile
Change in Variance ℹ️
High: +18.5%
Low: -40.8%
Intraday: -0.8%
Data Coverage
83.6%
First Year of Data
1962
Station Location
Historical Weather Records
| Max High | Avg High | Min High | Max Avg | Avg Avg | Min Avg | Max Low | Avg Low | Min Low | Max Precipitation | Avg Precipitation | Max Snow | Avg Snow | |
|---|---|---|---|---|---|---|---|---|---|---|---|---|---|
| Record | 39.5 °C | — | 24.4 °C | 35.4 °C | — | 21.4 °C | 29.6 °C | — | 15.6 °C | 496.1 mm | — | — | — |
| January | 38.5 °C | 32.0 °C | 26.1 °C | 33.2 °C | 27.9 °C | 22.0 °C | 27.3 °C | 23.1 °C | 17.2 °C | 191.0 mm | 0.5 mm | — | — |
| February | 39.5 °C | 32.4 °C | 27.3 °C | 33.6 °C | 28.2 °C | 23.4 °C | 28.0 °C | 23.6 °C | 16.1 °C | 351.0 mm | 0.6 mm | — | — |
| March | 39.2 °C | 32.8 °C | 27.1 °C | 33.7 °C | 28.9 °C | 24.5 °C | 28.6 °C | 24.4 °C | 17.8 °C | 197.1 mm | 0.4 mm | — | — |
| April | 39.3 °C | 33.0 °C | 27.4 °C | 35.4 °C | 29.4 °C | 24.2 °C | 29.6 °C | 25.3 °C | 17.4 °C | 196.1 mm | 1.8 mm | — | — |
| May | 39.3 °C | 32.5 °C | 26.2 °C | 34.6 °C | 29.2 °C | 23.9 °C | 29.2 °C | 25.2 °C | 18.9 °C | 390.9 mm | 5.5 mm | — | — |
| June | 38.2 °C | 31.8 °C | 25.4 °C | 33.2 °C | 28.3 °C | 23.7 °C | 28.7 °C | 24.6 °C | 19.5 °C | 395.0 mm | 8.6 mm | — | — |
| July | 38.1 °C | 32.3 °C | 26.0 °C | 33.8 °C | 28.8 °C | 23.9 °C | 28.6 °C | 24.3 °C | 18.2 °C | 230.9 mm | 6.5 mm | — | — |
| August | 38.0 °C | 32.2 °C | 26.5 °C | 34.3 °C | 28.6 °C | 23.1 °C | 28.5 °C | 24.2 °C | 16.6 °C | 395.0 mm | 8.2 mm | — | — |
| September | 36.5 °C | 31.4 °C | 24.8 °C | 33.2 °C | 27.9 °C | 22.9 °C | 27.7 °C | 24.1 °C | 17.8 °C | 493.0 mm | 8.3 mm | — | — |
| October | 38.5 °C | 31.6 °C | 24.9 °C | 33.0 °C | 28.0 °C | 22.7 °C | 27.8 °C | 24.0 °C | 18.0 °C | 496.1 mm | 7.7 mm | — | — |
| November | 38.0 °C | 32.2 °C | 26.4 °C | 32.9 °C | 28.3 °C | 21.8 °C | 28.0 °C | 23.5 °C | 15.6 °C | 396.0 mm | 2.5 mm | — | — |
| December | 38.2 °C | 32.2 °C | 24.4 °C | 34.0 °C | 28.1 °C | 21.4 °C | 27.8 °C | 23.3 °C | 16.9 °C | 396.0 mm | 0.7 mm | — | — |
Data Visualisations
Remove WatermarksCurrent Year Climate Trends vs Historical


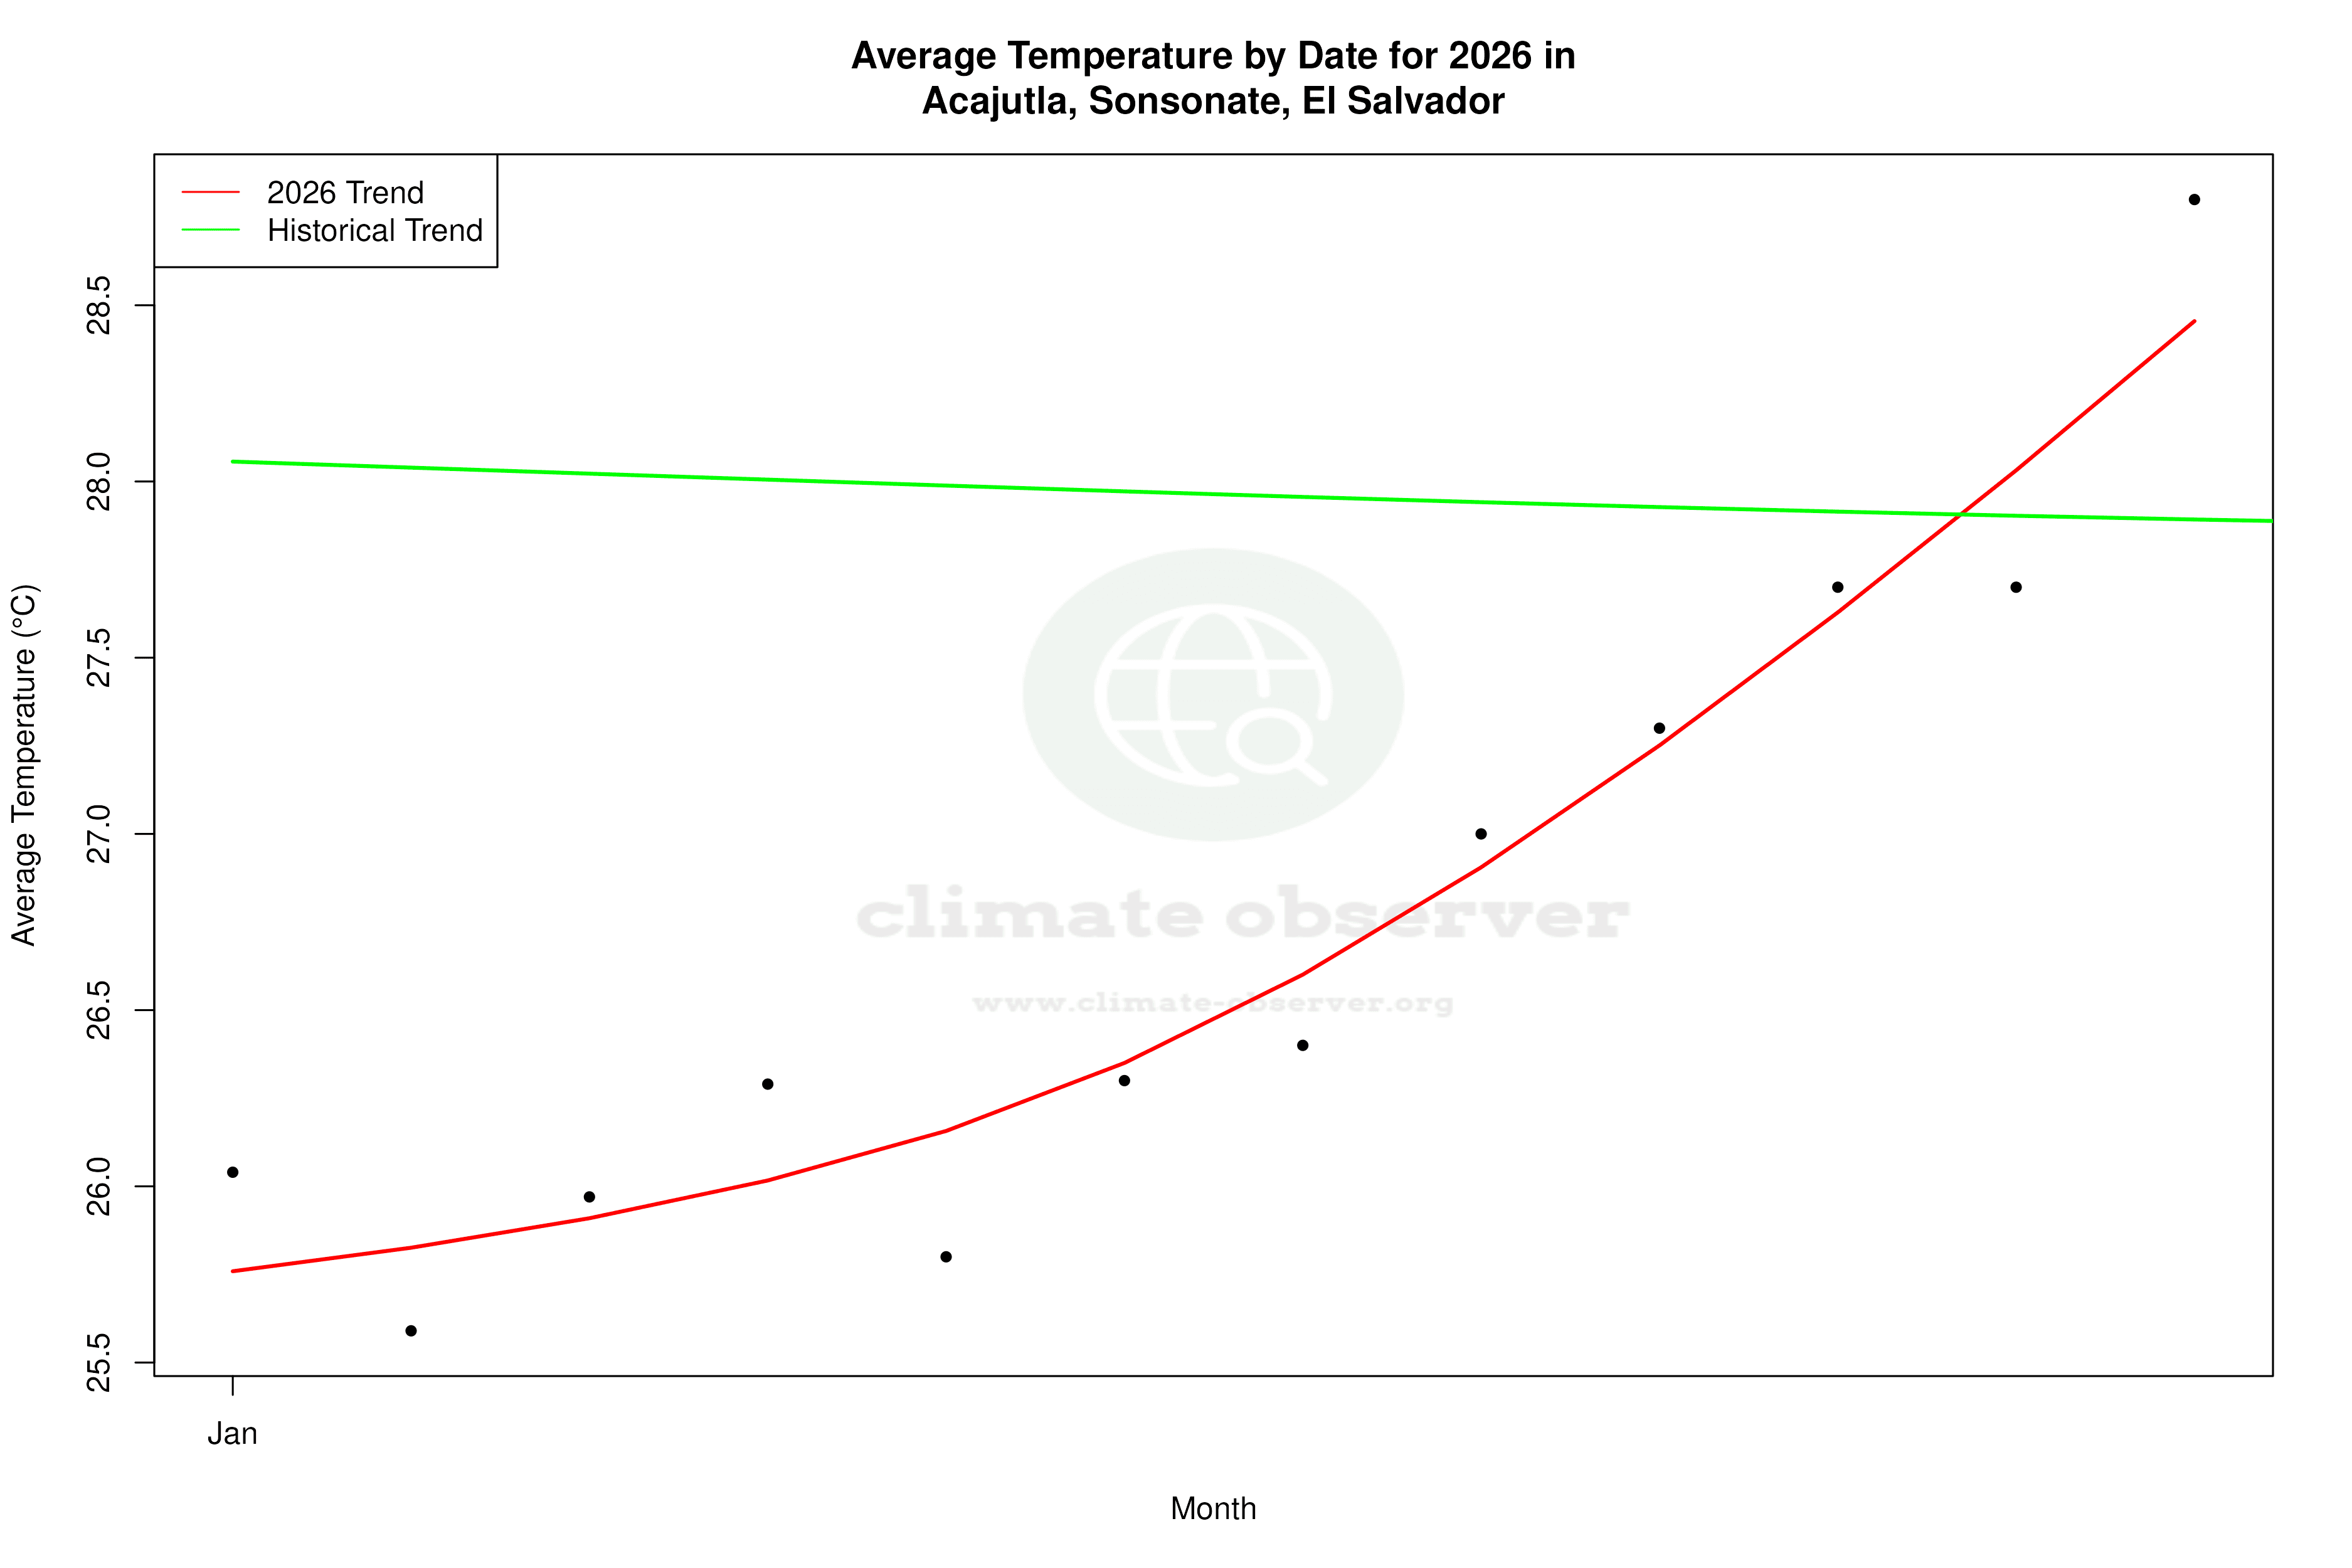


Max Temperature this Year | 1 of 6
Climate 12-Month Moving Averages


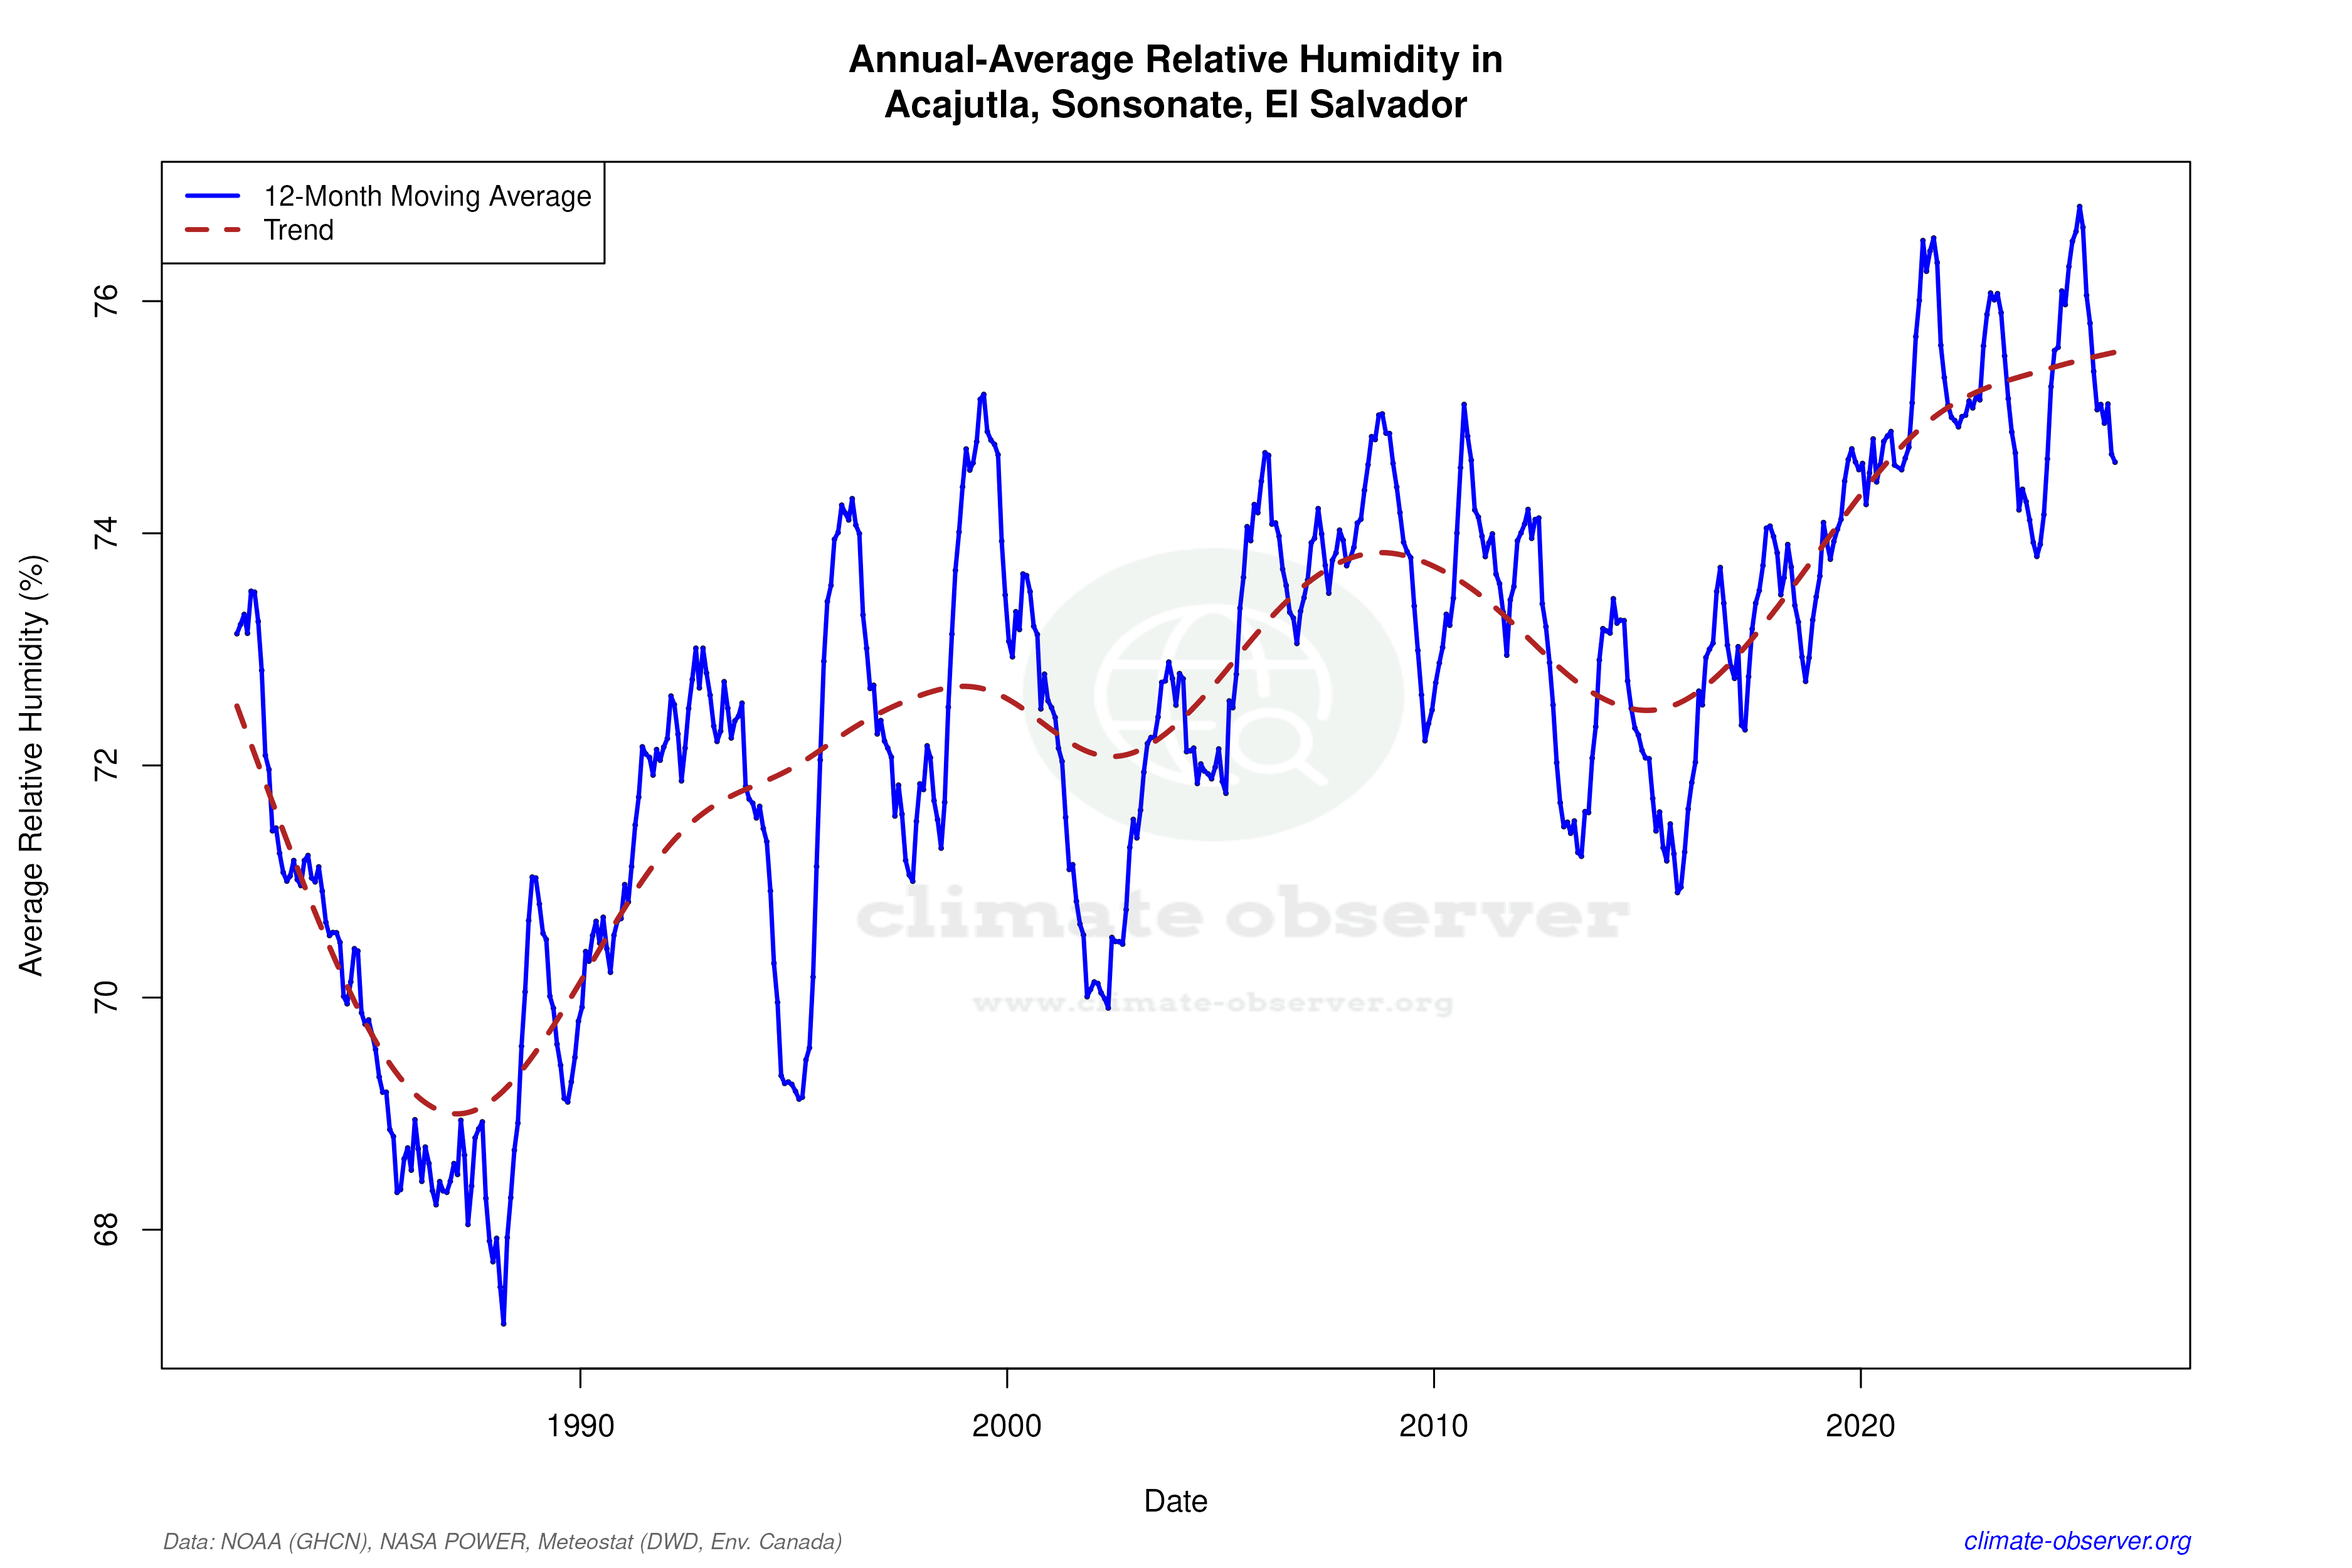

Max Temperature 12-Month MA | 1 of 6
Daily Data Points and Averages Throughout the Year
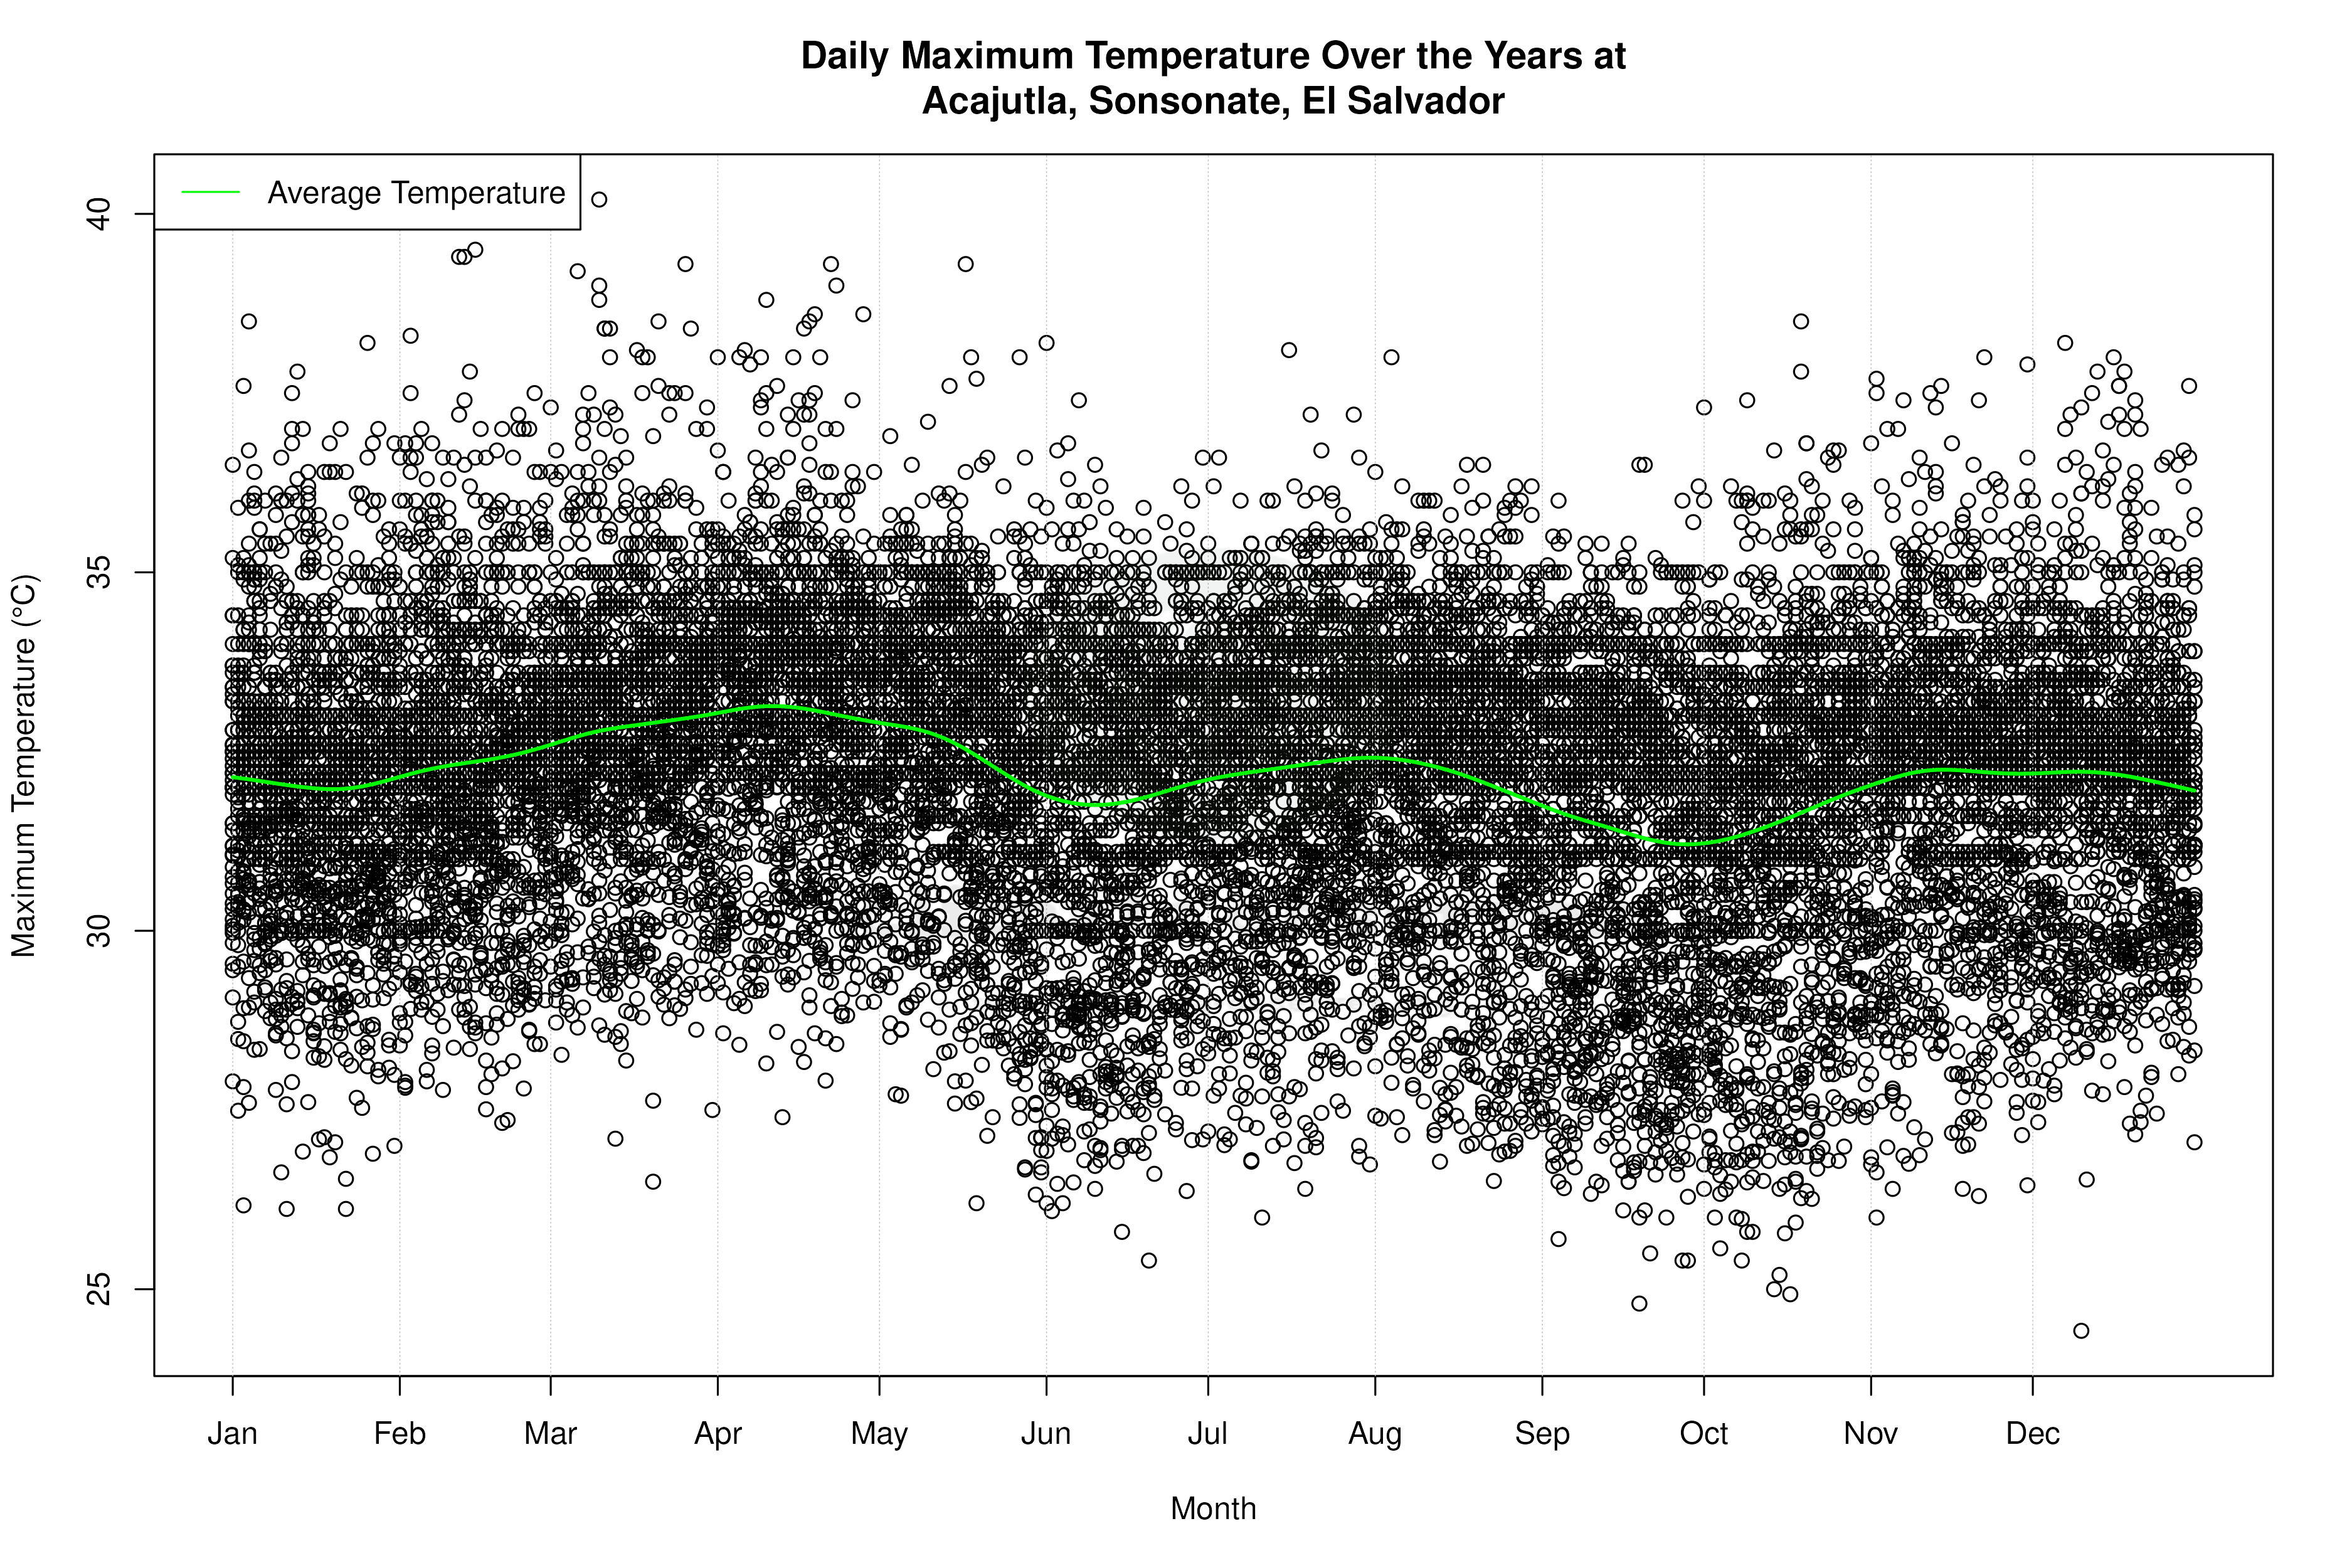


Average Max Temperature Throughout Year | 1 of 5
