Climate for Station: Gore, Oromia, Ethiopia
Loading live weather...
Climate Analysis & Overview
Gore, located in the Oromia region of Ethiopia, is experiencing contrasting temperature trends with a 0.07°C (0.13°F) rise in all-time high temperatures and a 0.04°C (0.07°F) rise in all-time low temperatures. Meanwhile, the past decade has seen a more pronounced divergence with highs increasing by 0.78°C (1.40°F) and lows decreasing by 1.74°C (3.13°F). Precipitation patterns are becoming slightly more evenly distributed, as indicated by a decrease in the Precipitation Concentration Index from 13.41 to 12.51.
Climatic Context and Local Geography
Gore falls under the Köppen climate classification of Cfb, which signifies a temperate oceanic climate with no dry season and a warm summer. The town's location in the highlands of southwestern Ethiopia, surrounded by lush forests and undulating terrain, contributes to its relatively stable and moderate climate. The elevation plays a crucial role in moderating temperatures, preventing extremes that are more common in lower altitudes. This geography influences the area's precipitation patterns, supporting a diverse ecosystem and agricultural activities.
Temperature Trends: A Tale of Divergence
Over the past decade, Gore has witnessed a notable divergence in temperature trends. While the maximum temperatures have risen by 0.78°C (1.40°F), indicating a warming trend, the minimum temperatures have surprisingly fallen by 1.74°C (3.13°F). This suggests an increasing range between daily highs and lows, potentially leading to more significant diurnal temperature variations. Such changes could impact local agriculture and biodiversity, necessitating adaptive strategies to cope with the shifting thermal landscape.
Historical Temperature Records
Gore's historical temperature records reveal a maximum of 34.36°C (93.85°F) and a minimum of 5.60°C (42.08°F). These extremes highlight the potential variability in temperature that the region can experience, although the all-time trends suggest a gradual warming. The relatively mild increase in both high and low temperatures over the long term indicates a slow but steady shift in the region's thermal profile.
Precipitation Patterns: Towards Even Distribution
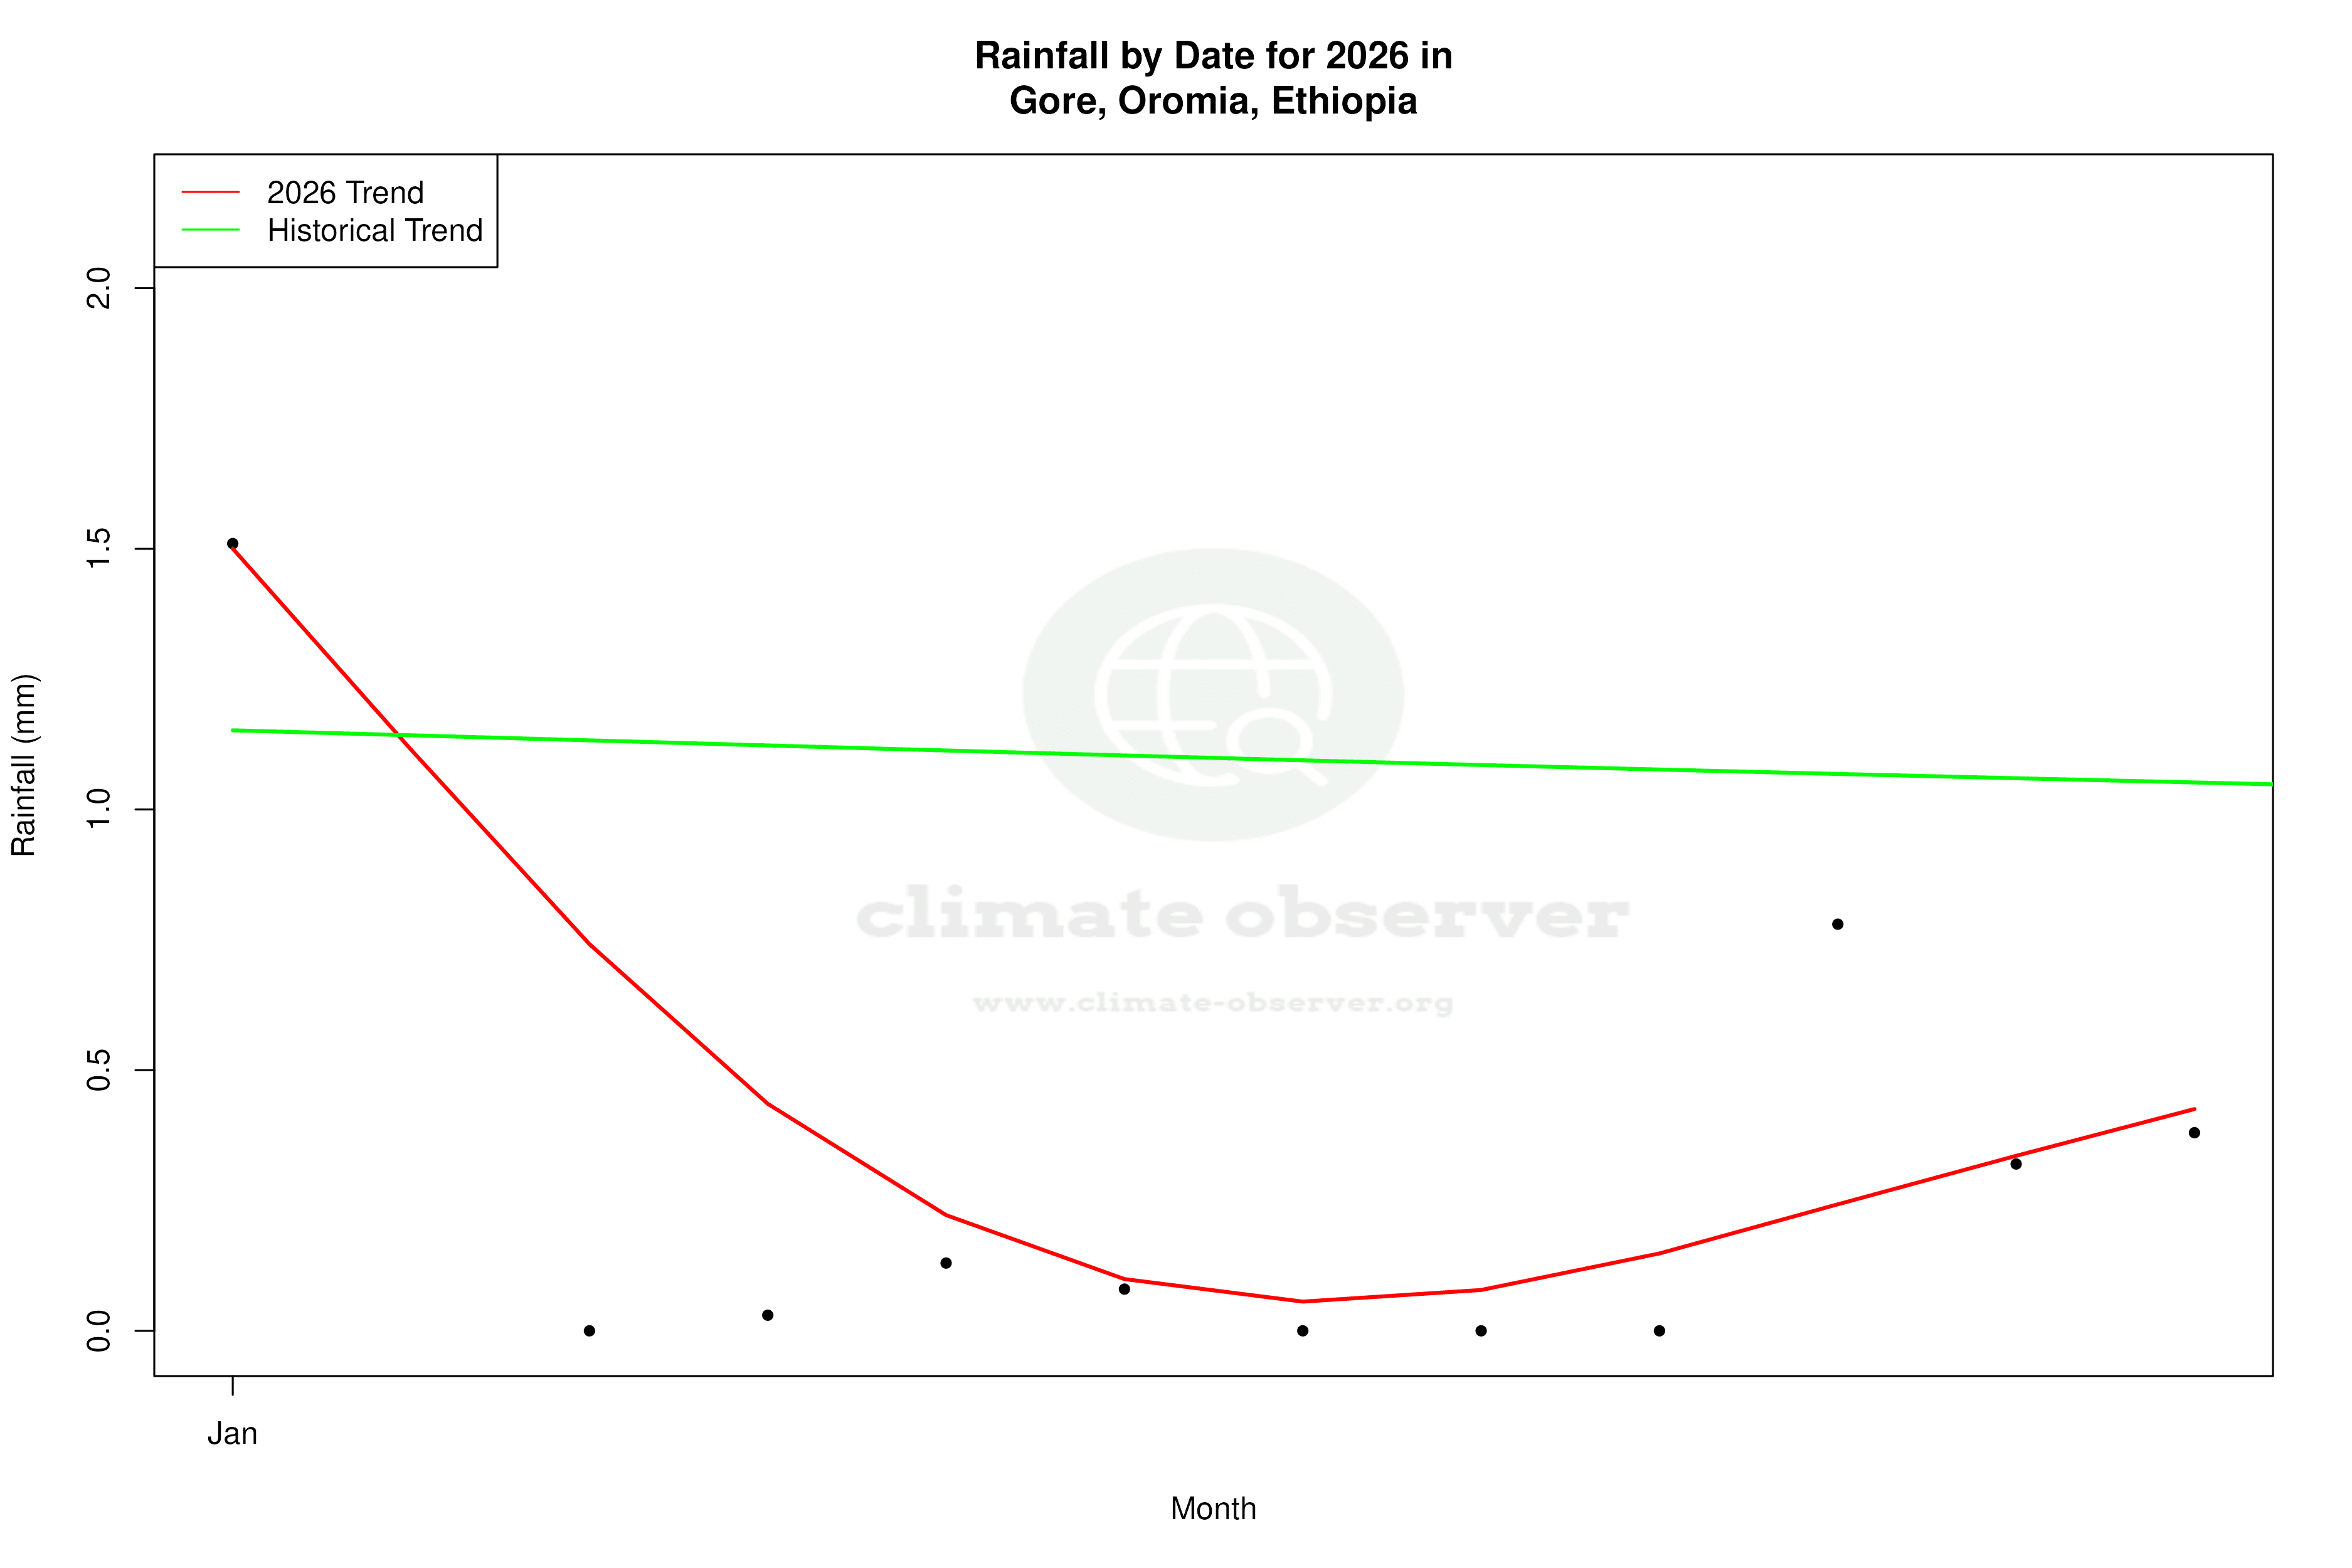
The Precipitation Concentration Index (PCI) for Gore has decreased from 13.41 to 12.51, indicating a slight shift towards more evenly distributed rainfall events. This change suggests that precipitation is becoming less concentrated in a few intense events, which could be beneficial for agriculture by reducing the risk of flooding and soil erosion. However, it may also challenge water management practices, requiring adjustments to capture and store water more effectively.
Regional Climate Goals and Implications
Ethiopia has been actively pursuing climate resilience and sustainable development goals, focusing on enhancing agricultural productivity and ensuring water security. The trends observed in Gore align with these national objectives, as understanding local climatic changes is crucial for developing effective adaptation strategies. The nuanced temperature and precipitation shifts underscore the importance of continued monitoring and research to inform policy and community responses.
Station Statistics
10-Year Trend
High: +0.71 °C/decade
Low: -1.84 °C/decade
Rain: -2.62 mm/decade
25-Year Trend
High: -0.30 °C/decade
Low: -0.40 °C/decade
Rain: +0.73 mm/decade
50-Year Trend
High: +0.09 °C/decade
Low: -0.08 °C/decade
Rain: +0.01 mm/decade
All-Time Trend
High: +0.07 °C/decade
Low: +0.04 °C/decade
Rain: -0.21 mm/decade
Percentage Above-Average Days
Last 12 Months: 52.1%
This Year: 54.0%
Precipitation Concentration Index (PCI) ℹ️
Last 12 Months: 11.3
Historical Average: 12.9
Percentile Rank of Last 12 Months ℹ️
High: 84th percentile
Low: 1st percentile
Rain: 22nd percentile
Change in Variance ℹ️
High: -11.9%
Low: +15.6%
Intraday: +28.3%
Data Coverage
88.3%
First Year of Data
1952
Station Location
Historical Weather Records
| Max High | Avg High | Min High | Max Avg | Avg Avg | Min Avg | Max Low | Avg Low | Min Low | Max Precipitation | Avg Precipitation | Max Snow | Avg Snow | |
|---|---|---|---|---|---|---|---|---|---|---|---|---|---|
| Record | 34.4 °C | — | 14.5 °C | 26.6 °C | — | 13.0 °C | 21.2 °C | — | 5.6 °C | 169.9 mm | — | — | — |
| January | 30.7 °C | 24.7 °C | 17.8 °C | 24.3 °C | 18.7 °C | 14.9 °C | 18.0 °C | 13.0 °C | 5.6 °C | 82.1 mm | 1.0 mm | — | — |
| February | 33.5 °C | 26.1 °C | 17.5 °C | 26.1 °C | 20.0 °C | 14.8 °C | 21.2 °C | 14.1 °C | 6.0 °C | 70.0 mm | 1.4 mm | — | — |
| March | 34.0 °C | 26.5 °C | 17.2 °C | 26.6 °C | 20.6 °C | 14.4 °C | 19.2 °C | 14.6 °C | 7.5 °C | 58.0 mm | 3.0 mm | — | — |
| April | 34.4 °C | 25.5 °C | 17.7 °C | 25.8 °C | 20.0 °C | 14.7 °C | 19.1 °C | 14.6 °C | 8.5 °C | 75.7 mm | 4.6 mm | — | — |
| May | 33.0 °C | 23.5 °C | 17.5 °C | 24.8 °C | 18.6 °C | 13.0 °C | 18.3 °C | 14.0 °C | 6.2 °C | 104.0 mm | 8.3 mm | — | — |
| June | 27.7 °C | 21.5 °C | 15.6 °C | 22.1 °C | 17.2 °C | 14.2 °C | 17.1 °C | 13.2 °C | 8.5 °C | 169.9 mm | 10.7 mm | — | — |
| July | 24.5 °C | 20.3 °C | 14.5 °C | 20.3 °C | 16.4 °C | 13.3 °C | 15.5 °C | 12.9 °C | 8.0 °C | 107.6 mm | 10.0 mm | — | — |
| August | 28.0 °C | 20.7 °C | 15.0 °C | 20.5 °C | 16.6 °C | 13.5 °C | 16.5 °C | 12.9 °C | 9.0 °C | 78.1 mm | 9.8 mm | — | — |
| September | 28.8 °C | 21.5 °C | 15.5 °C | 21.3 °C | 17.0 °C | 13.8 °C | 15.7 °C | 12.8 °C | 9.6 °C | 85.0 mm | 9.9 mm | — | — |
| October | 26.2 °C | 22.6 °C | 17.2 °C | 22.4 °C | 17.6 °C | 14.2 °C | 16.1 °C | 12.9 °C | 8.1 °C | 96.6 mm | 5.8 mm | — | — |
| November | 27.0 °C | 23.0 °C | 16.4 °C | 22.8 °C | 17.7 °C | 14.5 °C | 17.0 °C | 12.7 °C | 7.0 °C | 95.9 mm | 3.1 mm | — | — |
| December | 28.8 °C | 23.6 °C | 17.5 °C | 23.4 °C | 17.9 °C | 14.6 °C | 17.0 °C | 12.7 °C | 6.4 °C | 62.0 mm | 1.4 mm | — | — |
Data Visualisations
Remove WatermarksCurrent Year Climate Trends vs Historical


Max Temperature this Year | 1 of 6
Climate 12-Month Moving Averages


Max Temperature 12-Month MA | 1 of 6
Daily Data Points and Averages Throughout the Year


Average Max Temperature Throughout Year | 1 of 5
